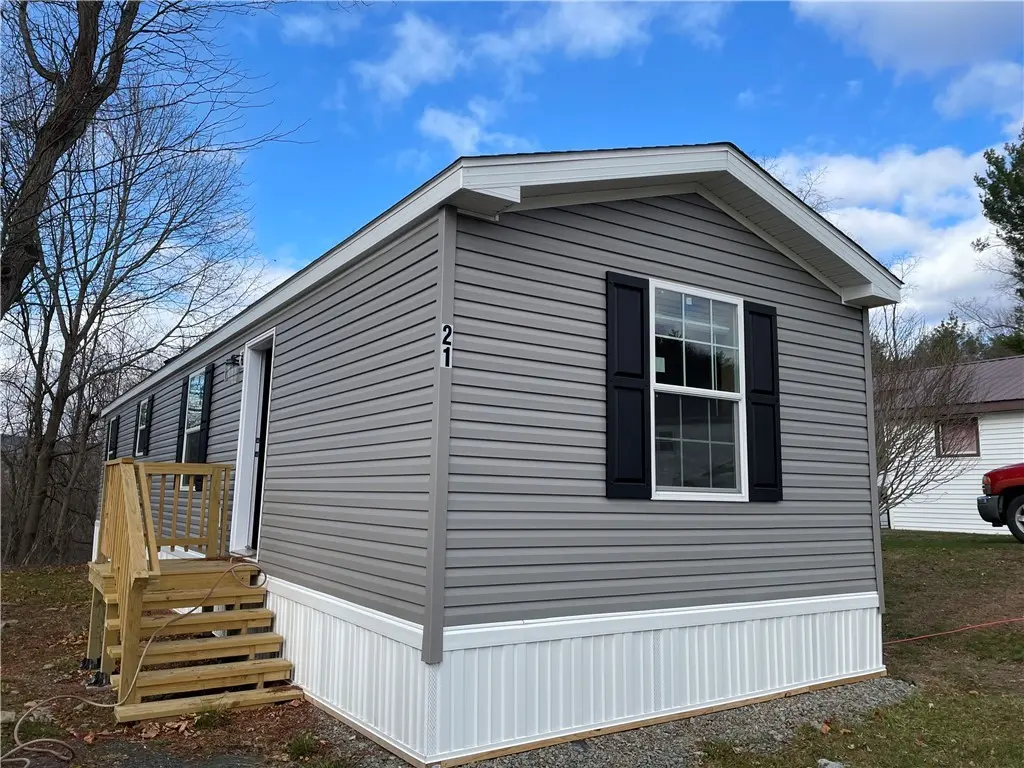
21 Locust Dr · Hornell, NY
Flood risk No data
- FEMA flood zone
- —
- Chance of flooding over 30 yrs
- —
- Est. flood insurance / yr
- —
Fire risk No data
- Est. fire insurance / yr
- —
Heat risk No data
- Hot days now (above threshold)
- —
- Hot days in 30 yrs
- —
Wind risk No data
- Chance of severe wind over 30 yrs
- —
Air-quality risk No data
- Unhealthy air days now
- —
- Unhealthy air days in 30 yrs
- —
Risk factors via First Street. Map © Google.
Why this score? — see what drove the B+ grade
The composite is a weighted blend of 9 inputs, each scored 0–100. Each bar is that input's sub-score; the figure is the points it added to the 100-point composite (weight × sub-score).
- Cash flow +30.0/30.0
- 1% rule +10.0/10.0
- DSCR +10.0/10.0
- ARV discount +7.5/15.0
- Appreciation +7.0/10.0
- Schools +4.4/10.0
- Condition / age +4.0/5.0
- Livability +3.5/5.0
- Rent growth +2.5/5.0
$54,000
🖨 Deal sheet 📄 Offer letter ✓ Due diligence
Listing remarks MLS
This new Eastland Concept 2-bedroom, 2 bath home features gorgeous finishes with an open concept kitchen and living area. The kitchen features whirlpool appliances (dishwasher included!), soft close kitchen drawers, and high-quality dovetail constructed cabinetry. The home includes perimeter heat, allowing a variety of furniture placement without blocking vents! Washer and dryer hook-ups are included in the laundry room/pantry off the kitchen. This new home comes with a one-year limited factory warranty from date of purchase, with additional warranties on appliances and other items. Built entirely in a factory before being delivered and set within the community, manufactured homes are built in compliance with strict federal building codes to ensure superior construction, energy efficiency, and quality. The controlled construction environment and assembly line techniques remove problems encountered during traditional on-site home construction. Much like other assembly line operations, manufactured homes benefit from the economies of scale resulting from purchasing large quantities of materials, and these savings are passed directly to the homebuyer.
Key facts
- Built 2026
- Listed 118 days
Neighborhood map
What this means for you Summary
Snapshot
- This is a 2-bed/2.0-bath manufactured listed at $54k. Condition is rated good.
Deal economics
- At list price, monthly cash flow is $568 ($7k/yr) — positive.
- The deal already cash-flows at list — no discount required.
- Meets the 1% rule at list price ($1k rent vs $54k).
- Recommended offer: $49k (9.0% below list) — sets the bar for market timing.
- Cap rate 18.9% vs local median 13.3% in Hornell — top-decile yield for the area; either an underpriced asset or a hidden risk that comps aren't pricing in. Stress-test before assuming the spread holds.
Location & tenants
- Location reads 70/100 on livability (#451 in NY) — a middle-class / working-renter tenant base. Strengths: cost of living A+, housing A+, health & safety A+; Watch: amenities C-, schools D, crime F.
- Canisteo-Greenwood CSD (rural): math 51% / reading 53% proficiency, ranked #354 of 590 in NY (top 60%) — acceptable for families but not a draw, mixed tenant base, ~2y average lease.
- Market conditions: 59 active listings in the ZIP; 196 units permitted in Steuben County in 2024 (0 in 5+ unit buildings).
Forward outlook
- In year one you build about $3k of equity ($373 loan paydown + $2k appreciation (4.0% local appreciation)).
- Steuben County population projected at -20% by 2050 — secular population decline; favor cash flow + early exit over multi-decade hold.
- At projected returns (4.0% appreciation + 3.0% rent growth), your $15k cash investment doubles in ~2 years — after that, you're playing with house money.
Negotiation context
- It's been on market 118 days — a 9% lower offer ($49k) is reasonable based on typical stale-listing flexibility.
Questions for the listing agent
- It's been on market 118 days. Have you received any prior offers? Is the seller open to a 9% concession, seller financing, or rate buy-down credit?
- Why hasn't it sold? Are there any deal-killer items the seller is aware of (foundation, flood, title, zoning, code violations)?
- Is there a deadline driving the sale (1031 exchange, divorce, estate, relocation)? That informs how much negotiation room exists.
- Schools are D-rated, which usually means shorter tenancies and higher turnover. Who's the typical renter profile here, and what's been the actual vacancy rate?
- Crime grade is F in this area — have there been break-ins, vandalism, or insurance claims at this property in the last 3 years? What carrier currently insures it and at what premium?
- What's the average days-on-market for RENTAL listings here right now (not sales)? A rising rental-DOM trend means longer vacancies and softer asking-rent achievability than the comps imply.
- What's the recent tenant-quality profile in this submarket — average credit score on applications, eviction rate, late-payment / NSF rate, and stable-employment percentage? A property-management company in the area should have these aggregated.
- How much new for-sale + rental construction is in the pipeline within 1–3 miles? Heavy new supply typically softens prices + rents 12–24 months out; constrained supply supports both.
Investment metrics
- 1% rule
- 2.21% ✓
- Cap rate
- 18.91%
- Cash-on-cash
- 45.07%
- DSCR
- 3.01
- GRM
- 3.8
CMA / ARV
- ARV (median comp)
- $995
- List price
- $54,000
- Delta
- 5327.14%
- Verdict
- OVERPRICED
- Comps
- 2 within 1.0 mi
Show comp detail 2 sales within ~0.75 mi
| Address | Dist | Beds/Ba | Sqft | Sold | Price | $/sf | Match |
|---|---|---|---|---|---|---|---|
| 18 Locust Dr | 0.02mi | 2/2.0 | 840 (+11%) | 2mo | $995 | $1 | 79 |
| 27 Locust Dr | 0.03mi | 2/2.0 | 864 (+14%) | 2mo | $995 | $1 | 74 |
Match score weights: distance 35% · size 25% · config 20% · recency 20%. Top-matched comps best support the ARV.
Projected returns pro-forma
3.95% appreciation · 3.0% rent growth · sell at horizon
- IRR
- 51.6%
- Equity multiple
- 4.01×
- Total profit
- $45,446
- Equity at exit
- $27,214
- IRR
- 50.4%
- Equity multiple
- 8.13×
- Total profit
- $107,859
- Equity at exit
- $44,380
Cash invested: $15,120 (down + closing). Projections, not guarantees.
Landlord ↔ Tenant lean methodology
- Overall (STATE)
- 15 Strongly Tenant-Friendly
- State New York
- 15 Strongly Tenant-Friendly · D+10
- County
- — inherits STATE
- City
- — inherits STATE
ZIP-level market 14843
- Home prices YoY
- 1.9%
- Active inventory
- 59
- Price-to-rent
- 3.8×
Monthly cashflow live
- Estimated rent
- $1,191 medium interval (Pro) →
- Mortgage (P&I)
- −$283
- Tax est. 1.5%
- −$68 /mo · $810/yr
- Insurance
- −$22
- HOA
- −$0
- Vacancy / Maint / Mgmt
- −$250
- Net cashflow
- $568
Break-even live
UW: 25.0% down · 7.5% · 30yr · 1.5% tax · 5.0% vac · 8.0% maint · 8.0% mgmt
Financing live
Cash to close
- Down payment
- $13,500
- Closing costs
- $1,620
- Reserves months
- —
- Total cash needed
- —
Loan-product check · same deal, 3 products live
Conventional
25% down · 7.5% · 30yr
- Down + closing
- —
- Monthly P&I
- —
- Monthly cashflow
- —
- DSCR
- —
- Eligible?
- —
Personal DTI + credit; lowest rate.
DSCR
20% down · 8.5% · 30yr
- Down + closing
- —
- Monthly P&I
- —
- Monthly cashflow
- —
- DSCR
- —
- Eligible?
- —
No personal income docs; deal must DSCR.
Hard money
10% down · 12.0% · 12mo
- Down + closing
- —
- Monthly P&I
- —
- Monthly cashflow
- —
- DSCR
- —
- Eligible?
- —
Short-term bridge; refi at stabilization.
Listing history 15 events
-
2026-06-17status $54,000 Pending 118 DOM
-
2026-06-16days on market $54,000 Active 118 DOM
-
2026-06-15days on market $54,000 Active 117 DOM
-
2026-06-14days on market $54,000 Active 115 DOM
-
2026-06-12days on market $54,000 Active 114 DOM
-
2026-06-09days on market $54,000 Active 111 DOM
-
2026-06-08days on market $54,000 Active 110 DOM
-
2026-06-07days on market $54,000 Active 109 DOM
-
2026-06-05days on market $54,000 Active 106 DOM
-
2026-06-03days on market $54,000 Active 105 DOM
-
2026-06-02days on market $54,000 Active 104 DOM
-
2026-06-01days on market $54,000 Active 103 DOM
-
2026-05-31days on market $54,000 Active 102 DOM
-
2026-05-30days on market $54,000 Active 101 DOM
-
2026-02-18$54,000 Active 1166-char remark
Show marketing remark (1166 chars)
This new Eastland Concept 2-bedroom, 2 bath home features gorgeous finishes with an open concept kitchen and living area. The kitchen features whirlpool appliances (dishwasher included!), soft close kitchen drawers, and high-quality dovetail constructed cabinetry. The home includes perimeter heat, allowing a variety of furniture placement without blocking vents! Washer and dryer hook-ups are included in the laundry room/pantry off the kitchen. This new home comes with a one-year limited factory warranty from date of purchase, with additional warranties on appliances and other items. Built entirely in a factory before being delivered and set within the community, manufactured homes are built in compliance with strict federal building codes to ensure superior construction, energy efficiency, and quality. The controlled construction environment and assembly line techniques remove problems encountered during traditional on-site home construction. Much like other assembly line operations, manufactured homes benefit from the economies of scale resulting from purchasing large quantities of materials, and these savings are passed directly to the homebuyer.
ⓘ Source: listings_history table (triggers on properties + properties_extension) + one-shot
backfill from property_details.listing_events for pre-trigger history.
Nearby sold comps map
Loading sold comps map…
Walkable amenities ~0.75 mi
Loading nearby amenities…
Taxation est. · year 1
- Rental income
- $14,294
- − Mortgage interest
- −$3,025
- − Property taxes
- −$810
- − Insurance
- −$270
- − Repairs & maintenance
- −$1,144
- − Management
- −$1,144
- − Depreciation
- −$1,571
- Taxable income
- $6,331
- Est. tax owed @ 24.0%
- −$1,519
- After-tax cash flow
- $5,295/yr
For passive investors: Depreciation is non-cash, so a rental often shows a tax loss while cash-flowing — sheltering income. Rental losses are passive: they offset passive income freely, and up to $25,000/yr can offset ordinary (W-2) income if you actively participate and your MAGI is under $100k (phasing out to $0 by $150k); unused losses carry forward. On sale, claimed depreciation is recaptured at up to 25%, and gains may owe capital-gains tax (a 1031 exchange can defer both). Figures are a year-1 estimate at your 24.0% rate — not tax advice; consult a CPA.
Condition & rehab AI · 1 photo
This manufactured home is in excellent condition with no visible repairs needed. It offers a good starting point for a cosmetic renovation to enhance its resale and rental value.
Value-add opportunities
- Both Landscaping — Enhances curb appeal and adds value
- Both Interior paint — Fresh paint can make the interior look new
- Both Kitchen appliances — Upgraded appliances can attract more buyers
Renovation cost estimate screening
Value-add ROI direction
- Both Landscaping — Enhances curb appeal and adds value ↑
- Both Interior paint — Fresh paint can make the interior look new ↑
- Both Kitchen appliances — Upgraded appliances can attract more buyers ↑
ⓘ Cost ranges are severity-bucket heuristics (US national rule-of-thumb). Get contractor quotes + a written scope before underwriting a rehab budget.
Schools (NCES district)
- District
- Canisteo-Greenwood CSD
- NCES district ID
- 3600124
- Math proficiency
- 51% ▼ -5.00%
- Reading proficiency
- 53% ▲ 7.00%
- Median HH income
- $47,928
- Composite
- 44.25/100
- National rank
- #2843
- State rank
- #354 of 590 in NY
Livability — Hornell
- Score
- 70/100
- State rank
- #451
- US rank
- #7888
Category grades
Schools grade is shown separately in the Schools card above.
Census & demographics
- County
- Steuben County · 41,193 people
- City population
- 12,383
- Metro
- Corning, NY
- Population (ZIP)
- 12,383
- Household income
- $57,874
- Rent vs Own
- Severe rent burden
- 415.0
Population outlook (Steuben County) Hauer SSP2
- Today (2025)
- 93,062 people
- By 2030
- 89,793 · -3.5%
- By 2040
- 82,353 · -11.5%
- By 2050
- 74,286 · -20.2%
- By 2075
- 55,589 · -40.3%
- By 2100
- 37,587 · -59.6%
Race, ethnicity, and origin ACS 2023
- Neighborhood character
- Predominantly White (92%)
- Race & ethnicity
- White 92% Two or more races 3% Hispanic / Latino 3% Black 2%
- Common ancestry
- Lithuanian 3% Romanian 2% Iranian 2%
- Foreign-born
- 4% · Canada
- Languages at home
- 95% English-only · French/Haitian/Cajun 2% Arabic 1% Spanish 1%
Political lean MEDSL · Steuben
- 2024 margin
- Solid R (+31.8) · D 34.1% · R 65.9%
- 2008→2024 swing
- -15.0pp toward R · 2008: -16.8pp · 2024: -31.8pp
- All cycles
- 2024: R+31.8 2020: R+29.6 2016: R+36.2 2012: R+16.4 2008: R+16.8
Not yet ingested
- Civics
- —
Market trends
- HPI YoY
- ▲ 3.95%
- Current HPI
- 210.1986
- Rent YoY
- —
- Metro
- Corning, NY
- State GDP YoY
- ▲ 2.60%
- F500 in state
- 92
Industry mix (Fortune 500 HQ in NY)
| Industry | F500 HQs | Revenue |
|---|---|---|
| Financial Services | 10 | $950B |
|
||
| Consumer Goods | 9 | $162B |
|
||
| Insurance | 4 | $225B |
|
||
| Telecommunications | 2 | $144B |
|
||
| Pharmaceuticals | 2 | $112B |
|
||
| Media / Entertainment | 2 | $69B |
|
||
Price history
1 event — show timeline
- 2026-02-18 Listed $54,000 UNYREIS
Cash-flow waterfall
monthlySold comps — $/sqft
last 12 mo · ≤1 miLoading sold comps…