 Multi-family
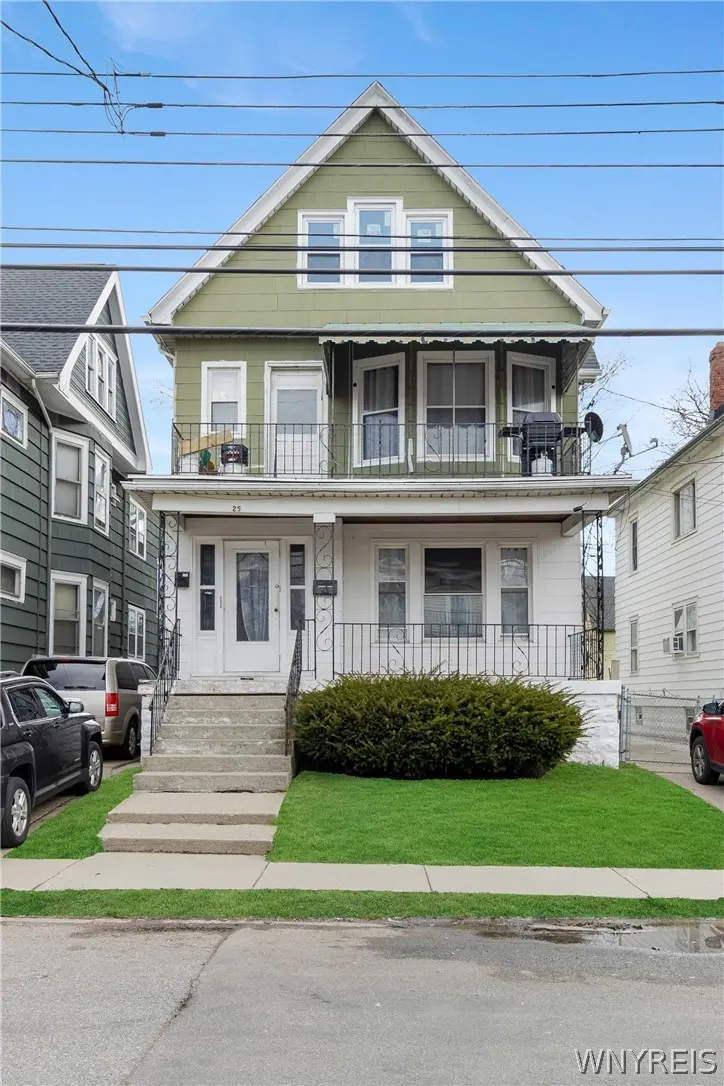
25 Page St · Buffalo, NY
Flood risk 1/10 · Minimal
- FEMA flood zone
- X (unshaded)
- Chance of flooding over 30 yrs
- 0.0%
- Est. flood insurance / yr
- $473 – $860
Fire risk 1/10 · Minimal
- Est. fire insurance / yr
- $691 – $1,283
Heat risk 3/10 · Minor
- Hot days now (above 92°F)
- 7 days/yr
- Hot days in 30 yrs
- 15 days/yr
Wind risk 1/10 · Minimal
- Chance of severe wind over 30 yrs
- —
Air-quality risk 4/10 · Minor
- Unhealthy air days now
- 4 days/yr
- Unhealthy air days in 30 yrs
- 9 days/yr
Risk factors via First Street. Map © Google.
Why this score? — see what drove the D+ grade
The composite is a weighted blend of 9 inputs, each scored 0–100. Each bar is that input's sub-score; the figure is the points it added to the 100-point composite (weight × sub-score).
- Cash flow +19.1/30.0
- DSCR +6.0/10.0
- 1% rule +5.1/10.0
- Rent growth +4.5/5.0
- Livability +3.9/5.0
- Condition / age +3.8/5.0
- Schools +3.3/10.0
- ARV discount +0.8/15.0
- Appreciation +0.0/10.0
$275,000
🖨 Deal sheet 📄 Offer letter ✓ Due diligence
Multi-family units
County records classify this as Multi-Family (2-4 Unit). Listing-text estimate: 1 unit. estimate disagrees with records
Listing remarks
Welcome to 25 Page Street in Buffalo! This well-maintained multi-family property is a fantastic investment opportunity or owner-occupant option. Each unit features 3 spacious bedrooms, making it highly desirable for tenants. Both units are currently rented on a month-to-month basis, offering flexibility for future plans. The property has seen numerous updates, including a new roof (2024) and updated heating system (2025), along with many additional improvements throughout—providing peace of mind for the next owner. Each unit offers comfortable living spaces with great natural light and functional layouts. The home also features a clean, dry basement, a full attic for additional storag
Key facts
- New roof
- Full attic
- Conveniently located
Tags
Property features AI
Finance
- Other: Lot is rectangular and near public transit; City street frontage; Lot dimensions approximately 35 x 104
- Financial info: Property configured as two separate units with separate gas and electric meters; Operating expenses include advertising, professional management, and water; Owner pays water; rent includes water; Reported rents: each unit currently rents for $1,300
Exterior
- Parking: Detached or attached garage with 2 garage spaces; Two or more off-street parking spaces
- Utilities: Public water connected; Sewer connected; Electric with circuit breakers
- Home design: 2-story multi-family building; Resale property
- Construction: Composite siding; Asphalt roof; Block foundation; Built (existing structure)
- Exterior features: Awning(s); Balcony; Covered porch; Porch
Interior
- Kitchen: Each unit includes oven/range and refrigerator; Formal dining room in each unit
- Bedrooms: Two separate 3-bedroom units (each with 3 bedrooms)
- Flooring: Hardwood; Tile; Varies by area
- Bathrooms: Each unit has 1 full bathroom (2 full bathrooms total)
- Heating & cooling: Gas forced-air heating
- Interior features: Ceiling fan(s)
- Laundry & utility: Gas water heater
Neighborhood map
What this means for you Summary
Snapshot
- This is a 6-bed/2.0-bath multifamily listed at $275k. Condition is rated good.
Deal economics
- At list price, monthly cash flow is $294 ($4k/yr) — positive.
- The deal already cash-flows at list — no discount required.
- Meets the 1% rule at list price ($3k rent vs $275k).
- Recommended offer: $267k (3.0% below list) — sets the bar for market timing.
Location & tenants
- Location reads 77/100 on livability (#195 in NY, #3,011 nationally) — a middle-class / working-renter tenant base. Strengths: commute A+, housing A+, health & safety A+; Watch: crime F, employment D-.
- Buffalo City School District (urban): math 41% / reading 40% proficiency, ranked #535 of 590 in NY (top 91%) — families likely to look elsewhere, expect single-tenant / working-renter base with shorter leases; 75% free/reduced lunch — lower-income household profile, screen leases tightly.
- Market conditions: Rents rising fast (+8.2%/yr); 197 active listings in the ZIP; lower-income renter base — watch delinquency; 1,244 units permitted in Erie County in 2024 (563 in 5+ unit buildings).
- At $2,778/mo this rent would consume 84% of the median local household income ($40k/yr) (locally 2177% of renters already pay >50% of income on rent) — very limited rent-growth headroom before tenants either downsize or default.
Forward outlook
- Local home prices are declining (-3.0%/yr); year-one equity from $2k of loan paydown is wiped out by about $8k of value loss. Plan a longer hold.
- At projected returns (-3.0% appreciation + 8.0% rent growth), your $77k cash investment doubles in ~10 years — after that, you're playing with house money.
Negotiation context
- It's been on market 53 days — a 3% lower offer ($267k) is reasonable based on typical stale-listing flexibility.
Risks & watch-outs
- Watch-outs: built in 1920 — expect roof / HVAC / electrical / plumbing capex.
Questions for the listing agent
- It's been on market 53 days. Have you received any prior offers? Is the seller open to a 3% concession, seller financing, or rate buy-down credit?
- Built in 1920 — when were the roof, HVAC, electrical panel, plumbing, and water heater last replaced?
- Is there a deadline driving the sale (1031 exchange, divorce, estate, relocation)? That informs how much negotiation room exists.
- Crime grade is F in this area — have there been break-ins, vandalism, or insurance claims at this property in the last 3 years? What carrier currently insures it and at what premium?
- The area grade is low — what's the realistic commute time and amenity access for the typical tenant pool here? Any planned neighborhood developments (good or bad) we should know about?
- What's the average days-on-market for RENTAL listings here right now (not sales)? A rising rental-DOM trend means longer vacancies and softer asking-rent achievability than the comps imply.
- What's the recent tenant-quality profile in this submarket — average credit score on applications, eviction rate, late-payment / NSF rate, and stable-employment percentage? A property-management company in the area should have these aggregated.
- How much new apartment / multifamily construction is in the pipeline within 1–3 miles? Heavy new supply (>2% of stock underway) typically softens rents 12–24 months out; light construction supports rent growth.
Investment metrics
- 1% rule
- 1.01% ✓
- Cap rate
- 7.58%
- Cash-on-cash
- 4.58%
- DSCR
- 1.20
- GRM
- 8.2
CMA / ARV
- ARV (on-the-fly)
- $239,200
- Comps found
- 12
Show comp detail 12 sales within ~0.75 mi
| Address | Dist | Beds/Ba | Sqft | Sold | Price | $/sf | Match |
|---|---|---|---|---|---|---|---|
| 43 Sunset St | 0.08mi | 6/2.0 | 2,271 (-5%) | 1mo | $165,000 | $73 | 87 |
| 75 Saint Florian St | 0.13mi | 6/2.0 | 2,338 (-2%) | 10mo | $160,000 | $68 | 82 |
| 41 Page St | 0.04mi | 5/2.0 (-1) | 2,274 (-5%) | 4mo | $230,000 | $101 | 82 |
| 80 Gladstone St | 0.38mi | 6/2.0 | 2,420 (+1%) | 11mo | $180,000 | $74 | 71 |
| 263 Chandler St | 0.37mi | 5/2.0 (-1) | 2,254 (-6%) | 2mo | $195,000 | $87 | 66 |
| 202 Grote St | 0.38mi | 6/2.0 | 2,200 (-8%) | 5mo | $219,750 | $100 | 64 |
| 94 Germain St | 0.61mi | 6/2.0 | 2,142 (-10%) | 10mo | $110,000 | $51 | 46 |
| 44 Tacoma Ave | 0.75mi | 6/2.0 | 2,522 (+5%) | 13mo | $353,000 | $140 | 45 |
| 314 Bedford Ave | 0.74mi | 6/2.0 | 2,710 (+13%) | 2mo | $387,500 | $143 | 42 |
| 81 Elmhurst Pl | 0.69mi | 5/2.0 (-1) | 2,156 (-10%) | 10mo | $250,000 | $116 | 38 |
| 151 Howell St | 0.45mi | 5/3.0 (-1) | 2,048 (-14%) | 13mo | $120,000 | $59 | 35 |
| 1540 Elmwood Ave | 0.72mi | 6/2.0 | 2,712 (+13%) | 13mo | $350,000 | $129 | 34 |
Match score weights: distance 35% · size 25% · config 20% · recency 20%. Top-matched comps best support the ARV.
Projected returns pro-forma
-3.0% appreciation · 8.0% rent growth · sell at horizon
- IRR
- -3.7%
- Equity multiple
- 0.86×
- Total profit
- $-11,104
- Equity at exit
- $41,003
- IRR
- 11.0%
- Equity multiple
- 2.06×
- Total profit
- $81,445
- Equity at exit
- $23,777
Cash invested: $77,000 (down + closing). Projections, not guarantees.
Landlord ↔ Tenant lean methodology
- Overall (STATE)
- 15 Strongly Tenant-Friendly
- State New York
- 15 Strongly Tenant-Friendly · D+10
- County
- — inherits STATE
- City
- — inherits STATE
ZIP-level market 14207
- Home prices YoY
- -18.9%
- Rents YoY
- 8.2%
- Active inventory
- 197
- Price-to-rent
- 16.5×
Monthly cashflow live
- Estimated rent
- $2,778 high interval (Pro) →
- Mortgage (P&I)
- −$1,442
- Tax est. 1.5%
- −$344 /mo · $4,125/yr
- Insurance
- −$115
- HOA
- −$0
- Vacancy / Maint / Mgmt
- −$583
- Net cashflow
- $294
Break-even live
2-unit breakdown (identical units grouped — click to expand)
| Units | Beds | Baths | Est. rent |
|---|---|---|---|
| 2× units | 3 | 1.5 | $2,778 |
| #1 | 3 | 1.5 | $1,389 |
| #2 | 3 | 1.5 | $1,389 |
| Total (2 units) | $2,778 | ||
UW: 25.0% down · 7.5% · 30yr · 1.5% tax · 5.0% vac · 8.0% maint · 8.0% mgmt
Financing live
Cash to close
- Down payment
- $68,750
- Closing costs
- $8,250
- Reserves months
- —
- Total cash needed
- —
Loan-product check · same deal, 3 products live
Conventional
25% down · 7.5% · 30yr
- Down + closing
- —
- Monthly P&I
- —
- Monthly cashflow
- —
- DSCR
- —
- Eligible?
- —
Personal DTI + credit; lowest rate.
DSCR
20% down · 8.5% · 30yr
- Down + closing
- —
- Monthly P&I
- —
- Monthly cashflow
- —
- DSCR
- —
- Eligible?
- —
No personal income docs; deal must DSCR.
Hard money
10% down · 12.0% · 12mo
- Down + closing
- —
- Monthly P&I
- —
- Monthly cashflow
- —
- DSCR
- —
- Eligible?
- —
Short-term bridge; refi at stabilization.
Listing history 6 events
-
2026-06-18days on market $275,000 Active 53 DOM
-
2026-06-17days on market $275,000 Active 52 DOM
-
2026-06-16days on market $275,000 Active 51 DOM
-
2026-06-15statusdays on market $275,000 Active 50 DOM
-
2026-05-21status Pending
-
2026-04-01$275,000 Active
ⓘ Source: listings_history table (triggers on properties + properties_extension) + one-shot
backfill from property_details.listing_events for pre-trigger history.
Climate risk First Street
- Flood 1/10 Low FEMA zone X (unshaded) · 0% chance over 30 yrs
- Wildfire 1/10 Low
- Heat 3/10 Moderate 7 d/yr ≥92°F today · 15 d/yr by 30 yrs out
- Wind 1/10 Low
- Air quality 4/10 Moderate 4 unhealthy d/yr today · 9 by 30 yrs out
Nearby sold comps map
Loading sold comps map…
Walkable amenities ~0.75 mi
Loading nearby amenities…
Taxation est. · year 1
- Rental income
- $33,336
- − Mortgage interest
- −$15,404
- − Property taxes
- −$4,125
- − Insurance
- −$1,375
- − Repairs & maintenance
- −$2,667
- − Management
- −$2,667
- − Depreciation
- −$8,000
- Taxable loss
- −$902
- Est. tax savings @ 24.0%
- +$216
- After-tax cash flow
- $3,746/yr
For passive investors: Depreciation is non-cash, so a rental often shows a tax loss while cash-flowing — sheltering income. Rental losses are passive: they offset passive income freely, and up to $25,000/yr can offset ordinary (W-2) income if you actively participate and your MAGI is under $100k (phasing out to $0 by $150k); unused losses carry forward. On sale, claimed depreciation is recaptured at up to 25%, and gains may owe capital-gains tax (a 1031 exchange can defer both). Figures are a year-1 estimate at your 24.0% rate — not tax advice; consult a CPA.
Condition & rehab AI · 13 photos
This multi-family property is in good condition with minor repairs needed in the kitchen and bathrooms. It offers a good investment opportunity with potential for significant value increases through updates.
Repairs flagged
- Minor Kitchen countertops — Worn appearance suggests minor repairs or replacement needed.
- Minor Bathroom tile — Signs of age suggest minor repairs or replacement needed.
Value-add opportunities
- Resale Kitchen renovation — A fresh kitchen can significantly increase the home's appeal to potential buyers.
- Rental Bathroom updates — Modern bathrooms can attract tenants and increase rental value.
Renovation cost estimate screening
| Repair item | Severity | Est. cost |
|---|---|---|
| Kitchen countertops · Worn appearance suggests minor repairs or replacement needed. | Minor | $500–3,000 |
| Bathroom tile · Signs of age suggest minor repairs or replacement needed. | Minor | $500–3,000 |
| Total estimated repair cost · 2 items | $1,000–6,000 |
Value-add ROI direction
- Resale Kitchen renovation — A fresh kitchen can significantly increase the home's appeal to potential buyers. ↑
- Rental Bathroom updates — Modern bathrooms can attract tenants and increase rental value. ↑
ⓘ Cost ranges are severity-bucket heuristics (US national rule-of-thumb). Get contractor quotes + a written scope before underwriting a rehab budget.
Schools (NCES district)
- District
- Buffalo City School District
- NCES district ID
- 3605850
- Math proficiency
- 41% ▲ 11.00%
- Reading proficiency
- 40% ▲ 7.00%
- Median HH income
- $31,665
- Composite
- 33.17/100
- National rank
- #5544
- State rank
- #535 of 590 in NY
Livability — Buffalo
- Score
- 77/100
- State rank
- #195
- US rank
- #3011
Category grades
Schools grade is shown separately in the Schools card above.
Census & demographics
- Census place
- Buffalo, NY
- County
- Erie County · 714,559 people
- City population
- 440,021
- Metro
- Buffalo-Cheektowaga, NY
- Population (ZIP)
- 26,327
- Household income
- $39,753
- Rent vs Own
- Severe rent burden
- 2177.0
Population outlook (Erie County) Hauer SSP2
- Today (2025)
- 933,037 people
- By 2030
- 935,181 · +0.2%
- By 2040
- 928,531 · -0.5%
- By 2050
- 905,725 · -2.9%
- By 2075
- 834,037 · -10.6%
- By 2100
- 708,033 · -24.1%
Race, ethnicity, and origin ACS 2023
- Neighborhood character
- Highly diverse neighborhood (Simpson 0.74)
- Race & ethnicity
- White 40% Hispanic / Latino 23% Black 16% Asian 15% Two or more races 14%
- Hispanic origin (detail)
- Puerto Rican 18% Dominican 2%
- Common ancestry
- Romanian 8% Portuguese 1% Arab 1%
- Foreign-born
- 19% · Philippines, Canada, India
- Languages at home
- 65% English-only · Spanish 14% Other Asian/Pacific 10% Other Indo-European 5%
Political lean MEDSL · Erie
- 2024 margin
- Lean D (+9.7) · D 54.8% · R 45.2%
- 2008→2024 swing
- -7.9pp toward R · 2008: 17.5pp · 2024: 9.7pp
- All cycles
- 2024: D+9.7 2020: D+14.7 2016: D+4.8 2012: D+15.6 2008: D+17.5
Not yet ingested
- Civics
- —
Market trends
- HPI YoY
- ▼ -54.42%
- Current HPI
- 233.0902
- Rent YoY
- ▲ 8.19%
- Metro
- Buffalo-Cheektowaga, NY
- State GDP YoY
- ▲ 2.60%
- F500 in state
- 92
Industry mix (Fortune 500 HQ in NY)
| Industry | F500 HQs | Revenue |
|---|---|---|
| Financial Services | 10 | $950B |
|
||
| Consumer Goods | 9 | $162B |
|
||
| Insurance | 4 | $225B |
|
||
| Telecommunications | 2 | $144B |
|
||
| Pharmaceuticals | 2 | $112B |
|
||
| Media / Entertainment | 2 | $69B |
|
||
Price history
2 events — show timeline
- 2026-05-21 Pending — WNYREIS
- 2026-04-01 Listed $275,000 WNYREIS
Cash-flow waterfall
monthlySold comps — $/sqft
last 12 mo · ≤1 miLoading sold comps…