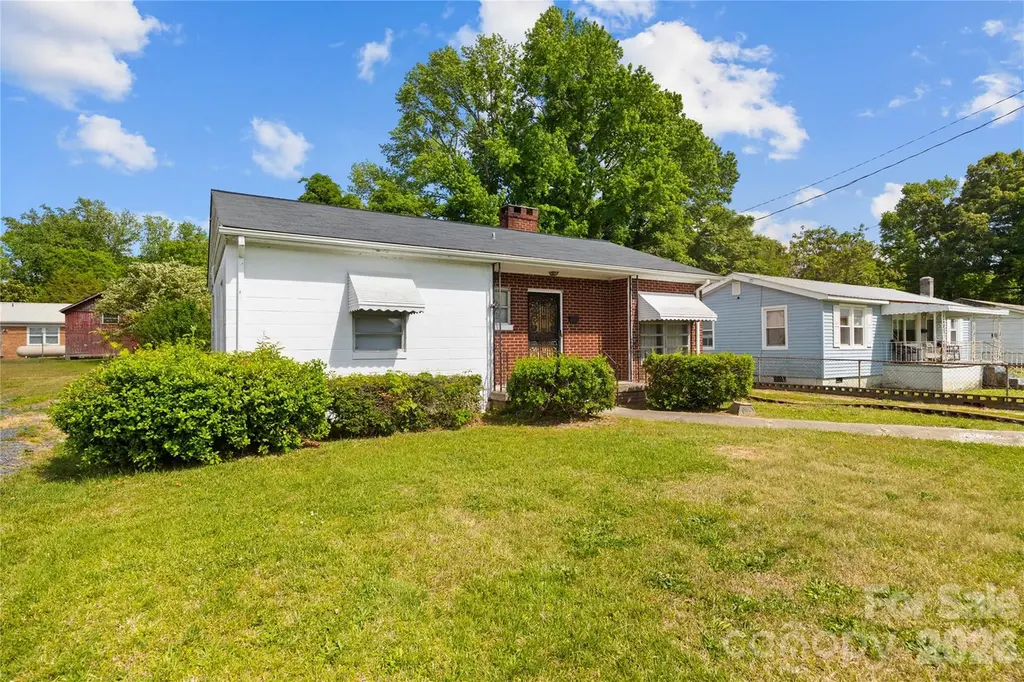
419 S Pearl St · Troy, NC
Flood risk 1/10 · Minimal
- FEMA flood zone
- X (unshaded)
- Chance of flooding over 30 yrs
- 0.0%
- Est. flood insurance / yr
- $507 – $1,088
Fire risk 3/10 · Minor
- Est. fire insurance / yr
- $906 – $1,684
Heat risk 6/10 · Moderate
- Hot days now (above 107°F)
- 7 days/yr
- Hot days in 30 yrs
- 16 days/yr
Wind risk 6/10 · Moderate
- Chance of severe wind over 30 yrs
- 27.0%
Air-quality risk 2/10 · Minimal
- Unhealthy air days now
- 0 days/yr
- Unhealthy air days in 30 yrs
- 1 days/yr
Risk factors via First Street. Map © Google.
Why this score? — see what drove the B- grade
The composite is a weighted blend of 9 inputs, each scored 0–100. Each bar is that input's sub-score; the figure is the points it added to the 100-point composite (weight × sub-score).
- Cash flow +21.5/30.0
- ARV discount +15.0/15.0
- Appreciation +10.0/10.0
- DSCR +6.9/10.0
- 1% rule +4.3/10.0
- Livability +3.4/5.0
- Schools +2.6/10.0
- Rent growth +2.5/5.0
- Condition / age +2.5/5.0
$149,900
🖨 Deal sheet 📄 Offer letter ✓ Due diligence
Listing remarks
This charming 1959 ranch-style home offers a nostalgic blend of mid-century character and functional living space in the heart of Troy. The exterior features classic accented red brick and vintage awnings, creating an inviting first impression. Inside, the home boasts a versatile layout including both a formal living room and a cozy family room or den, highlighted by warm wood-paneled walls, a brick accent wall, and a traditional wood-burning stove—perfect for creating a snug atmosphere during cooler months. The kitchen is a retro enthusiast's dream, showcasing original knotty pine cabinetry with unique decorative hardware, ample counter space, and integrated appliances that maintain
Key facts
- Vintage awnings
- Cozy family room
- Formal living room
Tags
Property features AI
Finance
- HOA & community: No HOA
Exterior
- Parking: Attached garage with exterior-only entry (good for storage or shop); Driveway parking; 2 open parking spaces
- Utilities: City water; Public sewer
- Home design: Single-family residence; One level; City zoning
- Construction: Site-built construction; Partial brick and block exterior; Crawl space and slab foundation; Shingle roof
- Exterior features: Covered front porch; Patio
Interior
- Kitchen: Dishwasher; Electric cooktop; Wall oven
- Bedrooms: 3 bedrooms on the main level
- Flooring: Vinyl flooring; Wood flooring
- Bathrooms: 1 full bath; 1 half bath
- Heating & cooling: Central heating (electric); Central air conditioning
- Interior features: 5 total rooms; Living room fireplace; Bath grab bars (accessibility)
- Laundry & utility: Dedicated laundry room
Neighborhood map
What this means for you Summary
Snapshot
- This is a 2-bed/1.0-bath single-family listed at $150k.
Deal economics
- At list price, monthly cash flow is $225 ($3k/yr) — positive.
- The deal already cash-flows at list — no discount required.
- To meet the 1% rule (rent ≥ 1% of price), the offer needs to be $140k (6.6% below list).
- Recommended offer: $140k (6.6% below list) — sets the bar for 1% rule.
Location & tenants
- Location reads 68/100 on livability (#181 in NC) — a middle-class / working-renter tenant base. Strengths: cost of living A+, housing A+, health & safety A+; Watch: schools D-, amenities F, commute F.
- Montgomery County Schools (rural): math 29% / reading 34% proficiency, ranked #143 of 178 in NC (top 80%) — families likely to look elsewhere, expect single-tenant / working-renter base with shorter leases; 66% free/reduced lunch — lower-income household profile, screen leases tightly.
- Market conditions: 48 active listings in the ZIP; 1 comparable units currently listed for rent nearby; 138 units permitted in Montgomery County in 2024 (0 in 5+ unit buildings).
Forward outlook
- In year one you build about $16k of equity ($1k loan paydown + $15k appreciation (10.0% local appreciation)).
- Montgomery County population projected at -17% by 2050 — secular population decline; favor cash flow + early exit over multi-decade hold.
- At projected returns (10.0% appreciation + 3.0% rent growth), your $42k cash investment doubles in ~3 years — after that, you're playing with house money.
- By year 3, paydown + projected appreciation supports a ~$41k cash-out refi (75% LTV) — recoverable capital for the next deal without selling this one.
Negotiation context
- It's been on market 48 days — a 3% lower offer ($145k) is reasonable based on typical stale-listing flexibility.
- 2 sale attempts with the ask held roughly flat each time — persistent listings suggest the price (not the market) is what's stuck; bring a comps-based counter.
Risks & watch-outs
- Watch-outs: built in 1959 — expect roof / HVAC / electrical / plumbing capex.
- Climate carrying-cost: major wind risk, 27% chance of damaging wind over 30y; extreme-heat days projected 7→16/yr by 2055 (HVAC capex compounding) — expect insurance premiums to compound above CPI over the hold.
Questions for the listing agent
- It's been on market 48 days. Have you received any prior offers? Is the seller open to a 7% concession, seller financing, or rate buy-down credit?
- Built in 1959 — when were the roof, HVAC, electrical panel, plumbing, and water heater last replaced?
- Is there a deadline driving the sale (1031 exchange, divorce, estate, relocation)? That informs how much negotiation room exists.
- Schools are D-rated, which usually means shorter tenancies and higher turnover. Who's the typical renter profile here, and what's been the actual vacancy rate?
- What's the average days-on-market for RENTAL listings here right now (not sales)? A rising rental-DOM trend means longer vacancies and softer asking-rent achievability than the comps imply.
- What's the recent tenant-quality profile in this submarket — average credit score on applications, eviction rate, late-payment / NSF rate, and stable-employment percentage? A property-management company in the area should have these aggregated.
- How much new for-sale + rental construction is in the pipeline within 1–3 miles? Heavy new supply typically softens prices + rents 12–24 months out; constrained supply supports both.
Investment metrics
- 1% rule
- 0.93% ✗
- Cap rate
- 8.09%
- Cash-on-cash
- 6.42%
- DSCR
- 1.29
- GRM
- 8.9
CMA / ARV
- ARV (on-the-fly)
- $202,520
- Comps found
- 7
Show comp detail 7 sales within ~0.75 mi
| Address | Dist | Beds/Ba | Sqft | Sold | Price | $/sf | Match |
|---|---|---|---|---|---|---|---|
| 720 S Main St | 0.24mi | 2/1.0 | 1,192 (-2%) | 20mo | $170,000 | $143 | 69 |
| 415 W Main St | 0.40mi | 2/1.0 | 1,123 (-8%) | 10mo | $30,000 | $27 | 60 |
| 502 Perry St | 0.36mi | 3/1.5 (+1) | 1,165 (-4%) | 16mo | $190,000 | $163 | 56 |
| 211 W Roswell St | 0.70mi | 3/2.0 (+1) | 1,196 (-2%) | 13mo | $199,000 | $166 | 44 |
| 306 W Roswell St | 0.75mi | 3/2.0 (+1) | 1,102 (-10%) | 3mo | $192,000 | $174 | 38 |
| 522 Perry St | 0.45mi | 3/2.0 (+1) | 1,043 (-14%) | 12mo | $178,500 | $171 | 36 |
| 205 W Roswell St | 0.69mi | 3/2.0 (+1) | 1,067 (-12%) | 6mo | $225,000 | $211 | 33 |
Match score weights: distance 35% · size 25% · config 20% · recency 20%. Top-matched comps best support the ARV.
Projected returns pro-forma
10.0% appreciation · 3.0% rent growth · sell at horizon
- IRR
- 28.9%
- Equity multiple
- 3.28×
- Total profit
- $95,877
- Equity at exit
- $135,042
- IRR
- 25.1%
- Equity multiple
- 7.46×
- Total profit
- $270,940
- Equity at exit
- $291,223
Cash invested: $41,972 (down + closing). Projections, not guarantees.
Landlord ↔ Tenant lean methodology
- Overall (STATE)
- 85 Strongly Landlord-Friendly
- State North Carolina
- 85 Strongly Landlord-Friendly · R+3
- County
- — inherits STATE
- City
- — inherits STATE
ZIP-level market 27371
- Home prices YoY
- 13.6%
- Active inventory
- 48
- Price-to-rent
- 8.9×
Monthly cashflow live
- Estimated rent
- $1,400 medium interval (Pro) →
- Mortgage (P&I)
- −$786
- Tax from tax record
- −$33 /mo · $393/yr
- Insurance
- −$62
- HOA
- −$0
- Vacancy / Maint / Mgmt
- −$294
- Net cashflow
- $225
Break-even live
UW: 25.0% down · 7.5% · 30yr · 1.5% tax · 5.0% vac · 8.0% maint · 8.0% mgmt
Financing live
Cash to close
- Down payment
- $37,475
- Closing costs
- $4,497
- Reserves months
- —
- Total cash needed
- —
Loan-product check · same deal, 3 products live
Conventional
25% down · 7.5% · 30yr
- Down + closing
- —
- Monthly P&I
- —
- Monthly cashflow
- —
- DSCR
- —
- Eligible?
- —
Personal DTI + credit; lowest rate.
DSCR
20% down · 8.5% · 30yr
- Down + closing
- —
- Monthly P&I
- —
- Monthly cashflow
- —
- DSCR
- —
- Eligible?
- —
No personal income docs; deal must DSCR.
Hard money
10% down · 12.0% · 12mo
- Down + closing
- —
- Monthly P&I
- —
- Monthly cashflow
- —
- DSCR
- —
- Eligible?
- —
Short-term bridge; refi at stabilization.
Rent comps 1 comps
| Address | Beds | Baths | Sqft | Rent | $/sqft | DOM | Units | Dist |
|---|---|---|---|---|---|---|---|---|
| 720 S Main St Troy, NC | 2.0 | 1.0 | 1192 | $1,400 | $1.17 | 23d | 1 | 0.25mi |
Listing history 19 events
-
2026-06-18days on market $149,900 Active 48 DOM
-
2026-06-17days on market $149,900 Active 47 DOM
-
2026-06-16days on market $149,900 Active 46 DOM
-
2026-06-15days on market $149,900 Active 45 DOM
-
2026-06-14days on market $149,900 Active 43 DOM
-
2026-06-13days on market $149,900 Active 42 DOM
-
2026-06-10days on market $149,900 Active 40 DOM
-
2026-06-09days on market $149,900 Active 39 DOM
-
2026-06-08days on market $149,900 Active 38 DOM
-
2026-06-07days on market $149,900 Active 37 DOM
-
2026-06-05days on market $149,900 Active 34 DOM
-
2026-06-03days on market $149,900 Active 33 DOM
-
2026-06-02days on market $149,900 Active 32 DOM
-
2026-06-01days on market $149,900 Active 31 DOM
-
2026-05-31days on market $149,900 Active 30 DOM
-
2026-05-31days on market $149,900 Active 29 DOM
-
2026-05-01$149,900 Active
-
2025-11-07price $155,000
-
2025-09-17$163,900 Active
ⓘ Source: listings_history table (triggers on properties + properties_extension) + one-shot
backfill from property_details.listing_events for pre-trigger history.
Tax reassessment forecast NC · Resets to sale price
- Current annual tax
- $393 · $33/mo
- Projected year-2 tax
- $1,229 · $102/mo
- Expected delta
- +$836/yr (+$70/mo · 212.7%)
ⓘ Screening estimate from a state-policy table — verify with the county assessor before closing.
Climate risk First Street
- Flood 1/10 Low FEMA zone X (unshaded) · 0% chance over 30 yrs
- Wildfire 3/10 Moderate
- Heat 6/10 Major 7 d/yr ≥107°F today · 16 d/yr by 30 yrs out
- Wind 6/10 Major 27% chance of damaging wind over 30 yrs
- Air quality 2/10 Low 0 unhealthy d/yr today · 1 by 30 yrs out
Nearby sold comps map
Loading sold comps map…
Walkable amenities ~0.75 mi
Loading nearby amenities…
Taxation est. · year 1
- Rental income
- $16,800
- − Mortgage interest
- −$8,397
- − Property taxes
- −$393
- − Insurance
- −$750
- − Repairs & maintenance
- −$1,344
- − Management
- −$1,344
- − Depreciation
- −$4,361
- Taxable income
- $212
- Est. tax owed @ 24.0%
- −$51
- After-tax cash flow
- $2,645/yr
For passive investors: Depreciation is non-cash, so a rental often shows a tax loss while cash-flowing — sheltering income. Rental losses are passive: they offset passive income freely, and up to $25,000/yr can offset ordinary (W-2) income if you actively participate and your MAGI is under $100k (phasing out to $0 by $150k); unused losses carry forward. On sale, claimed depreciation is recaptured at up to 25%, and gains may owe capital-gains tax (a 1031 exchange can defer both). Figures are a year-1 estimate at your 24.0% rate — not tax advice; consult a CPA.
Schools (NCES district)
- District
- Montgomery County Schools
- NCES district ID
- 3703060
- Math proficiency
- 29% ▼ -6.00%
- Reading proficiency
- 34% ▼ -2.00%
- Median HH income
- $34,706
- Composite
- 25.97/100
- National rank
- #7328
- State rank
- #143 of 178 in NC
Livability — Troy
- Score
- 68/100
- State rank
- #181
- US rank
- #9235
Category grades
Schools grade is shown separately in the Schools card above.
Census & demographics
- Census place
- Troy, NC
- Population (ZIP)
- 7,842
Population outlook (Montgomery County) Hauer SSP2
- Today (2025)
- 26,533 people
- By 2030
- 25,724 · -3.0%
- By 2040
- 23,842 · -10.1%
- By 2050
- 22,077 · -16.8%
- By 2075
- 18,754 · -29.3%
- By 2100
- 15,537 · -41.4%
Race, ethnicity, and origin ACS 2023
- Neighborhood character
- Predominantly White (76%)
- Race & ethnicity
- White 76% Black 14% Hispanic / Latino 7% Two or more races 5%
- Hispanic origin (detail)
- Mexican 4%
- Common ancestry
- Serbian 2% Italian 2% Slovak 2%
- Foreign-born
- 5% · Canada
- Languages at home
- 90% English-only · Spanish 7% French/Haitian/Cajun 1% Chinese 1%
Political lean MEDSL · Montgomery
- 2024 margin
- Solid R (+37.8) · D 30.8% · R 68.6%
- 2008→2024 swing
- -26.9pp toward R · 2008: -11.0pp · 2024: -37.8pp
- All cycles
- 2024: R+37.8 2020: R+31.8 2016: R+25.9 2012: R+15.2 2008: R+11.0
Not yet ingested
- Civics
- —
Market trends
- HPI YoY
- ▲ 39.24%
- Current HPI
- 328.2084
- Rent YoY
- —
- Metro
- —
- State GDP YoY
- ▲ 3.28%
- F500 in state
- 26
Industry mix (Fortune 500 HQ in NC)
| Industry | F500 HQs | Revenue |
|---|---|---|
| Financial Services | 2 | $213B |
|
||
| Retail | 2 | $95B |
|
||
| Industrial Conglomerate | 1 | $38B |
|
||
| Metals / Steel | 1 | $35B |
|
||
| Utilities | 1 | $30B |
|
||
| Industrial Machinery | 1 | $19B |
|
||
Price history
-8.5% since first listed3 events — show timeline
- 2026-05-01 Listed $149,900 CANOPYMLS as Distributed by MLS Grid
- 2025-11-07 Price Changed $155,000 CANOPYMLS as Distributed by MLS Grid
- 2025-09-17 Listed $163,900 CANOPYMLS as Distributed by MLS Grid
Property tax history
+0.7%/yrLatest (2024): $393 · +0.0% YoY. Source: county tax records.
Cash-flow waterfall
monthlySold comps — $/sqft
last 12 mo · ≤1 miLoading sold comps…