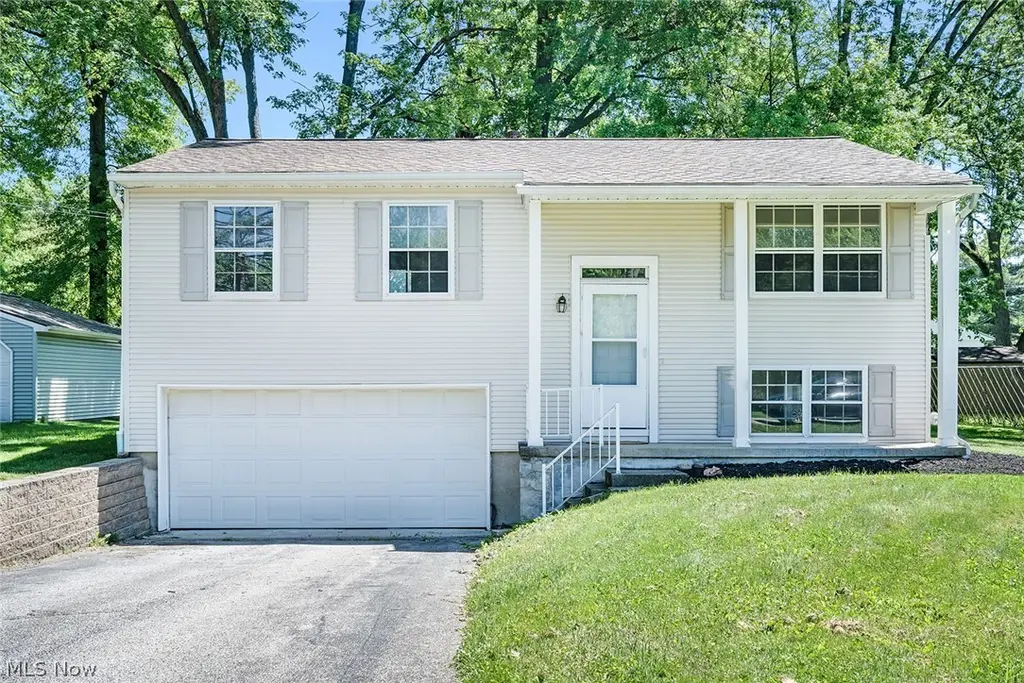
3765 Boston Ave SE · Bolindale, OH
Flood risk 1/10 · Minimal
- FEMA flood zone
- X (unshaded)
- Chance of flooding over 30 yrs
- 0.0%
- Est. flood insurance / yr
- $507 – $1,088
Fire risk 1/10 · Minimal
- Est. fire insurance / yr
- $713 – $1,323
Heat risk 3/10 · Minor
- Hot days now (above 98°F)
- 7 days/yr
- Hot days in 30 yrs
- 17 days/yr
Wind risk 1/10 · Minimal
- Chance of severe wind over 30 yrs
- —
Air-quality risk 3/10 · Minor
- Unhealthy air days now
- 1 days/yr
- Unhealthy air days in 30 yrs
- 4 days/yr
Risk factors via First Street. Map © Google.
Why this score? — see what drove the D+ grade
The composite is a weighted blend of 9 inputs, each scored 0–100. Each bar is that input's sub-score; the figure is the points it added to the 100-point composite (weight × sub-score).
- Cash flow +14.4/30.0
- ARV discount +10.1/15.0
- Schools +5.3/10.0
- DSCR +4.4/10.0
- Livability +3.6/5.0
- 1% rule +3.3/10.0
- Rent growth +2.5/5.0
- Condition / age +2.5/5.0
- Appreciation +0.0/10.0
$179,500
🖨 Deal sheet (PDF) 📄 Offer letter ✓ Due diligence
Listing remarks
Welcome to 3765 Boston Ave, where modern updates and timeless charm come together to create a home you'll love from the moment you walk through the door. This beautifully renovated 3-bedroom, 1-bath home has been thoughtfully updated throughout, offering a truly move-in-ready experience. Step inside to discover freshly painted interiors complemented by beautifully refinished hardwood floors stained in a rich dark oak finish, creating a warm and inviting atmosphere. The updated kitchen is sure to impress with its fresh flooring, new countertops, and stylish backsplash, providing both functionality and contemporary appeal. The fully remodeled bathroom showcases quality finishes and a clean, m
Key facts
- Modern updates
- Stylish backsplash
- Updated kitchen
Tags
Property features AI
Finance
- Financial info: Annual taxes reported (2025)
Exterior
- Parking: Attached garage (1 car)
- Utilities: Public water; Public sewer
- Home design: 2-story home; Vinyl siding; Asphalt/fiberglass roof
- Construction: Vinyl siding construction; Asphalt/fiberglass roof
- Exterior features: Deck
Interior
- Kitchen: Range; Dishwasher; Refrigerator
- Bedrooms: 3 main-level bedrooms
- Bathrooms: 1 full bathroom (main level)
- Heating & cooling: Forced air gas heating; Central air conditioning
- Interior features: Full basement
- Laundry & utility: Washer; Dryer
Neighborhood map
What this means for you Summary
Snapshot
- This is a 3-bed/1.0-bath single-family listed at $180k.
Deal economics
- At list price, monthly cash flow is $37 ($442/yr) — positive.
- The deal already cash-flows at list — no discount required.
- To meet the 1% rule (rent ≥ 1% of price), the offer needs to be $149k (16.9% below list).
- Recommended offer: $149k (16.9% below list) — sets the bar for 1% rule.
Location & tenants
- Location reads 72/100 on livability (#386 in OH) — a middle-class / working-renter tenant base. Strengths: crime A+, cost of living A+, housing A+; Watch: employment D, amenities F, commute F.
- Howland Local (suburban): math 59% / reading 65% proficiency, ranked #260 of 656 in OH (top 40%) — acceptable for families but not a draw, mixed tenant base, ~2y average lease.
- Zoned schools: Howland Springs Elementary School (235 students, 42% FRL); Howland Middle School (math 56% / reading 66%, grade B+, #252 of 654 statewide, top 39%, 766 students, 38% FRL); Howland High School (math 58% / reading 74%, grade B, #155 of 781 statewide, top 20%, 742 students, 38% FRL).
- Market conditions: 92 active listings in the ZIP; 129 units permitted in Trumbull County in 2024 (0 in 5+ unit buildings).
Forward outlook
- Local home prices are declining (-3.0%/yr); year-one equity from $1k of loan paydown is wiped out by about $5k of value loss. Plan a longer hold.
- Trumbull County population projected at -22% by 2050 — secular population decline; favor cash flow + early exit over multi-decade hold.
Negotiation context
- It's been on market 21 days — a 2% lower offer ($177k) is reasonable based on typical stale-listing flexibility.
- Current owner paid $62k; list at $180k implies a 187% gain — meaningful room to come down on a strong offer.
Questions for the listing agent
- Built in 1966 — when were the roof, HVAC, electrical panel, plumbing, and water heater last replaced?
- Is there a deadline driving the sale (1031 exchange, divorce, estate, relocation)? That informs how much negotiation room exists.
- Schools are D-rated, which usually means shorter tenancies and higher turnover. Who's the typical renter profile here, and what's been the actual vacancy rate?
- The area grade is low — what's the realistic commute time and amenity access for the typical tenant pool here? Any planned neighborhood developments (good or bad) we should know about?
- What's the average days-on-market for RENTAL listings here right now (not sales)? A rising rental-DOM trend means longer vacancies and softer asking-rent achievability than the comps imply.
- What's the recent tenant-quality profile in this submarket — average credit score on applications, eviction rate, late-payment / NSF rate, and stable-employment percentage? A property-management company in the area should have these aggregated.
- How much new for-sale + rental construction is in the pipeline within 1–3 miles? Heavy new supply typically softens prices + rents 12–24 months out; constrained supply supports both.
Investment metrics
- 1% rule
- 0.83% ✗
- Cap rate
- 6.54%
- Cash-on-cash
- 0.88%
- DSCR
- 1.04
- GRM
- 10.0
CMA / ARV
- ARV (on-the-fly)
- $190,704
- Comps found
- 12
Show comp detail 12 sales within ~0.75 mi
| Address | Dist | Beds/Ba | Sqft | Sold | Price | $/sf | Match |
|---|---|---|---|---|---|---|---|
| 3845 Hightree Ave SE | 0.16mi | 3/2.0 | 1,320 (-5%) | 10mo | $190,000 | $144 | 71 |
| 3622 Valacamp Ave SE | 0.29mi | 3/2.0 | 1,422 (+2%) | 10mo | $195,000 | $137 | 70 |
| 3744 Valacamp Ave SE | 0.28mi | 3/1.5 | 1,500 (+8%) | 7mo | $205,000 | $137 | 66 |
| 3435 Woodbine Ave SE | 0.26mi | 3/2.5 | 1,287 (-8%) | 5mo | $184,900 | $144 | 65 |
| 1527 N Main St | 0.42mi | 3/2.0 | 1,352 (-3%) | 9mo | $152,900 | $113 | 64 |
| 1225 Beech St | 0.41mi | 3/1.0 | 1,248 (-10%) | 4mo | $107,000 | $86 | 61 |
| 22 Camrose Dr | 0.45mi | 3/2.0 | 1,554 (+12%) | 11mo | $216,500 | $139 | 47 |
| 245 North Rd | 0.64mi | 4/2.0 (+1) | 1,500 (+8%) | 3mo | $181,000 | $121 | 46 |
| 161 Bentwillow Dr | 0.66mi | 3/1.5 | 1,508 (+8%) | 12mo | $185,000 | $123 | 43 |
| 178 Summerberry Ln | 0.71mi | 3/1.5 | 1,528 (+10%) | 9mo | $190,000 | $124 | 41 |
| 3420 Draper Ave | 0.58mi | 4/2.0 (+1) | 1,590 (+14%) | 12mo | $170,000 | $107 | 31 |
| 148 Summerberry Ln | 0.66mi | 4/3.0 (+1) | 1,248 (-10%) | 10mo | $224,480 | $180 | 30 |
Match score weights: distance 35% · size 25% · config 20% · recency 20%. Top-matched comps best support the ARV.
Projected returns pro-forma
-3.0% appreciation · 3.0% rent growth · sell at horizon
- IRR
- -14.9%
- Equity multiple
- 0.47×
- Total profit
- $-26,778
- Equity at exit
- $26,764
- IRR
- -6.3%
- Equity multiple
- 0.59×
- Total profit
- $-20,450
- Equity at exit
- $15,520
Cash invested: $50,260 (down + closing). Projections, not guarantees.
Landlord ↔ Tenant lean methodology
- Overall (STATE)
- 73 Landlord-Friendly
- State Ohio
- 73 Landlord-Friendly · R+6
- County
- — inherits STATE
- City
- — inherits STATE
ZIP-level market 44484
- Home prices YoY
- -17.5%
- Active inventory
- 92
- Price-to-rent
- 10.0×
Monthly cashflow live
- Estimated rent
- $1,493 medium interval (Pro) →
- Mortgage (P&I)
- −$941
- Tax from tax record
- −$126 /mo · $1,514/yr
- Insurance
- −$75
- HOA
- −$0
- Lot rent
- −$0
- Vacancy / Maint / Mgmt
- −$313
- Net cashflow
- $37
Break-even live
Sensitivity live
| Price | -10% $138 | -5% $88 | +0% $37 | +5% $-14 | +10% $-65 |
|---|---|---|---|---|---|
| Rent | -10% $-81 | -5% $-22 | +0% $37 | +5% $96 | +10% $155 |
| Rate | -1.0pp $127 | -0.5pp $82 | base $37 | +0.5pp $-10 | +1.0pp $-57 |
UW: 25.0% down · 7.5% · 30yr · 1.5% tax · 5.0% vac · 8.0% maint · 8.0% mgmt
Financing live
Cash to close
- Down payment
- $44,875
- Closing costs
- $5,385
- Reserves months
- —
- Total cash needed
- —
Loan-product check · same deal, 3 products live
Conventional
25% down · 7.5% · 30yr
- Down + closing
- —
- Monthly P&I
- —
- Monthly cashflow
- —
- DSCR
- —
- Eligible?
- —
Personal DTI + credit; lowest rate.
DSCR
20% down · 8.5% · 30yr
- Down + closing
- —
- Monthly P&I
- —
- Monthly cashflow
- —
- DSCR
- —
- Eligible?
- —
No personal income docs; deal must DSCR.
Hard money
10% down · 12.0% · 12mo
- Down + closing
- —
- Monthly P&I
- —
- Monthly cashflow
- —
- DSCR
- —
- Eligible?
- —
Short-term bridge; refi at stabilization.
Listing history 16 events
-
2026-06-23days on market $179,500 Active 21 DOM
-
2026-06-22pricedays on market $179,500 Active 20 DOM
-
2026-06-19days on market $182,000 Active 18 DOM
-
2026-06-18days on market $182,000 Active 17 DOM
-
2026-06-17days on market $182,000 Active 16 DOM
-
2026-06-16days on market $182,000 Active 15 DOM
-
2026-06-15days on market $182,000 Active 14 DOM
-
2026-06-14days on market $182,000 Active 12 DOM
-
2026-06-13days on market $182,000 Active 11 DOM
-
2026-06-10days on market $182,000 Active 9 DOM
-
2026-06-09days on market $182,000 Active 8 DOM
-
2026-06-08days on market $182,000 Active 7 DOM
-
2026-06-07days on market $182,000 Active 6 DOM
-
2026-06-05days on market $182,000 Active 3 DOM
-
2026-06-02remarks 699-char remark
-
2026-06-02$182,000 Active 1 DOM
ⓘ Source: listings_history table (triggers on properties + properties_extension) + one-shot
backfill from property_details.listing_events for pre-trigger history.
Tax reassessment forecast OH · Partial reset (capped growth)
- Current annual tax
- $1,514 · $126/mo
- Projected year-2 tax
- $2,157 · $180/mo
- Expected delta
- +$643/yr (+$54/mo · 42.5%)
ⓘ Screening estimate from a state-policy table — verify with the county assessor before closing.
Climate risk First Street
- Flood 1/10 Low FEMA zone X (unshaded) · 0% chance over 30 yrs
- Wildfire 1/10 Low
- Heat 3/10 Moderate 7 d/yr ≥98°F today · 17 d/yr by 30 yrs out
- Wind 1/10 Low
- Air quality 3/10 Moderate 1 unhealthy d/yr today · 4 by 30 yrs out
Nearby sold comps map
Loading sold comps map…
Walkable amenities ~0.75 mi
Loading nearby amenities…
Taxation est. · year 1
- Rental income
- $17,910
- − Mortgage interest
- −$10,055
- − Property taxes
- −$1,514
- − Insurance
- −$898
- − Repairs & maintenance
- −$1,433
- − Management
- −$1,433
- − Depreciation
- −$5,222
- Taxable loss
- −$2,643
- Est. tax savings @ 24.0%
- +$634
- After-tax cash flow
- $1,076/yr
For passive investors: Depreciation is non-cash, so a rental often shows a tax loss while cash-flowing — sheltering income. Rental losses are passive: they offset passive income freely, and up to $25,000/yr can offset ordinary (W-2) income if you actively participate and your MAGI is under $100k (phasing out to $0 by $150k); unused losses carry forward. On sale, claimed depreciation is recaptured at up to 25%, and gains may owe capital-gains tax (a 1031 exchange can defer both). Figures are a year-1 estimate at your 24.0% rate — not tax advice; consult a CPA.
Schools (NCES district)
- District
- Howland Local
- NCES district ID
- 3905016
- Math proficiency
- 59% ▼ -17.00%
- Reading proficiency
- 65% ▼ -13.00%
- Median HH income
- $49,022
- Composite
- 52.63/100
- National rank
- #1556
- State rank
- #260 of 656 in OH
Livability — Bolindale
- Score
- 72/100
- State rank
- #386
- US rank
- #6265
Category grades
Schools grade is shown separately in the Schools card above.
Census & demographics
- Census place
- Bolindale, OH
- County
- Trumbull · 193,293 people
- Metro
- Youngstown-Warren, OH
- Population (ZIP)
- 21,634
- Household income
- $65,435
- Rent vs Own
- Severe rent burden
- 6.7
Population outlook (Trumbull County) Hauer SSP2
- Today (2025)
- 191,696 people
- By 2030
- 184,015 · -4.0%
- By 2040
- 166,810 · -13.0%
- By 2050
- 149,857 · -21.8%
- By 2075
- 115,769 · -39.6%
- By 2100
- 83,617 · -56.4%
Race, ethnicity, and origin ACS 2023
- Neighborhood character
- Predominantly White (84%)
- Race & ethnicity
- White 84% Black 8% Two or more races 5% Hispanic / Latino 3% Asian 2%
- Common ancestry
- Romanian 3% Lithuanian 2% Serbian 1%
- Foreign-born
- 3% · China, Canada
- Languages at home
- 96% English-only · Other Indo-European 2% Other Asian/Pacific 1% Spanish 1%
Political lean MEDSL · Trumbull
- 2024 margin
- R (+16.8) · D 41.2% · R 58.0%
- 2008→2024 swing
- -39.2pp toward R · 2008: 22.4pp · 2024: -16.8pp
- All cycles
- 2024: R+16.8 2020: R+10.6 2016: R+6.4 2012: D+22.2 2008: D+22.4
Not yet ingested
- Civics
- —
Market trends
- HPI YoY
- ▼ -46.24%
- Current HPI
- 217.6603
- Rent YoY
- —
- Metro
- —
- State GDP YoY
- ▲ 1.98%
- F500 in state
- 48
Industry mix (Fortune 500 HQ in OH)
| Industry | F500 HQs | Revenue |
|---|---|---|
| Insurance | 3 | $145B |
|
||
| Industrial Machinery | 3 | $49B |
|
||
| Financial Services | 3 | $24B |
|
||
| Consumer Goods | 2 | $93B |
|
||
| Aerospace / Defense | 2 | $47B |
|
||
| Utilities | 2 | $33B |
|
||
Price history
+191.2% since first listed2 events — show timeline
- 2026-05-31 Listed $182,000 MLSNOW
- 2025-07-31 Sold (Public Records) $62,500 Public Records
Property tax history
+5.9%/yrLatest (2025): $1,514 · -0.6% YoY. Source: county tax records.
Cash-flow waterfall
monthlySold comps — $/sqft
last 12 mo · ≤1 miLoading sold comps…