 Multi-family
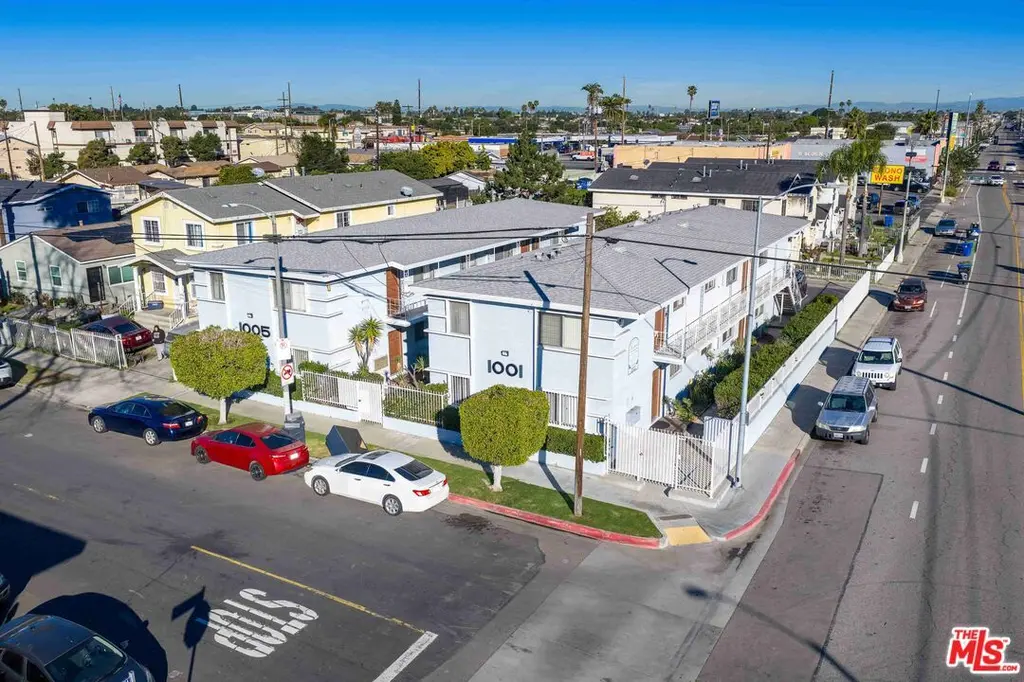
1001 & 1005 W G St · Los Angeles, CA
Flood risk 1/10 · Minimal
- FEMA flood zone
- X (unshaded)
- Chance of flooding over 30 yrs
- 0.0%
- Est. flood insurance / yr
- $507 – $1,088
Fire risk 1/10 · Minimal
- Est. fire insurance / yr
- $659 – $1,223
Heat risk 4/10 · Minor
- Hot days now (above 87°F)
- 7 days/yr
- Hot days in 30 yrs
- 23 days/yr
Wind risk 1/10 · Minimal
- Chance of severe wind over 30 yrs
- —
Air-quality risk 5/10 · Moderate
- Unhealthy air days now
- 7 days/yr
- Unhealthy air days in 30 yrs
- 7 days/yr
Risk factors via First Street. Map © Google.
Why this score? — see what drove the D grade
The composite is a weighted blend of 9 inputs, each scored 0–100. Each bar is that input's sub-score; the figure is the points it added to the 100-point composite (weight × sub-score).
- Cash flow +19.0/30.0
- DSCR +6.0/10.0
- 1% rule +5.1/10.0
- Schools +3.6/10.0
- Livability +3.4/5.0
- Condition / age +2.5/5.0
- Rent growth +1.8/5.0
- ARV discount +0.0/15.0
- Appreciation +0.0/10.0
$2,050,000
🖨 Deal sheet (PDF) 📄 Offer letter ✓ Due diligence
Multi-family units
County records classify this as Multi-Family (5+ Unit). Listing-text estimate: 1 unit. estimate disagrees with records
5+ unit building — per-unit beds/baths from public records are typically unavailable; the breakdown below (if shown) is an estimate from the listing text.
Listing remarks MLS
Price just reduced $145,000! We are pleased to present our latest investment opportunity: 1001 & 1005 West G Street. Located in the heart of Wilmington, this twelve unit property offers an attractive unit mix of ten spacious two bedroom units and two well proportioned one bedroom units. As an investment, this is a genuine value add opportunity. The units are clean, functional, and currently rented at solid levels, yet they lack the contemporary finishes that drive premium rents in the area. This creates a compelling 53% rental upside for a new owner to capture through strategic improvements, organic unit turns, targeted rent increases, or even potential cash for keys agreements. The property has benefited from years of professional, detail oriented management, with a strong emphasis on long term building health. Several major capital improvements have already been completed, significantly reducing near term maintenance exposure: The entire electrical infrastructure has been modernized from top to bottom, enhancing safety, improving reliability, and reducing future capital risk. Each unit is separately metered with individual water heaters, improving NOI and simplifying operations. There is secure, Gated Parking Controlled access and improved lighting enhance tenant satisfaction and retention. Beyond the physical asset, the economic fundamentals of the immediate area are exceptionally strong. Wilmington sits adjacent to the Port of Los Angeles and Port of Long Beach, which together form the largest container port complex in North America. This port system is not only a global logistics hub it is also the largest employment engine in the region, supporting nearly 230,000 jobs locally and more than 3 million jobs nationwide. These ports handle over 16 million TEUs annually, underscoring their scale and long term economic relevance. This concentration of port driven employment creates a stable, blue collar tenant base with consistent housing demand. The broader Los Angeles/Long Beach metro area also maintains a labor force of over 5 million workers, with more than 4.7 million employed as of the latest data. This deep and diverse employment pool further reinforces the reliability of rental demand in Wilmington. With a Walk Score of 86, the property offers excellent access to nearby retail, entertainment, and transit options - a strong complement to the steady employment base generated by the ports and surrounding industrial corridor. For investors seeking a building with clear, actionable upside, strong in place capital improvements, and proximity to one of the most economically resilient employment centers in the country, 1001 & 1005 West G Street is a standout opportunity.
Key facts
- One bedroom units
- Secure gated parking
- Controlled access
Tags
Neighborhood map
What this means for you Summary
Snapshot
- This is a 11-bed/6.0-bath multifamily listed at $2.05M.
Deal economics
- At list price, monthly cash flow is $2k ($26k/yr) — positive.
- The deal already cash-flows at list — no discount required.
- Meets the 1% rule at list price ($21k rent vs $2.05M).
- Recommended offer: $1.87M (9.0% below list) — sets the bar for market timing.
- Cap rate 7.5% vs local median 2.1% in Los Angeles — top-decile yield for the area; either an underpriced asset or a hidden risk that comps aren't pricing in. Stress-test before assuming the spread holds.
Location & tenants
- Location reads 68/100 on livability (#273 in CA) — a middle-class / working-renter tenant base. Strengths: amenities A+, commute A+, employment B; Watch: health & safety C-, crime F, cost of living F.
- Los Angeles Unified (urban): math 29% / reading 54% proficiency, ranked #223 of 517 in CA (top 43%) — families likely to look elsewhere, expect single-tenant / working-renter base with shorter leases; 67% free/reduced lunch — lower-income household profile, screen leases tightly.
- Zoned schools: Hawaiian Avenue Elementary (516 students, 97% FRL); Rudecinda Sepulveda Dodson Middle (1,285 students, 58% FRL); Phineas Banning Senior High (math 18% / reading 45%, grade F, #696 of 1,170 statewide, top 60%, 2,486 students, 93% FRL) — zoned schools average 83% FRL vs 67% district-wide (15 pts higher); higher-poverty schools than district average — tighter screening recommended.
- Market conditions: Rents soft (-2.9%/yr); 39 active listings in the ZIP; 19,697 units permitted in Los Angeles County in 2024 (9,426 in 5+ unit buildings).
- At $20,634/mo this rent would consume 407% of the median local household income ($61k/yr) (locally 3502% of renters already pay >50% of income on rent) — very limited rent-growth headroom before tenants either downsize or default.
Forward outlook
- Local home prices are declining (-3.0%/yr); year-one equity from $14k of loan paydown is wiped out by about $62k of value loss. Plan a longer hold.
- Los Angeles County population projected at +9% by 2050 — modest demand growth; plan on rents tracking national, not racing it.
Negotiation context
- It's been on market 119 days — a 9% lower offer ($1.87M) is reasonable based on typical stale-listing flexibility.
- 2 sale attempts; this cycle's ask has dropped $145k (7%) from the opening price — seller is motivated, your offer sets the floor, not the list.
Risks & watch-outs
- Watch-outs: built in 1958 — expect roof / HVAC / electrical / plumbing capex.
Questions for the listing agent
- It's been on market 119 days. Have you received any prior offers? Is the seller open to a 9% concession, seller financing, or rate buy-down credit?
- Built in 1958 — when were the roof, HVAC, electrical panel, plumbing, and water heater last replaced?
- Why hasn't it sold? Are there any deal-killer items the seller is aware of (foundation, flood, title, zoning, code violations)?
- Is there a deadline driving the sale (1031 exchange, divorce, estate, relocation)? That informs how much negotiation room exists.
- Schools are D-rated, which usually means shorter tenancies and higher turnover. Who's the typical renter profile here, and what's been the actual vacancy rate?
- Crime grade is F in this area — have there been break-ins, vandalism, or insurance claims at this property in the last 3 years? What carrier currently insures it and at what premium?
- The area grade is low — what's the realistic commute time and amenity access for the typical tenant pool here? Any planned neighborhood developments (good or bad) we should know about?
- What's the average days-on-market for RENTAL listings here right now (not sales)? A rising rental-DOM trend means longer vacancies and softer asking-rent achievability than the comps imply.
- What's the recent tenant-quality profile in this submarket — average credit score on applications, eviction rate, late-payment / NSF rate, and stable-employment percentage? A property-management company in the area should have these aggregated.
- How much new apartment / multifamily construction is in the pipeline within 1–3 miles? Heavy new supply (>2% of stock underway) typically softens rents 12–24 months out; light construction supports rent growth.
Investment metrics
- 1% rule
- 1.01% ✓
- Cap rate
- 7.54%
- Cash-on-cash
- 4.46%
- DSCR
- 1.20
- GRM
- 8.3
CMA / ARV
- ARV (median comp)
- $1,506,709
- List price
- $2,050,000
- Delta
- 36.06%
- Verdict
- OVERPRICED
- Comps
- 11 within 1.0 mi
Show comp detail 2 sales within ~0.75 mi
| Address | Dist | Beds/Ba | Sqft | Sold | Price | $/sf | Match |
|---|---|---|---|---|---|---|---|
| 1209 N Wilmington Blvd | 0.59mi | 10/5.5 (-1) | 4,452 (+7%) | 0mo | $930,000 | $209 | 53 |
| 810 W D St | 0.36mi | 10/5.0 (-1) | 3,824 (-8%) | 15mo | $1,180,000 | $309 | 49 |
Match score weights: distance 35% · size 25% · config 20% · recency 20%. Top-matched comps best support the ARV.
Projected returns pro-forma
-3.0% appreciation · 0.0% rent growth · sell at horizon
- IRR
- -12.8%
- Equity multiple
- 0.55×
- Total profit
- $-256,446
- Equity at exit
- $305,662
- IRR
- -9.1%
- Equity multiple
- 0.51×
- Total profit
- $-280,743
- Equity at exit
- $177,247
Cash invested: $574,000 (down + closing). Projections, not guarantees.
Landlord ↔ Tenant lean methodology
- Overall (CITY)
- 0 Strongly Tenant-Friendly
- State California
- 18 Strongly Tenant-Friendly · D+13
- County
- — inherits STATE
- City Los Angeles
- 0 Strongly Tenant-Friendly · D+22
ZIP-level market 90744
- Rents YoY
- -2.9%
- Active inventory
- 39
- Price-to-rent
- 97.0×
Monthly cashflow live
- Estimated rent
- $20,634 medium interval (Pro) →
- Mortgage (P&I)
- −$10,750
- Tax est. 1.5%
- −$2,562 /mo · $30,750/yr
- Insurance
- −$854
- HOA
- −$0
- Vacancy / Maint / Mgmt
- −$4,333
- Net cashflow
- $2,134
Break-even live
Sensitivity live
| Price | -10% $3,550 | -5% $2,842 | +0% $2,134 | +5% $1,425 | +10% $717 |
|---|---|---|---|---|---|
| Rent | -10% $504 | -5% $1,319 | +0% $2,134 | +5% $2,949 | +10% $3,764 |
| Rate | -1.0pp $3,166 | -0.5pp $2,655 | base $2,134 | +0.5pp $1,603 | +1.0pp $1,062 |
12-unit breakdown (identical units grouped — click to expand)
| Units | Beds | Baths | Est. rent |
|---|---|---|---|
| 10× units | 2 | 1 | $17,610 |
| #1 | 2 | 1 | $1,761 |
| #2 | 2 | 1 | $1,761 |
| #3 | 2 | 1 | $1,761 |
| #4 | 2 | 1 | $1,761 |
| #5 | 2 | 1 | $1,761 |
| #6 | 2 | 1 | $1,761 |
| #7 | 2 | 1 | $1,761 |
| #8 | 2 | 1 | $1,761 |
| #9 | 2 | 1 | $1,761 |
| #10 | 2 | 1 | $1,761 |
| 2× units | 1 | 1 | $3,020 |
| #11 | 1 | 1 | $1,510 |
| #12 | 1 | 1 | $1,510 |
| Total (12 units) | $20,634 | ||
UW: 25.0% down · 7.5% · 30yr · 1.5% tax · 5.0% vac · 8.0% maint · 8.0% mgmt
Financing live
Cash to close
- Down payment
- $512,500
- Closing costs
- $61,500
- Reserves months
- —
- Total cash needed
- —
Loan-product check · same deal, 3 products live
Conventional
25% down · 7.5% · 30yr
- Down + closing
- —
- Monthly P&I
- —
- Monthly cashflow
- —
- DSCR
- —
- Eligible?
- —
Personal DTI + credit; lowest rate.
DSCR
20% down · 8.5% · 30yr
- Down + closing
- —
- Monthly P&I
- —
- Monthly cashflow
- —
- DSCR
- —
- Eligible?
- —
No personal income docs; deal must DSCR.
Hard money
10% down · 12.0% · 12mo
- Down + closing
- —
- Monthly P&I
- —
- Monthly cashflow
- —
- DSCR
- —
- Eligible?
- —
Short-term bridge; refi at stabilization.
Listing history 6 events
-
2026-06-01days on market $2,050,000 Active 119 DOM
-
2026-05-31days on market $2,050,000 Active 118 DOM
-
2026-02-20price $2,050,000 2731-char remark
Show marketing remark (2731 chars)
Price just reduced $145,000! We are pleased to present our latest investment opportunity: 1001 & 1005 West G Street. Located in the heart of Wilmington, this twelve unit property offers an attractive unit mix of ten spacious two bedroom units and two well proportioned one bedroom units. As an investment, this is a genuine value add opportunity. The units are clean, functional, and currently rented at solid levels, yet they lack the contemporary finishes that drive premium rents in the area. This creates a compelling 53% rental upside for a new owner to capture through strategic improvements, organic unit turns, targeted rent increases, or even potential cash for keys agreements. The property has benefited from years of professional, detail oriented management, with a strong emphasis on long term building health. Several major capital improvements have already been completed, significantly reducing near term maintenance exposure: The entire electrical infrastructure has been modernized from top to bottom, enhancing safety, improving reliability, and reducing future capital risk. Each unit is separately metered with individual water heaters, improving NOI and simplifying operations. There is secure, Gated Parking Controlled access and improved lighting enhance tenant satisfaction and retention. Beyond the physical asset, the economic fundamentals of the immediate area are exceptionally strong. Wilmington sits adjacent to the Port of Los Angeles and Port of Long Beach, which together form the largest container port complex in North America. This port system is not only a global logistics hub it is also the largest employment engine in the region, supporting nearly 230,000 jobs locally and more than 3 million jobs nationwide. These ports handle over 16 million TEUs annually, underscoring their scale and long term economic relevance. This concentration of port driven employment creates a stable, blue collar tenant base with consistent housing demand. The broader Los Angeles/Long Beach metro area also maintains a labor force of over 5 million workers, with more than 4.7 million employed as of the latest data. This deep and diverse employment pool further reinforces the reliability of rental demand in Wilmington. With a Walk Score of 86, the property offers excellent access to nearby retail, entertainment, and transit options - a strong complement to the steady employment base generated by the ports and surrounding industrial corridor. For investors seeking a building with clear, actionable upside, strong in place capital improvements, and proximity to one of the most economically resilient employment centers in the country, 1001 & 1005 West G Street is a standout opportunity.
-
2026-02-02$2,195,000 Active 2731-char remark
Show marketing remark (2731 chars)
Price just reduced $145,000! We are pleased to present our latest investment opportunity: 1001 & 1005 West G Street. Located in the heart of Wilmington, this twelve unit property offers an attractive unit mix of ten spacious two bedroom units and two well proportioned one bedroom units. As an investment, this is a genuine value add opportunity. The units are clean, functional, and currently rented at solid levels, yet they lack the contemporary finishes that drive premium rents in the area. This creates a compelling 53% rental upside for a new owner to capture through strategic improvements, organic unit turns, targeted rent increases, or even potential cash for keys agreements. The property has benefited from years of professional, detail oriented management, with a strong emphasis on long term building health. Several major capital improvements have already been completed, significantly reducing near term maintenance exposure: The entire electrical infrastructure has been modernized from top to bottom, enhancing safety, improving reliability, and reducing future capital risk. Each unit is separately metered with individual water heaters, improving NOI and simplifying operations. There is secure, Gated Parking Controlled access and improved lighting enhance tenant satisfaction and retention. Beyond the physical asset, the economic fundamentals of the immediate area are exceptionally strong. Wilmington sits adjacent to the Port of Los Angeles and Port of Long Beach, which together form the largest container port complex in North America. This port system is not only a global logistics hub it is also the largest employment engine in the region, supporting nearly 230,000 jobs locally and more than 3 million jobs nationwide. These ports handle over 16 million TEUs annually, underscoring their scale and long term economic relevance. This concentration of port driven employment creates a stable, blue collar tenant base with consistent housing demand. The broader Los Angeles/Long Beach metro area also maintains a labor force of over 5 million workers, with more than 4.7 million employed as of the latest data. This deep and diverse employment pool further reinforces the reliability of rental demand in Wilmington. With a Walk Score of 86, the property offers excellent access to nearby retail, entertainment, and transit options - a strong complement to the steady employment base generated by the ports and surrounding industrial corridor. For investors seeking a building with clear, actionable upside, strong in place capital improvements, and proximity to one of the most economically resilient employment centers in the country, 1001 & 1005 West G Street is a standout opportunity.
-
2026-01-11historical $2,100
-
2026-01-08$2,100
ⓘ Source: listings_history table (triggers on properties + properties_extension) + one-shot
backfill from property_details.listing_events for pre-trigger history.
Climate risk First Street
- Flood 1/10 Low FEMA zone X (unshaded) · 0% chance over 30 yrs
- Wildfire 1/10 Low
- Heat 4/10 Moderate 7 d/yr ≥87°F today · 23 d/yr by 30 yrs out
- Wind 1/10 Low
- Air quality 5/10 Major 7 unhealthy d/yr today · 7 by 30 yrs out
Nearby sold comps map
Loading sold comps map…
Walkable amenities ~0.75 mi
Loading nearby amenities…
Taxation est. · year 1
- Rental income
- $247,608
- − Mortgage interest
- −$114,832
- − Property taxes
- −$30,750
- − Insurance
- −$10,250
- − Repairs & maintenance
- −$19,809
- − Management
- −$19,809
- − Depreciation
- −$59,636
- Taxable loss
- −$7,478
- Est. tax savings @ 24.0%
- +$1,795
- After-tax cash flow
- $27,400/yr
For passive investors: Depreciation is non-cash, so a rental often shows a tax loss while cash-flowing — sheltering income. Rental losses are passive: they offset passive income freely, and up to $25,000/yr can offset ordinary (W-2) income if you actively participate and your MAGI is under $100k (phasing out to $0 by $150k); unused losses carry forward. On sale, claimed depreciation is recaptured at up to 25%, and gains may owe capital-gains tax (a 1031 exchange can defer both). Figures are a year-1 estimate at your 24.0% rate — not tax advice; consult a CPA.
Schools (NCES district)
- District
- Los Angeles Unified
- NCES district ID
- 0622710
- Math proficiency
- 29% ▼ -4.00%
- Reading proficiency
- 54% ▲ 10.00%
- Median HH income
- $50,403
- Composite
- 35.67/100
- National rank
- #4875
- State rank
- #223 of 517 in CA
Livability — Los Angeles
- Score
- 68/100
- State rank
- #273
- US rank
- #9237
Category grades
Schools grade is shown separately in the Schools card above.
Census & demographics
- Census place
- Los Angeles, CA
- County
- Los Angeles County · 9,444,647 people
- City population
- 3,838,149
- Metro
- Los Angeles-Long Beach-Anaheim, CA
- Population (ZIP)
- 52,800
- Household income
- $60,847
- Rent vs Own
- Severe rent burden
- 3502.0
Population outlook (Los Angeles County) Hauer SSP2
- Today (2025)
- 10,940,515 people
- By 2030
- 11,256,481 · +2.9%
- By 2040
- 11,729,929 · +7.2%
- By 2050
- 11,948,407 · +9.2%
- By 2075
- 11,818,114 · +8.0%
- By 2100
- 10,842,928 · -0.9%
Race, ethnicity, and origin ACS 2023
- Neighborhood character
- Predominantly Hispanic (88%)
- Race & ethnicity
- Hispanic / Latino 88% Two or more races 14% White 4% Black 4% Asian 3% Native American 1%
- Hispanic origin (detail)
- Mexican 77%
- Foreign-born
- 37% · Canada, South Korea
- Languages at home
- 24% English-only · Spanish 73% Tagalog/Filipino 1%
Political lean MEDSL · Los Angeles
- 2024 margin
- Solid D (+32.9) · D 64.8% · R 31.9% · Other 3.3%
- 2008→2024 swing
- -7.4pp toward R · 2008: 40.4pp · 2024: 32.9pp
- All cycles
- 2024: D+32.9 2020: D+44.2 2016: D+48.0 2012: D+40.0 2008: D+40.4
Not yet ingested
- Civics
- —
Market trends
- HPI YoY
- ▼ -525.62%
- Current HPI
- 405.1141
- Rent YoY
- ▼ -2.91%
- Metro
- Los Angeles-Long Beach-Anaheim, CA
- State GDP YoY
- ▲ 3.21%
- F500 in state
- 116
Industry mix (Fortune 500 HQ in CA)
| Industry | F500 HQs | Revenue |
|---|---|---|
| Technology | 27 | $1,492B |
|
||
| Financial Services | 3 | $174B |
|
||
| Retail | 3 | $44B |
|
||
| Insurance | 3 | $26B |
|
||
| Media / Entertainment | 2 | $115B |
|
||
| Pharmaceuticals / Biotech | 2 | $62B |
|
||
Price history
+97519.0% since first listed4 events — show timeline
- 2026-02-20 Price Changed $2,050,000 TheMLS
- 2026-02-02 Listed $2,195,000 TheMLS
- 2026-01-11 Rental Removed $2,100 RENTALBEAST
- 2026-01-08 Listed for Rent $2,100 RENTALBEAST
Property tax history
+1.7%/yrLatest (2025): $2,632 · +2.5% YoY. Source: county tax records.
Cash-flow waterfall
monthlySold comps — $/sqft
last 12 mo · ≤1 miLoading sold comps…