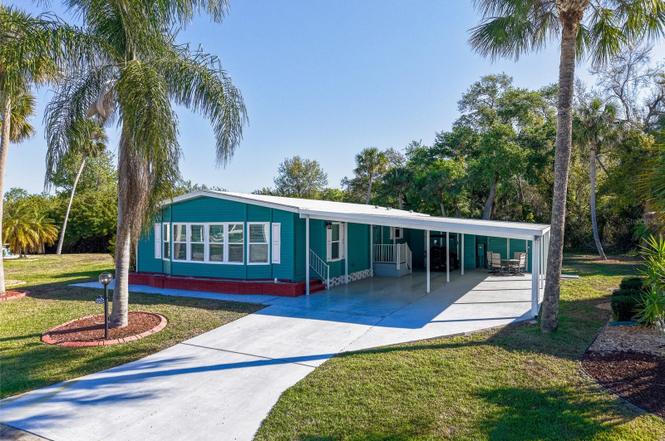
5910 Majestic Way · Ellenton, FL
Flood risk 1/10 · Minimal
- FEMA flood zone
- X (unshaded)
- Chance of flooding over 30 yrs
- 0.0%
- Est. flood insurance / yr
- $507 – $1,088
Fire risk 2/10 · Minimal
- Est. fire insurance / yr
- $947 – $1,759
Heat risk 10/10 · Severe
- Hot days now (above 107°F)
- 7 days/yr
- Hot days in 30 yrs
- 29 days/yr
Wind risk 10/10 · Severe
- Chance of severe wind over 30 yrs
- 99.0%
Air-quality risk 3/10 · Minor
- Unhealthy air days now
- 3 days/yr
- Unhealthy air days in 30 yrs
- 3 days/yr
Risk factors via First Street. Map © Google.
Why this score? — see what drove the D- grade
The composite is a weighted blend of 9 inputs, each scored 0–100. Each bar is that input's sub-score; the figure is the points it added to the 100-point composite (weight × sub-score).
- Cash flow +13.0/30.0
- 1% rule +4.8/10.0
- Schools +4.4/10.0
- DSCR +3.9/10.0
- Livability +3.8/5.0
- ARV discount +2.6/15.0
- Condition / age +2.5/5.0
- Rent growth +1.8/5.0
- Appreciation +0.0/10.0
$225,000
🖨 Deal sheet (PDF) 📄 Offer letter ✓ Due diligence
Listing remarks
Life at Imperial Lakes moves at exactly the pace you set. This land-owned, pet-friendly 55+ community spreads across 65 quiet, park-like acres in Palmetto, with enough going on that boredom is genuinely not an option. Two heated pools, a spa, pickleball, tennis, shuffleboard, bocce ball, a private lake with community boat ramp access, and a clubhouse running darts, bingo, poker, and card games year-round. A full social calendar when you want it, or a quiet Tuesday morning with nothing but birdsong behind you when you don't. The home is genuinely move-in ready. Hurricane-impact windows replaced two years ago, a new water heater, new entry door, updated flooring throughout, all-new appliances
Key facts
- Heated pools
- Pet-friendly
- Clubhouse
Tags
Property features AI
Finance
- Other: Lease restrictions apply; Furniture available for separate purchase
- Financial info: Monthly condo/association fee: $190 (monthly); Total annual fees: $2,280
- HOA & community: Community association (Darcy Branch) with monthly fee of $190; Association fee includes cable TV, pool, internet, common area taxes and grounds maintenance; Buyer approval required for association; Association recreation owned; Fitness center; Pool; Tennis courts; Golf carts allowed; Deed restrictions; Senior community; Pets allowed (max 25 lbs)
Exterior
- Parking: Driveway; Carport with 2 spaces
- Utilities: Public water; Public sewer; Broadband/high-speed internet available; Cable available and connected; Electricity connected; Irrigation equipment
- Home design: Manufactured double-wide home; One story; Faces east; Residential property
- Construction: Frame construction; Membrane roof; Crawlspace foundation; Built as a double wide
- Exterior features: Covered, enclosed patio; Patio; Exterior lighting; Sliding doors; Exterior storage; Shed(s); Workshop; Private boat ramp; Lake access; In-ground heated pool with deck, gunite finish, lighting and outside bath access; In-ground heated spa
Interior
- Kitchen: Dishwasher; Range; Range hood; Refrigerator; Electric water heater
- Bedrooms: 2 bedrooms
- Flooring: Carpet; Ceramic tile; Laminate
- Bathrooms: 2 full bathrooms
- Heating & cooling: Central heating (electric); Central air conditioning
- Interior features: Built-in features; Ceiling fans; Kitchen/family room combo; Living room/dining room combo; Open floor plan; Solid surface counters; Solid wood cabinets; Thermostat; Vaulted ceilings; Walk-in closets
- Laundry & utility: Washer hookup; Electric dryer hookup; Laundry closet
Neighborhood map
What this means for you Summary
Snapshot
- This is a 2-bed/1.0-bath manufactured listed at $225k.
Deal economics
- At list price, monthly cash flow is $-11 ($-127/yr) — negative.
- To cash-flow at today's rent, offer at most $223k (0.7% below list).
- To meet the 1% rule (rent ≥ 1% of price), the offer needs to be $220k (2.4% below list).
- Recommended offer: $205k (9.0% below list) — sets the bar for market timing.
- Cap rate 6.2% vs local median 4.5% in Ellenton — top-decile yield for the area; either an underpriced asset or a hidden risk that comps aren't pricing in. Stress-test before assuming the spread holds.
Location & tenants
- Location reads 76/100 on livability (#232 in FL, #3,666 nationally) — a middle-class / working-renter tenant base. Strengths: cost of living A+, housing A+, health & safety A+; Watch: amenities F, commute F.
- Manatee (suburban): math 54% / reading 50% proficiency, ranked #26 of 73 in FL (top 36%) — acceptable for families but not a draw, mixed tenant base, ~2y average lease.
- Zoned schools: Virgil Mills Elementary School (math 69% / reading 65%, grade B+, #450 of 2,144 statewide, top 22%, 818 students, 43% FRL); Buffalo Creek Middle School (math 59% / reading 51%, grade B-, #180 of 571 statewide, top 32%, 1,127 students, 44% FRL); Palmetto High School (math 22% / reading 36%, grade F, #456 of 667 statewide, top 68%, 2,100 students, 61% FRL) — zoned schools at 50% FRL track the district average.
- Market conditions: Rents soft (-3.0%/yr); 1170 active listings in the ZIP; 16 comparable units currently listed for rent nearby; rentals at typical pace (median 24d on market — plan ~3-4 weeks tenant-placement turnaround); solid renter incomes; 7,472 units permitted in Manatee County in 2024 (1,782 in 5+ unit buildings).
- This rent runs 34% of the median local income ($78k/yr) — at the standard rent-burdened threshold; future hikes will face affordability resistance.
Forward outlook
- Local home prices are declining (-3.0%/yr); year-one equity from $2k of loan paydown is wiped out by about $7k of value loss. Plan a longer hold.
- Manatee County population projected at +43% by 2050 — long-run rental-demand tailwind backs the buy-and-hold thesis.
Negotiation context
- It's been on market 100 days — a 9% lower offer ($205k) is reasonable based on typical stale-listing flexibility.
- 9 sale attempts since 22y ago with the ask held roughly flat each time — persistent listings suggest the price (not the market) is what's stuck; bring a comps-based counter.
- Current owner paid $152k; 48% above their basis — modest negotiation headroom, anchor on the comps not their cost.
Risks & watch-outs
- Climate carrying-cost: severe wind risk, 99% chance of damaging wind over 30y; extreme-heat days projected 7→29/yr by 2055 (HVAC capex compounding) — expect insurance premiums to compound above CPI over the hold.
Questions for the listing agent
- What do current leases actually rent for vs. the listed asking? Can we see a recent rent roll and the last 12 months of T-12 income?
- It's been on market 100 days. Have you received any prior offers? Is the seller open to a 9% concession, seller financing, or rate buy-down credit?
- What does the HOA fee cover, when was the last increase, and are there any pending special assessments or reserve-fund shortfalls?
- Why hasn't it sold? Are there any deal-killer items the seller is aware of (foundation, flood, title, zoning, code violations)?
- Is there a deadline driving the sale (1031 exchange, divorce, estate, relocation)? That informs how much negotiation room exists.
- Schools are D-rated, which usually means shorter tenancies and higher turnover. Who's the typical renter profile here, and what's been the actual vacancy rate?
- The area grade is low — what's the realistic commute time and amenity access for the typical tenant pool here? Any planned neighborhood developments (good or bad) we should know about?
- What's the average days-on-market for RENTAL listings here right now (not sales)? A rising rental-DOM trend means longer vacancies and softer asking-rent achievability than the comps imply.
- What's the recent tenant-quality profile in this submarket — average credit score on applications, eviction rate, late-payment / NSF rate, and stable-employment percentage? A property-management company in the area should have these aggregated.
- How much new for-sale + rental construction is in the pipeline within 1–3 miles? Heavy new supply typically softens prices + rents 12–24 months out; constrained supply supports both.
Investment metrics
- 1% rule
- 0.98% ✗
- Cap rate
- 6.24%
- Cash-on-cash
- -0.20%
- DSCR
- 0.99
- GRM
- 8.5
CMA / ARV
- ARV (on-the-fly)
- $203,060
- Comps found
- 12
Show comp detail 12 sales within ~0.75 mi
| Address | Dist | Beds/Ba | Sqft | Sold | Price | $/sf | Match |
|---|---|---|---|---|---|---|---|
| 8523 Countess Avenue Cir | 0.26mi | 2/2.0 | 1,431 (+1%) | 5mo | $207,500 | $145 | 79 |
| 8402 Imperial Cir | 0.19mi | 2/2.0 | 1,340 (-6%) | 3mo | $198,000 | $148 | 76 |
| 8466 Imperial Cir | 0.19mi | 2/2.0 | 1,502 (+6%) | 4mo | $180,000 | $120 | 74 |
| 8427 Castle Garden Rd | 0.14mi | 2/2.0 | 1,296 (-9%) | 3mo | $185,000 | $143 | 72 |
| 8308 Princess Ct | 0.39mi | 2/2.0 | 1,456 (+2%) | 3mo | $180,000 | $124 | 71 |
| 8509 Monarch Pl | 0.30mi | 2/2.0 | 1,352 (-5%) | 3mo | $255,000 | $189 | 71 |
| 8434 Imperial Cir | 0.14mi | 2/2.0 | 1,536 (+8%) | 7mo | $187,500 | $122 | 70 |
| 8416 Imperial Cir | 0.13mi | 2/2.0 | 1,260 (-11%) | 5mo | $175,000 | $139 | 67 |
| 8400 Princess Ct | 0.38mi | 3/2.0 (+1) | 1,456 (+2%) | 4mo | $185,000 | $127 | 66 |
| 8485 Imperial Cir | 0.25mi | 2/2.0 | 1,592 (+12%) | 3mo | $160,000 | $101 | 62 |
| 8531 Imperial Cir | 0.34mi | 2/2.0 | 1,274 (-10%) | 6mo | $225,000 | $177 | 58 |
| 8521 Countess Avenue Cir | 0.26mi | 3/2.0 (+1) | 1,596 (+12%) | 2mo | $235,000 | $147 | 57 |
Match score weights: distance 35% · size 25% · config 20% · recency 20%. Top-matched comps best support the ARV.
Projected returns pro-forma
-3.0% appreciation · 0.0% rent growth · sell at horizon
- IRR
- -20.4%
- Equity multiple
- 0.31×
- Total profit
- $-43,417
- Equity at exit
- $33,548
- IRR
- -23.6%
- Equity multiple
- 0.00×
- Total profit
- $-62,928
- Equity at exit
- $19,454
Cash invested: $63,000 (down + closing). Projections, not guarantees.
Landlord ↔ Tenant lean methodology
- Overall (STATE)
- 87 Strongly Landlord-Friendly
- State Florida
- 87 Strongly Landlord-Friendly · R+3
- County
- — inherits STATE
- City
- — inherits STATE
ZIP-level market 34221
- Rents YoY
- -3.0%
- Active inventory
- 1170
- Price-to-rent
- 8.5×
Monthly cashflow live
- Estimated rent
- $2,195 high interval (Pro) →
- Mortgage (P&I)
- −$1,180
- Tax est. 1.5%
- −$281 /mo · $3,375/yr
- Insurance
- −$94
- HOA
- −$190
- Vacancy / Maint / Mgmt
- −$461
- Net cashflow
- $-11
Break-even live
Sensitivity live
| Price | -10% $145 | -5% $67 | +0% $-11 | +5% $-88 | +10% $-166 |
|---|---|---|---|---|---|
| Rent | -10% $-184 | -5% $-97 | +0% $-11 | +5% $76 | +10% $163 |
| Rate | -1.0pp $103 | -0.5pp $47 | base $-11 | +0.5pp $-69 | +1.0pp $-128 |
UW: 25.0% down · 7.5% · 30yr · 1.5% tax · 5.0% vac · 8.0% maint · 8.0% mgmt
Financing live
Cash to close
- Down payment
- $56,250
- Closing costs
- $6,750
- Reserves months
- —
- Total cash needed
- —
Loan-product check · same deal, 3 products live
Conventional
25% down · 7.5% · 30yr
- Down + closing
- —
- Monthly P&I
- —
- Monthly cashflow
- —
- DSCR
- —
- Eligible?
- —
Personal DTI + credit; lowest rate.
DSCR
20% down · 8.5% · 30yr
- Down + closing
- —
- Monthly P&I
- —
- Monthly cashflow
- —
- DSCR
- —
- Eligible?
- —
No personal income docs; deal must DSCR.
Hard money
10% down · 12.0% · 12mo
- Down + closing
- —
- Monthly P&I
- —
- Monthly cashflow
- —
- DSCR
- —
- Eligible?
- —
Short-term bridge; refi at stabilization.
Rent comps 16 comps
| Address | Beds | Baths | Sqft | Rent | $/sqft | DOM | Units | Dist |
|---|---|---|---|---|---|---|---|---|
| 9650 52nd Ave E Palmetto, FL | 1.0–3.0 | 1.0–2.0 | 1050 | $1,958 | $1.87 | 25d | 99 | 0.80mi |
| 5871 Bungalow Grove Ct Palmetto, FL | 3.0 | 2.0 | 1492 | $2,185 | $1.46 | 23d | 1 | 0.99mi |
| 5020 Cedar Leaf Cir Palmetto, FL | 1.0–2.0 | 1.0–2.0 | 873 | $2,495 | $2.86 | 0d | 18 | 1.01mi |
| 6210 Terra Lago Cir Palmetto, FL | 1.0–3.0 | 1.0–2.0 | 1015 | $1,962 | $1.93 | 5d | 50 | 1.07mi |
| 4117 84th Ct E Palmetto, FL | 3.0 | 2.0 | 1448 | $2,466 | $1.70 | 23d | 1 | 1.13mi |
| 7562 Sea Oak Ct Palmetto, FL | 3.0 | 2.0 | 1433 | $2,400 | $1.67 | 23d | 1 | 1.16mi |
| 7566 Sea Oak Ct Palmetto, FL | 3.0 | 2.5 | 1807 | $2,700 | $1.49 | 23d | 1 | 1.16mi |
| 9117 Optimist Way Palmetto, FL | 2.0 | 2.0 | 1489 | $2,200 | $1.48 | 25d | 1 | 1.19mi |
| 4014 84th Ct E Palmetto, FL | 3.0 | 2.0 | 1555 | $2,516 | $1.62 | 23d | 1 | 1.22mi |
| 6249 Fairmont Ln Palmetto, FL | 2.0 | 2.5 | 1200 | $1,890 | $1.57 | 16d | 1 | 1.31mi |
| 6256 Fairmont Ln Palmetto, FL | 2.0 | 2.5 | 1216 | $1,845 | $1.52 | 16d | 1 | 1.34mi |
| 6334 Fairmont Ln Palmetto, FL | 2.0 | 2.5 | 1235 | $1,795 | $1.45 | 5d | 1 | 1.34mi |
| 6354 Fairmont Ln Palmetto, FL | 2.0 | 2.5 | 1123 | $2,000 | $1.78 | 25d | 1 | 1.35mi |
| 6345 Willowside St Palmetto, FL | 3.0 | 2.5 | 1407 | $2,200 | $1.56 | 25d | 1 | 1.37mi |
| 9207 Bonita Mar Dr Parrish, FL | 3.0 | 2.5 | 1666 | $2,275 | $1.37 | 25d | 1 | 1.49mi |
| 6109 63rd Ave E Palmetto, FL | 3.0 | 2.0 | 1295 | $1,950 | $1.51 | 0d | 1 | 1.50mi |
HOA detail
- Monthly dues
- $190 · $2,280/yr
- Likely covers
- waterpool
Listing history 41 events
-
2026-06-22days on market $225,000 Active 100 DOM
-
2026-06-18days on market $225,000 Active 97 DOM
-
2026-06-17days on market $225,000 Active 96 DOM
-
2026-06-16days on market $225,000 Active 95 DOM
-
2026-06-15days on market $225,000 Active 94 DOM
-
2026-06-13days on market $225,000 Active 92 DOM
-
2026-06-13days on market $225,000 Active 91 DOM
-
2026-06-10days on market $225,000 Active 89 DOM
-
2026-06-09days on market $225,000 Active 88 DOM
-
2026-06-08days on market $225,000 Active 87 DOM
-
2026-06-08days on market $225,000 Active 86 DOM
-
2026-06-03days on market $225,000 Active 82 DOM
-
2026-06-02days on market $225,000 Active 81 DOM
-
2026-06-01days on market $225,000 Active 80 DOM
-
2026-05-31days on market $225,000 Active 79 DOM
-
2026-04-13price $225,000
-
2026-03-13$235,000 Active
-
2026-02-26historical
-
2026-01-12price $235,000
-
2025-09-10price $255,000
-
2025-09-10$255,000 Active
-
2025-09-04historical
-
2025-05-15price $265,000
-
2025-04-24price $270,000
-
2025-04-01$275,000 Active
-
2016-12-20soldstatus $152,000
-
2016-12-15soldstatus $152,000 Sold
-
2016-11-14status Pending
-
2016-10-31$154,000 Active
-
2013-12-04soldstatus $109,000
-
2012-02-15$118,000
-
2007-05-23soldstatus $105,000
-
2007-05-21soldstatus $105,000
-
2007-04-05$119,900
-
2006-06-07$119,900
-
2006-04-05$159,900
-
2004-09-09soldstatus $137,000
-
2004-09-03soldstatus $139,000
-
2004-07-14$140,000
-
2001-04-18soldstatus $91,000
-
1988-11-09soldstatus $76,600
ⓘ Source: listings_history table (triggers on properties + properties_extension) + one-shot
backfill from property_details.listing_events for pre-trigger history.
Climate risk First Street
- Flood 1/10 Low FEMA zone X (unshaded) · 0% chance over 30 yrs
- Wildfire 2/10 Low
- Heat 10/10 Extreme 7 d/yr ≥107°F today · 29 d/yr by 30 yrs out
- Wind 10/10 Extreme 99% chance of damaging wind over 30 yrs
- Air quality 3/10 Moderate 3 unhealthy d/yr today · 3 by 30 yrs out
Nearby sold comps map
Loading sold comps map…
Walkable amenities ~0.75 mi
Loading nearby amenities…
Taxation est. · year 1
- Rental income
- $26,345
- − Mortgage interest
- −$12,603
- − Property taxes
- −$3,375
- − Insurance
- −$1,125
- − Repairs & maintenance
- −$2,108
- − Management
- −$2,108
- − HOA
- −$2,280
- − Depreciation
- −$6,545
- Taxable loss
- −$3,799
- Est. tax savings @ 24.0%
- +$912
- After-tax cash flow
- $785/yr
For passive investors: Depreciation is non-cash, so a rental often shows a tax loss while cash-flowing — sheltering income. Rental losses are passive: they offset passive income freely, and up to $25,000/yr can offset ordinary (W-2) income if you actively participate and your MAGI is under $100k (phasing out to $0 by $150k); unused losses carry forward. On sale, claimed depreciation is recaptured at up to 25%, and gains may owe capital-gains tax (a 1031 exchange can defer both). Figures are a year-1 estimate at your 24.0% rate — not tax advice; consult a CPA.
Schools (NCES district)
- District
- Manatee
- NCES district ID
- 1201230
- Math proficiency
- 54% ▼ -6.00%
- Reading proficiency
- 50% ▼ -2.00%
- Median HH income
- $49,607
- Composite
- 44.43/100
- National rank
- #2806
- State rank
- #26 of 73 in FL
Livability — Ellenton
- Score
- 76/100
- State rank
- #232
- US rank
- #3666
Category grades
Schools grade is shown separately in the Schools card above.
Census & demographics
- County
- Manatee County · 416,364 people
- Metro
- North Port-Sarasota-Bradenton, FL
- Population (ZIP)
- 56,208
- Household income
- $77,712
- Rent vs Own
- Severe rent burden
- 1193.0
Population outlook (Manatee County) Hauer SSP2
- Today (2025)
- 447,342 people
- By 2030
- 488,911 · +9.3%
- By 2040
- 567,934 · +27.0%
- By 2050
- 637,995 · +42.6%
- By 2075
- 781,970 · +74.8%
- By 2100
- 848,272 · +89.6%
Race, ethnicity, and origin ACS 2023
- Neighborhood character
- Diverse neighborhood (Simpson 0.58)
- Race & ethnicity
- White 59% Hispanic / Latino 22% Black 14% Two or more races 11%
- Hispanic origin (detail)
- Mexican 14% Puerto Rican 3%
- Common ancestry
- Romanian 2% Lithuanian 2% Italian 2%
- Foreign-born
- 10% · Canada, Dominican Republic, Jamaica
- Languages at home
- 81% English-only · Spanish 16% Other Indo-European 1%
Political lean MEDSL · Manatee
- 2024 margin
- Strong R (+23.5) · D 37.9% · R 61.4%
- 2008→2024 swing
- -16.5pp toward R · 2008: -7.0pp · 2024: -23.5pp
- All cycles
- 2024: R+23.5 2020: R+16.1 2016: R+17.1 2012: R+12.5 2008: R+7.0
Not yet ingested
- Civics
- —
Market trends
- HPI YoY
- ▼ -383.53%
- Current HPI
- 302.1458
- Rent YoY
- ▼ -2.98%
- Metro
- North Port-Sarasota-Bradenton, FL
- State GDP YoY
- ▲ 3.28%
- F500 in state
- 36
Industry mix (Fortune 500 HQ in FL)
| Industry | F500 HQs | Revenue |
|---|---|---|
| Industrial Technology | 2 | $29B |
|
||
| Insurance | 2 | $17B |
|
||
| Retail | 1 | $60B |
|
||
| Technology Distribution | 1 | $58B |
|
||
| Homebuilding | 1 | $35B |
|
||
| Technology Manufacturing | 1 | $35B |
|
||
Price history
+193.7% since first listed26 events — show timeline
- 2026-04-13 Price Changed $225,000 Stellar MLS as Distributed by MLS Grid
- 2026-03-13 Listed $235,000 Stellar MLS as Distributed by MLS Grid
- 2026-02-26 Listing Removed — Stellar MLS as Distributed by MLS Grid
- 2026-01-12 Price Changed $235,000 Stellar MLS as Distributed by MLS Grid
- 2025-09-10 Price Changed $255,000 Stellar MLS as Distributed by MLS Grid
- 2025-09-10 Listed $255,000 Stellar MLS as Distributed by MLS Grid
- 2025-09-04 Listing Removed — Stellar MLS as Distributed by MLS Grid
- 2025-05-15 Price Changed $265,000 Stellar MLS as Distributed by MLS Grid
- 2025-04-24 Price Changed $270,000 Stellar MLS as Distributed by MLS Grid
- 2025-04-01 Listed $275,000 Stellar MLS as Distributed by MLS Grid
- 2016-12-20 Sold (Public Records) $152,000 Public Records
- 2016-12-15 Sold (MLS) $152,000 Stellar MLS as Distributed by MLS Grid
- 2016-11-14 Pending — Stellar MLS as Distributed by MLS Grid
- 2016-10-31 Listed $154,000 Stellar MLS as Distributed by MLS Grid
- 2013-12-04 Sold (Public Records) $109,000 Public Records
- 2012-02-15 Listed $118,000 Stellar MLS as Distributed by MLS Grid
- 2007-05-23 Sold (Public Records) $105,000 Public Records
- 2007-05-21 Sold (MLS) $105,000 Stellar MLS as Distributed by MLS Grid
- 2007-04-05 Listed $119,900 Stellar MLS as Distributed by MLS Grid
- 2006-06-07 Listed $119,900 Stellar MLS as Distributed by MLS Grid
- 2006-04-05 Listed $159,900 Stellar MLS as Distributed by MLS Grid
- 2004-09-09 Sold (Public Records) $137,000 Public Records
- 2004-09-03 Sold (MLS) $139,000 Stellar MLS as Distributed by MLS Grid
- 2004-07-14 Listed $140,000 Stellar MLS as Distributed by MLS Grid
- 2001-04-18 Sold (Public Records) $91,000 Public Records
- 1988-11-09 Sold (Public Records) $76,600 Public Records
Property tax history
-6.6%/yrLatest (2025): $264 · +7.5% YoY. Source: county tax records.
Cash-flow waterfall
monthlySold comps — $/sqft
last 12 mo · ≤1 miLoading sold comps…