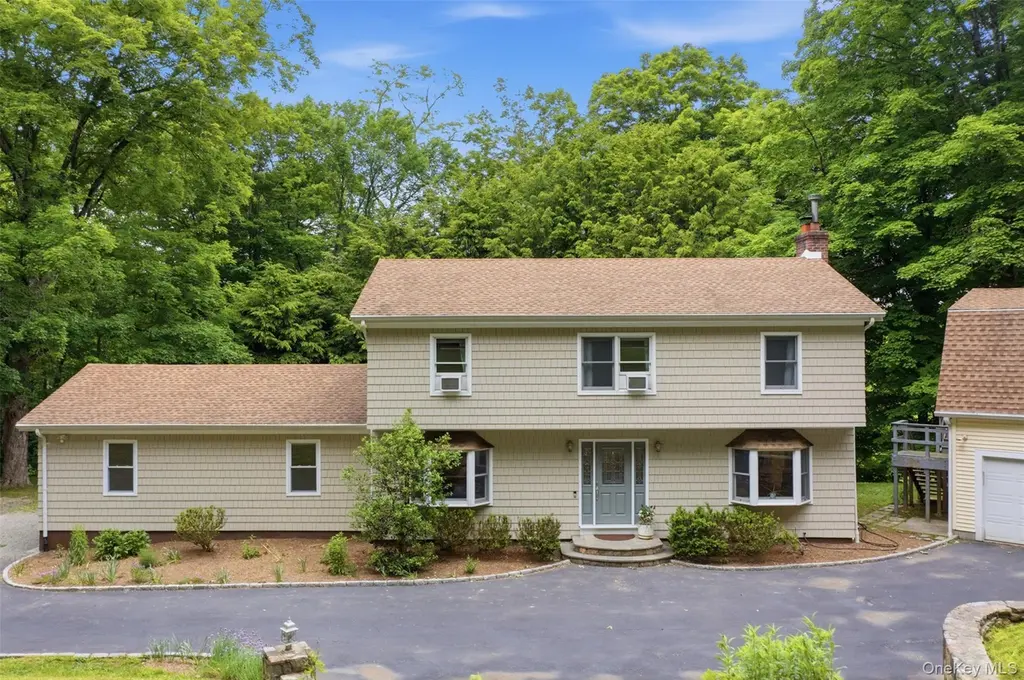
186 High Ridge Rd · Scotts Corners, NY
Flood risk 1/10 · Minimal
- FEMA flood zone
- X (unshaded)
- Chance of flooding over 30 yrs
- 0.0%
- Est. flood insurance / yr
- $473 – $860
Fire risk 3/10 · Minor
- Est. fire insurance / yr
- $691 – $1,283
Heat risk 4/10 · Minor
- Hot days now (above 99°F)
- 7 days/yr
- Hot days in 30 yrs
- 16 days/yr
Wind risk 6/10 · Moderate
- Chance of severe wind over 30 yrs
- 27.0%
Air-quality risk 4/10 · Minor
- Unhealthy air days now
- 4 days/yr
- Unhealthy air days in 30 yrs
- 7 days/yr
Risk factors via First Street. Map © Google.
Why this score? — see what drove the D grade
The composite is a weighted blend of 9 inputs, each scored 0–100. Each bar is that input's sub-score; the figure is the points it added to the 100-point composite (weight × sub-score).
- ARV discount +7.7/15.0
- Cash flow +7.6/30.0
- Appreciation +6.9/10.0
- Schools +5.3/10.0
- Livability +3.2/5.0
- 1% rule +2.6/10.0
- Rent growth +2.5/5.0
- Condition / age +2.5/5.0
- DSCR +1.7/10.0
$960,000
🖨 Deal sheet (PDF) 📄 Offer letter ✓ Due diligence
Listing remarks MLS
Welcome to 186 High Ridge Road, perched upon a hilltop where the living is easy and private! Renovated kitchen, baths, hardwood floors, Come cozy up to the wood burning fireplace in the living room and dine in the formal dining room. This charming center hall colonial with an easy flow sits on 2.81 private acres. Bright and sunny 4 bedroom, 2 and one half bath home features an attached 2 car garage as well as a detached 3 car garage so 5 cars in total! Space above the 3 car garage is ideal for storage. Laundry and powder room conveniently located on the first floor. Spacious deck right off the kitchen ideal for entertaining and relaxing. Full basement features 874 square feet of space. Ideal for a playroom, gym, office and storage. So close to the Pound Ridge town park which features a pool, tennis, hiking and concerts. Closely located to Scott's Corners, Bedford Village and Stamford. New roof 2016, new septic fields 2021, new windows, new driveway, freshly painted! Additional Information: HeatingFuel:Oil Above Ground,ParkingFeatures:2 Car Attached,3 Car Detached,
Key facts
- 2.81 acre lot
- 5 garage spots
- Built 1962
Property features AI
Exterior
- Parking: Garage; 5-car garage
- Utilities: Electric service by NYSEG; Septic tank; Cable available and connected; Electricity available and connected; Private trash collection
- Home design: Single family residence
- Construction: Frame construction
- Exterior features: Frame construction; Not waterfront
Interior
- Kitchen: Electric cooktop; Electric oven; Electric range; ENERGY STAR qualified appliances; Refrigerator; Stainless steel appliances
- Flooring: Hardwood
- Bathrooms: 2 full bathrooms; 1 half bathroom
- Heating & cooling: Forced air heating; Oil heating; Wall/window air conditioning units
- Interior features: Eat-in kitchen; Formal dining room; Pantry; Storage; Walk-in closet(s); Finished basement; 9 total rooms; Crawl attic
- Laundry & utility: Washer; Oil water heater
Neighborhood map
What this means for you Summary
Snapshot
- This is a 4-bed/2.5-bath single-family listed at $960k.
Deal economics
- At list price, monthly cash flow is $-1k ($-14k/yr) — negative.
- To cash-flow at today's rent, offer at most $758k (21.0% below list).
- To meet the 1% rule (rent ≥ 1% of price), the offer needs to be $725k (24.5% below list).
- Recommended offer: $725k (24.5% below list) — sets the bar for 1% rule.
- Cap rate 4.9% vs local median 2.4% in Scotts Corners — top-decile yield for the area; either an underpriced asset or a hidden risk that comps aren't pricing in. Stress-test before assuming the spread holds.
Location & tenants
- Location reads 63/100 on livability (#810 in NY) — a middle-class / working-renter tenant base. Strengths: crime A+, employment A+, housing B+; Watch: amenities F, commute F, cost of living F.
- Bedford Central School District (rural): math 54% / reading 60% proficiency, ranked #211 of 590 in NY (top 36%) — acceptable for families but not a draw, mixed tenant base, ~2y average lease; only 10% free/reduced lunch — higher-income household profile.
- Zoned schools: Pound Ridge Elementary School (math 52% / reading 77%, grade B, #591 of 2,108 statewide, top 31%, 238 students, 10% FRL); Fox Lane Middle School (math 42% / reading 55%, grade C-, #300 of 729 statewide, top 41%, 765 students, 38% FRL); Fox Lane High School (math 97% / reading 82%, grade A+, #265 of 1,100 statewide, top 26%, 1,241 students, 36% FRL) — zoned schools average 28% FRL vs 10% district-wide (17 pts higher); higher-poverty schools than district average — tighter screening recommended.
- Market conditions: 69 active listings in the ZIP; 1 comparable units currently listed for rent nearby; 954 units permitted in Westchester County in 2024 (649 in 5+ unit buildings).
Forward outlook
- In year one you build about $43k of equity ($7k loan paydown + $37k appreciation (3.8% local appreciation)).
- Westchester County population projected at +10% by 2050 — modest demand growth; plan on rents tracking national, not racing it.
- By year 2, paydown + projected appreciation supports a ~$70k cash-out refi (75% LTV) — recoverable capital for the next deal without selling this one.
Negotiation context
- It's been on market 18 days — a 2% lower offer ($946k) is reasonable based on typical stale-listing flexibility.
- 3 sale attempts since 17y ago; this cycle's ask is 44% above the opening price — seller raised mid-cycle; expect resistance to lowballs.
- Current owner paid $800k; 20% above their basis — modest negotiation headroom, anchor on the comps not their cost.
Risks & watch-outs
- Climate carrying-cost: major wind risk, 27% chance of damaging wind over 30y — expect insurance premiums to compound above CPI over the hold.
Questions for the listing agent
- What do current leases actually rent for vs. the listed asking? Can we see a recent rent roll and the last 12 months of T-12 income?
- Built in 1962 — when were the roof, HVAC, electrical panel, plumbing, and water heater last replaced?
- Is there a deadline driving the sale (1031 exchange, divorce, estate, relocation)? That informs how much negotiation room exists.
- The area grade is low — what's the realistic commute time and amenity access for the typical tenant pool here? Any planned neighborhood developments (good or bad) we should know about?
- What's the average days-on-market for RENTAL listings here right now (not sales)? A rising rental-DOM trend means longer vacancies and softer asking-rent achievability than the comps imply.
- What's the recent tenant-quality profile in this submarket — average credit score on applications, eviction rate, late-payment / NSF rate, and stable-employment percentage? A property-management company in the area should have these aggregated.
- How much new for-sale + rental construction is in the pipeline within 1–3 miles? Heavy new supply typically softens prices + rents 12–24 months out; constrained supply supports both.
Investment metrics
- 1% rule
- 0.76% ✗
- Cap rate
- 4.87%
- Cash-on-cash
- -5.09%
- DSCR
- 0.77
- GRM
- 11.0
CMA / ARV
- ARV (on-the-fly)
- $964,512
- Comps found
- 1
Show comp detail 1 sale within ~0.75 mi
| Address | Dist | Beds/Ba | Sqft | Sold | Price | $/sf | Match |
|---|---|---|---|---|---|---|---|
| 32 West Ln | 0.34mi | 4/2.0 | 2,388 (+1%) | 17mo | $975,000 | $408 | 66 |
Match score weights: distance 35% · size 25% · config 20% · recency 20%. Top-matched comps best support the ARV.
Projected returns pro-forma
3.84% appreciation · 3.0% rent growth · sell at horizon
- IRR
- 5.3%
- Equity multiple
- 1.32×
- Total profit
- $86,490
- Equity at exit
- $477,673
- IRR
- 8.1%
- Equity multiple
- 2.33×
- Total profit
- $358,607
- Equity at exit
- $774,130
Cash invested: $268,800 (down + closing). Projections, not guarantees.
Landlord ↔ Tenant lean methodology
- Overall (STATE)
- 15 Strongly Tenant-Friendly
- State New York
- 15 Strongly Tenant-Friendly · D+10
- County
- — inherits STATE
- City
- — inherits STATE
ZIP-level market 10576
- Home prices YoY
- 1.6%
- Active inventory
- 69
- Price-to-rent
- 11.0×
Monthly cashflow live
- Estimated rent
- $7,250 medium interval (Pro) →
- Mortgage (P&I)
- −$5,034
- Tax from tax record
- −$1,434 /mo · $17,209/yr
- Insurance
- −$400
- HOA
- −$0
- Vacancy / Maint / Mgmt
- −$1,522
- Net cashflow
- $-1,141
Break-even live
Sensitivity live
| Price | -10% $-597 | -5% $-869 | +0% $-1,141 | +5% $-1,413 | +10% $-1,684 |
|---|---|---|---|---|---|
| Rent | -10% $-1,714 | -5% $-1,427 | +0% $-1,141 | +5% $-855 | +10% $-568 |
| Rate | -1.0pp $-657 | -0.5pp $-897 | base $-1,141 | +0.5pp $-1,390 | +1.0pp $-1,643 |
UW: 25.0% down · 7.5% · 30yr · 1.5% tax · 5.0% vac · 8.0% maint · 8.0% mgmt
Financing live
Cash to close
- Down payment
- $240,000
- Closing costs
- $28,800
- Reserves months
- —
- Total cash needed
- —
Loan-product check · same deal, 3 products live
Conventional
25% down · 7.5% · 30yr
- Down + closing
- —
- Monthly P&I
- —
- Monthly cashflow
- —
- DSCR
- —
- Eligible?
- —
Personal DTI + credit; lowest rate.
DSCR
20% down · 8.5% · 30yr
- Down + closing
- —
- Monthly P&I
- —
- Monthly cashflow
- —
- DSCR
- —
- Eligible?
- —
No personal income docs; deal must DSCR.
Hard money
10% down · 12.0% · 12mo
- Down + closing
- —
- Monthly P&I
- —
- Monthly cashflow
- —
- DSCR
- —
- Eligible?
- —
Short-term bridge; refi at stabilization.
Rent comps 1 comps
| Address | Beds | Baths | Sqft | Rent | $/sqft | DOM | Units | Dist |
|---|---|---|---|---|---|---|---|---|
| 8 S Bedford Rd Pound Ridge, NY | 3.0 | 3.0 | 1894 | $7,250 | $3.83 | 3d | 1 | 1.00mi |
Listing history 14 events
-
2026-06-21days on market $960,000 Active 18 DOM
-
2026-06-18days on market $960,000 Active 15 DOM
-
2026-06-17days on market $960,000 Active 14 DOM
-
2026-06-16days on market $960,000 Active 13 DOM
-
2026-06-15days on market $960,000 Active 12 DOM
-
2026-06-13days on market $960,000 Active 10 DOM
-
2026-06-13days on market $960,000 Active 9 DOM
-
2026-06-10days on market $960,000 Active 7 DOM
-
2026-06-09days on market $960,000 Active 6 DOM
-
2026-06-08days on market $960,000 Active 5 DOM
-
2026-06-07days on market $960,000 Active 4 DOM
-
2026-06-05status $960,000 Active 1 DOM
-
2026-06-03remarks 699-char remark
-
2026-06-03$960,000 Coming Soon 1 DOM
ⓘ Source: listings_history table (triggers on properties + properties_extension) + one-shot
backfill from property_details.listing_events for pre-trigger history.
Tax reassessment forecast NY · Partial reset (capped growth)
- Current annual tax
- $17,209 · $1,434/mo
- Projected year-2 tax
- $17,209 · $1,434/mo
- Expected delta
- $0/yr ($0/mo · 0.0%)
ⓘ Screening estimate from a state-policy table — verify with the county assessor before closing.
Climate risk First Street
- Flood 1/10 Low FEMA zone X (unshaded) · 0% chance over 30 yrs
- Wildfire 3/10 Moderate
- Heat 4/10 Moderate 7 d/yr ≥99°F today · 16 d/yr by 30 yrs out
- Wind 6/10 Major 27% chance of damaging wind over 30 yrs
- Air quality 4/10 Moderate 4 unhealthy d/yr today · 7 by 30 yrs out
Nearby sold comps map
Loading sold comps map…
Walkable amenities ~0.75 mi
Loading nearby amenities…
Taxation est. · year 1
- Rental income
- $87,000
- − Mortgage interest
- −$53,775
- − Property taxes
- −$17,209
- − Insurance
- −$4,800
- − Repairs & maintenance
- −$6,960
- − Management
- −$6,960
- − Depreciation
- −$27,927
- Taxable loss
- −$30,631
- Est. tax savings @ 24.0%
- +$7,351
- After-tax cash flow
- $-6,339/yr
For passive investors: Depreciation is non-cash, so a rental often shows a tax loss while cash-flowing — sheltering income. Rental losses are passive: they offset passive income freely, and up to $25,000/yr can offset ordinary (W-2) income if you actively participate and your MAGI is under $100k (phasing out to $0 by $150k); unused losses carry forward. On sale, claimed depreciation is recaptured at up to 25%, and gains may owe capital-gains tax (a 1031 exchange can defer both). Figures are a year-1 estimate at your 24.0% rate — not tax advice; consult a CPA.
Schools (NCES district)
- District
- Bedford Central School District
- NCES district ID
- 3619950
- Math proficiency
- 54% ▼ -9.00%
- Reading proficiency
- 60% ▬ 0.00%
- Median HH income
- $98,055
- Composite
- 53.17/100
- National rank
- #1508
- State rank
- #211 of 590 in NY
Livability — Scotts Corners
- Score
- 63/100
- State rank
- #810
- US rank
- #15702
Category grades
Schools grade is shown separately in the Schools card above.
Census & demographics
- Population (ZIP)
- 4,904
Population outlook (Westchester County) Hauer SSP2
- Today (2025)
- 1,028,035 people
- By 2030
- 1,051,636 · +2.3%
- By 2040
- 1,098,520 · +6.9%
- By 2050
- 1,136,044 · +10.5%
- By 2075
- 1,196,925 · +16.4%
- By 2100
- 1,175,147 · +14.3%
Race, ethnicity, and origin ACS 2023
- Neighborhood character
- Predominantly White (90%)
- Race & ethnicity
- White 90% Hispanic / Latino 4% Two or more races 3% Asian 2% Black 1%
- Common ancestry
- Romanian 6% Scotch-Irish 4% Italian 3%
- Foreign-born
- 10% · Canada, China, Jamaica
- Languages at home
- 88% English-only · Other Indo-European 5% Spanish 3% French/Haitian/Cajun 2%
Political lean MEDSL · Westchester
- 2024 margin
- Strong D (+26.3) · D 63.1% · R 36.9%
- 2008→2024 swing
- -1.3pp toward R · 2008: 27.6pp · 2024: 26.3pp
- All cycles
- 2024: D+26.3 2020: D+36.3 2016: D+32.8 2012: D+22.2 2008: D+27.6
Not yet ingested
- Civics
- —
Market trends
- HPI YoY
- ▲ 3.84%
- Current HPI
- 239.5803
- Rent YoY
- —
- Metro
- —
- State GDP YoY
- ▲ 2.60%
- F500 in state
- 92
Industry mix (Fortune 500 HQ in NY)
| Industry | F500 HQs | Revenue |
|---|---|---|
| Financial Services | 10 | $950B |
|
||
| Consumer Goods | 9 | $162B |
|
||
| Insurance | 4 | $225B |
|
||
| Telecommunications | 2 | $144B |
|
||
| Pharmaceuticals | 2 | $112B |
|
||
| Media / Entertainment | 2 | $69B |
|
||
Price history
+213.7% since first listed11 events — show timeline
- 2026-06-02 Coming Soon $960,000 OneKey® MLS as Distributed by MLS Grid
- 2022-03-15 Sold (Public Records) $800,000 Public Records
- 2022-03-04 Sold (MLS) $800,000 OneKey® MLS as Distributed by MLS Grid
- 2021-12-24 Pending — OneKey® MLS as Distributed by MLS Grid
- 2021-12-12 Listing Removed — OneKey® MLS as Distributed by MLS Grid
- 2021-12-03 Relisted — OneKey® MLS as Distributed by MLS Grid
- 2021-10-22 Listing Removed — OneKey® MLS as Distributed by MLS Grid
- 2021-09-14 Listed $665,000 OneKey® MLS as Distributed by MLS Grid
- 2009-08-13 Delisted — HGMLS
- 2009-07-22 Listed — HGMLS
- 1997-10-17 Sold (Public Records) $306,000 Public Records
Property tax history
+11.5%/yrLatest (2025): $17,209 · +7.8% YoY. Source: county tax records.
Cash-flow waterfall
monthlySold comps — $/sqft
last 12 mo · ≤1 miLoading sold comps…