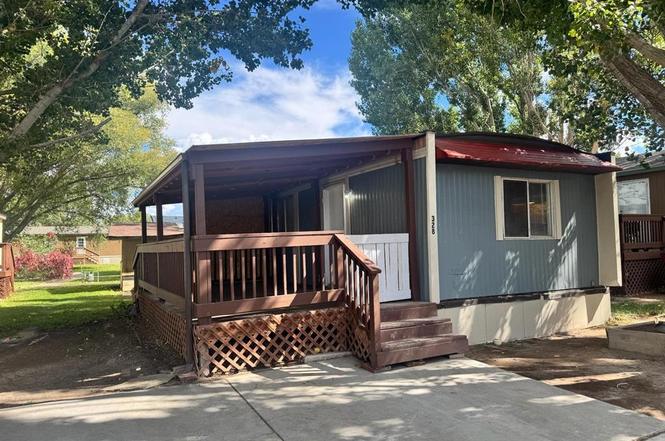
14555 Marine Rd #328 · Montrose, CO
Flood risk 1/10 · Minimal
- FEMA flood zone
- X (unshaded)
- Chance of flooding over 30 yrs
- 0.0%
- Est. flood insurance / yr
- $507 – $1,088
Fire risk 4/10 · Minor
- Est. fire insurance / yr
- $939 – $1,743
Heat risk 4/10 · Minor
- Hot days now (above 91°F)
- 7 days/yr
- Hot days in 30 yrs
- 18 days/yr
Wind risk 1/10 · Minimal
- Chance of severe wind over 30 yrs
- —
Air-quality risk 1/10 · Minimal
- Unhealthy air days now
- 0 days/yr
- Unhealthy air days in 30 yrs
- 0 days/yr
Risk factors via First Street. Map © Google.
Why this score? — see what drove the B- grade
The composite is a weighted blend of 9 inputs, each scored 0–100. Each bar is that input's sub-score; the figure is the points it added to the 100-point composite (weight × sub-score).
- Cash flow +30.0/30.0
- 1% rule +10.0/10.0
- DSCR +10.0/10.0
- ARV discount +7.5/15.0
- Livability +3.4/5.0
- Rent growth +2.5/5.0
- Schools +2.5/10.0
- Condition / age +2.5/5.0
- Appreciation +0.0/10.0
$76,000
🖨 Deal sheet 📄 Offer letter ✓ Due diligence
Listing remarks
Welcome to this well-maintained manufactured home offering comfort, convenience, and affordability in a friendly community setting. Featuring 2 bedrooms and 1 bathroom, this home boasts an open floor plan with a bright living area, a functional kitchen with ample storage, and cozy bedrooms designed for everyday living. Enjoy outdoor living with a covered porch, perfect for relaxing or entertaining. Recent updates include new flooring, paint, cabinets, countertops and more; ensuring move-in readiness and peace of mind. Located in River Meadows, residents benefit from the community playground and the convenience of being near schools, shopping, medical centers, town parks, the river walk, res
Key facts
- Covered porch
- Near schools
- Open floor plan
Tags
Property features AI
Finance
- Other:
- Financial info:
- HOA & community: Homeowners association (Northbrook); Community playground
Exterior
- Parking:
- Security:
- Utilities: Electricity available; Natural gas available; Public water; Public sewer; High-speed internet available; Cable available; Cellular phone reception; Phone available
- Home design: Single-wide mobile home; Single-story
- Construction:
- Exterior features: Shed; Shed(s)
Interior
- Kitchen: Dishwasher; Oven; Range; Refrigerator
- Bedrooms: Primary bedroom on the main level
- Flooring: Vinyl
- Bathrooms: 1 full bathroom
- Heating & cooling: Forced air heating (natural gas); Evaporative cooling
- Interior features: Unfurnished; Main level primary bedroom
- Laundry & utility: Gas water heater
Neighborhood map
What this means for you Summary
Snapshot
- This is a 3-bed/1.0-bath manufactured listed at $76k.
Deal economics
- At list price, monthly cash flow is $462 ($6k/yr) — positive.
- The deal already cash-flows at list — no discount required.
- Meets the 1% rule at list price ($1k rent vs $76k).
- Recommended offer: $67k (12.0% below list) — sets the bar for market timing.
- Cap rate 13.6% vs local median 2.0% in Montrose — top-decile yield for the area; either an underpriced asset or a hidden risk that comps aren't pricing in. Stress-test before assuming the spread holds.
Location & tenants
- Location reads 68/100 on livability (#109 in CO) — a middle-class / working-renter tenant base. Strengths: housing A+; Watch: amenities C-, schools D+, employment D+.
- Montrose County School District Re-1J (town): math 22% / reading 36% proficiency, ranked #55 of 86 in CO (top 64%) — low school quality limits family demand, transient renter base, plan for 1-2y turnover.
- Market conditions: 213 active listings in the ZIP; 271 units permitted in Montrose County in 2024 (22 in 5+ unit buildings).
Forward outlook
- Local home prices are declining (-3.0%/yr); year-one equity from $525 of loan paydown is wiped out by about $2k of value loss. Plan a longer hold.
- Montrose County population projected at -25% by 2050 — secular population decline; favor cash flow + early exit over multi-decade hold.
- At projected returns (-3.0% appreciation + 3.0% rent growth), your $21k cash investment doubles in ~5 years — after that, you're playing with house money.
Negotiation context
- It's been on market 261 days — a 12% lower offer ($67k) is reasonable based on typical stale-listing flexibility.
Questions for the listing agent
- It's been on market 261 days. Have you received any prior offers? Is the seller open to a 12% concession, seller financing, or rate buy-down credit?
- Built in 1976 — when were the roof, HVAC, electrical panel, plumbing, and water heater last replaced?
- Why hasn't it sold? Are there any deal-killer items the seller is aware of (foundation, flood, title, zoning, code violations)?
- Is there a deadline driving the sale (1031 exchange, divorce, estate, relocation)? That informs how much negotiation room exists.
- Schools are D-rated, which usually means shorter tenancies and higher turnover. Who's the typical renter profile here, and what's been the actual vacancy rate?
- What's the average days-on-market for RENTAL listings here right now (not sales)? A rising rental-DOM trend means longer vacancies and softer asking-rent achievability than the comps imply.
- What's the recent tenant-quality profile in this submarket — average credit score on applications, eviction rate, late-payment / NSF rate, and stable-employment percentage? A property-management company in the area should have these aggregated.
- How much new for-sale + rental construction is in the pipeline within 1–3 miles? Heavy new supply typically softens prices + rents 12–24 months out; constrained supply supports both.
Investment metrics
- 1% rule
- 1.64% ✓
- Cap rate
- 13.59%
- Cash-on-cash
- 26.07%
- DSCR
- 2.16
- GRM
- 5.1
CMA / ARV
- ARV (on-the-fly)
- $37,128
- Comps found
- 1
Show comp detail 1 sale within ~0.75 mi
| Address | Dist | Beds/Ba | Sqft | Sold | Price | $/sf | Match |
|---|---|---|---|---|---|---|---|
| 325 W Main St | 0.72mi | 2/1.0 (-1) | 672 (-6%) | 20mo | $35,000 | $52 | 35 |
Match score weights: distance 35% · size 25% · config 20% · recency 20%. Top-matched comps best support the ARV.
Projected returns pro-forma
-3.0% appreciation · 3.0% rent growth · sell at horizon
- IRR
- 19.8%
- Equity multiple
- 1.81×
- Total profit
- $17,151
- Equity at exit
- $11,332
- IRR
- 28.1%
- Equity multiple
- 3.49×
- Total profit
- $52,929
- Equity at exit
- $6,571
Cash invested: $21,280 (down + closing). Projections, not guarantees.
Landlord ↔ Tenant lean methodology
- Overall (STATE)
- 38 Tenant-Leaning
- State Colorado
- 38 Tenant-Leaning · D+4
- County
- — inherits STATE
- City
- — inherits STATE
ZIP-level market 81403
- Active inventory
- 213
- Price-to-rent
- 5.1×
Monthly cashflow live
- Estimated rent
- $1,250 medium interval (Pro) →
- Mortgage (P&I)
- −$399
- Tax est. 1.5%
- −$95 /mo · $1,140/yr
- Insurance
- −$32
- HOA
- −$0
- Vacancy / Maint / Mgmt
- −$263
- Net cashflow
- $462
Break-even live
UW: 25.0% down · 7.5% · 30yr · 1.5% tax · 5.0% vac · 8.0% maint · 8.0% mgmt
Financing live
Cash to close
- Down payment
- $19,000
- Closing costs
- $2,280
- Reserves months
- —
- Total cash needed
- —
Loan-product check · same deal, 3 products live
Conventional
25% down · 7.5% · 30yr
- Down + closing
- —
- Monthly P&I
- —
- Monthly cashflow
- —
- DSCR
- —
- Eligible?
- —
Personal DTI + credit; lowest rate.
DSCR
20% down · 8.5% · 30yr
- Down + closing
- —
- Monthly P&I
- —
- Monthly cashflow
- —
- DSCR
- —
- Eligible?
- —
No personal income docs; deal must DSCR.
Hard money
10% down · 12.0% · 12mo
- Down + closing
- —
- Monthly P&I
- —
- Monthly cashflow
- —
- DSCR
- —
- Eligible?
- —
Short-term bridge; refi at stabilization.
Listing history 16 events
-
2026-06-19days on market $76,000 Active 261 DOM
-
2026-06-18days on market $76,000 Active 260 DOM
-
2026-06-17days on market $76,000 Active 259 DOM
-
2026-06-16days on market $76,000 Active 258 DOM
-
2026-06-15days on market $76,000 Active 257 DOM
-
2026-06-14days on market $76,000 Active 255 DOM
-
2026-06-12days on market $76,000 Active 254 DOM
-
2026-06-09days on market $76,000 Active 251 DOM
-
2026-06-08days on market $76,000 Active 250 DOM
-
2026-06-07days on market $76,000 Active 249 DOM
-
2026-06-02days on market $76,000 Active 244 DOM
-
2026-06-01days on market $76,000 Active 243 DOM
-
2026-05-31days on market $76,000 Active 242 DOM
-
2026-05-30days on market $76,000 Active 241 DOM
-
2025-12-03price $76,000
-
2025-10-01$80,000 Active
ⓘ Source: listings_history table (triggers on properties + properties_extension) + one-shot
backfill from property_details.listing_events for pre-trigger history.
Climate risk First Street
- Flood 1/10 Low FEMA zone X (unshaded) · 0% chance over 30 yrs
- Wildfire 4/10 Moderate
- Heat 4/10 Moderate 7 d/yr ≥91°F today · 18 d/yr by 30 yrs out
- Wind 1/10 Low
- Air quality 1/10 Low 0 unhealthy d/yr today · 0 by 30 yrs out
Nearby sold comps map
Loading sold comps map…
Walkable amenities ~0.75 mi
Loading nearby amenities…
Taxation est. · year 1
- Rental income
- $15,001
- − Mortgage interest
- −$4,257
- − Property taxes
- −$1,140
- − Insurance
- −$380
- − Repairs & maintenance
- −$1,200
- − Management
- −$1,200
- − Depreciation
- −$2,211
- Taxable income
- $4,613
- Est. tax owed @ 24.0%
- −$1,107
- After-tax cash flow
- $4,441/yr
For passive investors: Depreciation is non-cash, so a rental often shows a tax loss while cash-flowing — sheltering income. Rental losses are passive: they offset passive income freely, and up to $25,000/yr can offset ordinary (W-2) income if you actively participate and your MAGI is under $100k (phasing out to $0 by $150k); unused losses carry forward. On sale, claimed depreciation is recaptured at up to 25%, and gains may owe capital-gains tax (a 1031 exchange can defer both). Figures are a year-1 estimate at your 24.0% rate — not tax advice; consult a CPA.
Schools (NCES district)
- District
- Montrose County School District Re-1J
- NCES district ID
- 0805790
- Math proficiency
- 22% ▼ -5.00%
- Reading proficiency
- 36% ▼ -7.00%
- Median HH income
- $45,650
- Composite
- 24.9/100
- National rank
- #7577
- State rank
- #55 of 86 in CO
Livability — Montrose
- Score
- 68/100
- State rank
- #109
- US rank
- #9310
Category grades
Schools grade is shown separately in the Schools card above.
Census & demographics
- City population
- 24,228
- Population (ZIP)
- 11,955
Population outlook (Montrose County) Hauer SSP2
- Today (2025)
- 39,229 people
- By 2030
- 37,791 · -3.7%
- By 2040
- 33,829 · -13.8%
- By 2050
- 29,530 · -24.7%
- By 2075
- 20,559 · -47.6%
- By 2100
- 12,144 · -69.0%
Race, ethnicity, and origin ACS 2023
- Neighborhood character
- Predominantly White (73%)
- Race & ethnicity
- White 73% Hispanic / Latino 22% Two or more races 14% Native American 1%
- Hispanic origin (detail)
- Mexican 16%
- Common ancestry
- Slovak 2% Italian 2% Lithuanian 2%
- Foreign-born
- 7% · Canada
- Languages at home
- 82% English-only · Spanish 17% Tagalog/Filipino 0%
Political lean MEDSL · Montrose
- 2024 margin
- Solid R (+32.6) · D 32.6% · R 65.2% · Other 2.2%
- 2008→2024 swing
- -2.8pp toward R · 2008: -29.8pp · 2024: -32.6pp
- All cycles
- 2024: R+32.6 2020: R+36.5 2016: R+42.1 2012: R+36.4 2008: R+29.8
Not yet ingested
- Civics
- —
Market trends
- HPI YoY
- ▼ -191.12%
- Current HPI
- 349.0781
- Rent YoY
- —
- Metro
- —
- State GDP YoY
- ▲ 1.95%
- F500 in state
- 14
Industry mix (Fortune 500 HQ in CO)
| Industry | F500 HQs | Revenue |
|---|---|---|
| Technology Distribution | 1 | $31B |
|
||
| Food / Agriculture | 1 | $18B |
|
||
| Packaging | 1 | $14B |
|
||
| Healthcare | 1 | $13B |
|
||
| Energy | 1 | $10B |
|
||
| Technology | 1 | $4B |
|
||
Price history
-5.0% since first listed2 events — show timeline
- 2025-12-03 Price Changed $76,000 cren
- 2025-10-01 Listed $80,000 cren
Property tax history
+7.4%/yrLatest (2021): $38 · +10.3% YoY. Source: county tax records.
Cash-flow waterfall
monthlySold comps — $/sqft
last 12 mo · ≤1 miLoading sold comps…