103 Doug Smith Road Rd · St. Regis Falls, NY
Flood risk 1/10 · Minimal
- FEMA flood zone
- X
- Chance of flooding over 30 yrs
- 0.0%
- Est. flood insurance / yr
- $507 – $1,088
Fire risk 3/10 · Minor
- Est. fire insurance / yr
- $691 – $1,283
Heat risk 1/10 · Minimal
- Hot days now (above 90°F)
- 7 days/yr
- Hot days in 30 yrs
- 16 days/yr
Wind risk 1/10 · Minimal
- Chance of severe wind over 30 yrs
- —
Air-quality risk 1/10 · Minimal
- Unhealthy air days now
- 0 days/yr
- Unhealthy air days in 30 yrs
- 0 days/yr
Risk factors via First Street. Map © Google.
Why this score? — see what drove the B grade
The composite is a weighted blend of 9 inputs, each scored 0–100. Each bar is that input's sub-score; the figure is the points it added to the 100-point composite (weight × sub-score).
- Cash flow +27.3/30.0
- Appreciation +10.0/10.0
- DSCR +9.5/10.0
- ARV discount +7.5/15.0
- 1% rule +7.2/10.0
- Schools +3.2/10.0
- Rent growth +2.5/5.0
- Livability +2.5/5.0
- Condition / age +2.5/5.0
$68,000
🖨 Deal sheet 📄 Offer letter ✓ Due diligence
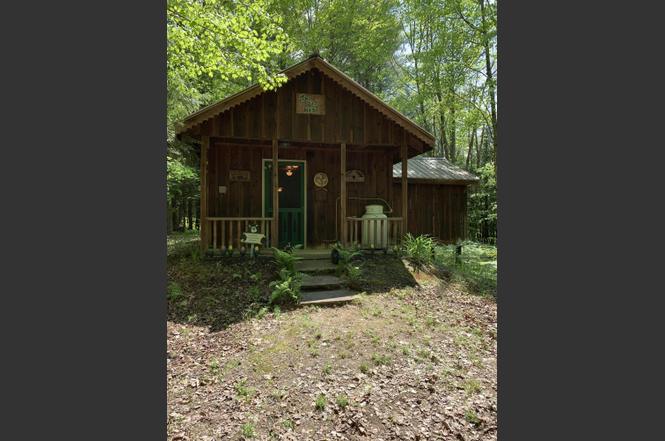
Listing remarks
Charming glamping style cabin retreat on 7 private acres. Wether you are looking for the perfect weekend cottage, hunting retreat, or your next Air B & B opportunity, this cozy getaway is full of Adirondack charm and outdoor adventure. Easily accessible yet peacefully secluded, the property is located near State Land, ATV and side by side trails, and excellent fishing spots. The cabin comes fully furnished and features 100 amp electric service, propane and a simple getaway lifestyle that lets you relax and unplug. A dug well was completed by the original owner and will need some reworking to get the water flowing again. An outhouse is currently in place, adding to to the rustic cabin e
Key facts
- Fishing spots
- 7 acres
- Atv trails
Tags
Property features AI
Finance
- Other: Property is residential, single-family
- Financial info: Annual tax amount available
Exterior
- Utilities: Well and private water (see remarks); Electricity connected with 100 amp service; Propane available; No sewer
- Home design: Cabin; One level
- Construction: Board & batten siding; Pillar/post/pier and slab foundation; Built as a cabin
- Exterior features: Front porch; Wooded lot with many trees; Metal roof; Other outbuildings (see remarks)
Interior
- Kitchen: Free-standing gas range; Microwave
- Bedrooms: 2 total rooms
- Flooring: Concrete flooring; Wood flooring
- Heating & cooling: Wood stove; No air conditioning
- Interior features: Free-standing gas range; Microwave; Other appliances; Concrete and wood flooring; Wood stove heating
- Laundry & utility: No laundry hookups specified
Neighborhood map
What this means for you Summary
Snapshot
- This is a 1-bed/?-bath other listed at $68k.
Deal economics
- At list price, monthly cash flow is $197 ($2k/yr) — positive.
- The deal already cash-flows at list — no discount required.
- Meets the 1% rule at list price ($827 rent vs $68k).
- Recommended offer: $60k (12.0% below list) — sets the bar for market timing.
Location & tenants
- Location reads: area grade B — affects rentability + tenant quality, not the cash-flow math above.
- Saint Regis Falls Central School District (rural): math 35% / reading 35% proficiency, ranked #699 of 755 in NY (top 93%) — families likely to look elsewhere, expect single-tenant / working-renter base with shorter leases.
- Market conditions: 8 active listings in the ZIP; 124 units permitted in Franklin County in 2024 (0 in 5+ unit buildings).
Forward outlook
- In year one you build about $7k of equity ($470 loan paydown + $7k appreciation (10.0% local appreciation)).
- Franklin County population projected at -14% by 2050 — secular population decline; favor cash flow + early exit over multi-decade hold.
- At projected returns (10.0% appreciation + 3.0% rent growth), your $19k cash investment doubles in ~2 years — after that, you're playing with house money.
- By year 5, paydown + projected appreciation supports a ~$34k cash-out refi (75% LTV) — recoverable capital for the next deal without selling this one.
Negotiation context
- It's been on market 372 days — a 12% lower offer ($60k) is reasonable based on typical stale-listing flexibility.
- Current owner paid $15k; list at $68k implies a 353% gain — meaningful room to come down on a strong offer.
Questions for the listing agent
- It's been on market 372 days. Have you received any prior offers? Is the seller open to a 12% concession, seller financing, or rate buy-down credit?
- Why hasn't it sold? Are there any deal-killer items the seller is aware of (foundation, flood, title, zoning, code violations)?
- Is there a deadline driving the sale (1031 exchange, divorce, estate, relocation)? That informs how much negotiation room exists.
- What's the average days-on-market for RENTAL listings here right now (not sales)? A rising rental-DOM trend means longer vacancies and softer asking-rent achievability than the comps imply.
- What's the recent tenant-quality profile in this submarket — average credit score on applications, eviction rate, late-payment / NSF rate, and stable-employment percentage? A property-management company in the area should have these aggregated.
- How much new for-sale + rental construction is in the pipeline within 1–3 miles? Heavy new supply typically softens prices + rents 12–24 months out; constrained supply supports both.
Investment metrics
- 1% rule
- 1.22% ✓
- Cap rate
- 9.76%
- Cash-on-cash
- 12.39%
- DSCR
- 1.55
- GRM
- 6.9
CMA / ARV
No comps found within radius.
Projected returns pro-forma
10.0% appreciation · 3.0% rent growth · sell at horizon
- IRR
- 33.4%
- Equity multiple
- 3.60×
- Total profit
- $49,565
- Equity at exit
- $61,260
- IRR
- 28.8%
- Equity multiple
- 8.15×
- Total profit
- $136,118
- Equity at exit
- $132,109
Cash invested: $19,040 (down + closing). Projections, not guarantees.
Landlord ↔ Tenant lean methodology
- Overall (STATE)
- 15 Strongly Tenant-Friendly
- State New York
- 15 Strongly Tenant-Friendly · D+10
- County
- — inherits STATE
- City
- — inherits STATE
ZIP-level market 12930
- Home prices YoY
- 3.7%
- Active inventory
- 8
- Price-to-rent
- 6.9×
Monthly cashflow live
- Estimated rent
- $827 medium interval (Pro) →
- Mortgage (P&I)
- −$357
- Tax from tax record
- −$72 /mo · $859/yr
- Insurance
- −$28
- HOA
- −$0
- Vacancy / Maint / Mgmt
- −$174
- Net cashflow
- $197
Break-even live
UW: 25.0% down · 7.5% · 30yr · 1.5% tax · 5.0% vac · 8.0% maint · 8.0% mgmt
Financing live
Cash to close
- Down payment
- $17,000
- Closing costs
- $2,040
- Reserves months
- —
- Total cash needed
- —
Loan-product check · same deal, 3 products live
Conventional
25% down · 7.5% · 30yr
- Down + closing
- —
- Monthly P&I
- —
- Monthly cashflow
- —
- DSCR
- —
- Eligible?
- —
Personal DTI + credit; lowest rate.
DSCR
20% down · 8.5% · 30yr
- Down + closing
- —
- Monthly P&I
- —
- Monthly cashflow
- —
- DSCR
- —
- Eligible?
- —
No personal income docs; deal must DSCR.
Hard money
10% down · 12.0% · 12mo
- Down + closing
- —
- Monthly P&I
- —
- Monthly cashflow
- —
- DSCR
- —
- Eligible?
- —
Short-term bridge; refi at stabilization.
Listing history 18 events
-
2026-06-18days on market $68,000 Active 372 DOM
-
2026-06-17days on market $68,000 Active 371 DOM
-
2026-06-16days on market $68,000 Active 370 DOM
-
2026-06-15days on market $68,000 Active 369 DOM
-
2026-06-13days on market $68,000 Active 367 DOM
-
2026-06-12days on market $68,000 Active 366 DOM
-
2026-06-09days on market $68,000 Active 363 DOM
-
2026-06-08days on market $68,000 Active 362 DOM
-
2026-06-07days on market $68,000 Active 361 DOM
-
2026-06-07days on market $68,000 Active 360 DOM
-
2026-06-04days on market $68,000 Active 357 DOM
-
2026-06-02days on market $68,000 Active 356 DOM
-
2026-06-01days on market $68,000 Active 355 DOM
-
2026-05-31days on market $68,000 Active 354 DOM
-
2026-04-07price $71,900
-
2025-08-21price $74,500
-
2025-06-11$79,000 Active
-
2005-05-05soldstatus $15,000
ⓘ Source: listings_history table (triggers on properties + properties_extension) + one-shot
backfill from property_details.listing_events for pre-trigger history.
Tax reassessment forecast NY · Partial reset (capped growth)
- Current annual tax
- $859 · $72/mo
- Projected year-2 tax
- $1,004 · $84/mo
- Expected delta
- +$145/yr (+$12/mo · 16.9%)
ⓘ Screening estimate from a state-policy table — verify with the county assessor before closing.
Climate risk First Street
- Flood 1/10 Low FEMA zone X · 0% chance over 30 yrs
- Wildfire 3/10 Moderate
- Heat 1/10 Low 7 d/yr ≥90°F today · 16 d/yr by 30 yrs out
- Wind 1/10 Low
- Air quality 1/10 Low 0 unhealthy d/yr today · 0 by 30 yrs out
Nearby sold comps map
Loading sold comps map…
Walkable amenities ~0.75 mi
Loading nearby amenities…
Taxation est. · year 1
- Rental income
- $9,922
- − Mortgage interest
- −$3,809
- − Property taxes
- −$859
- − Insurance
- −$340
- − Repairs & maintenance
- −$794
- − Management
- −$794
- − Depreciation
- −$1,978
- Taxable income
- $1,348
- Est. tax owed @ 24.0%
- −$324
- After-tax cash flow
- $2,036/yr
For passive investors: Depreciation is non-cash, so a rental often shows a tax loss while cash-flowing — sheltering income. Rental losses are passive: they offset passive income freely, and up to $25,000/yr can offset ordinary (W-2) income if you actively participate and your MAGI is under $100k (phasing out to $0 by $150k); unused losses carry forward. On sale, claimed depreciation is recaptured at up to 25%, and gains may owe capital-gains tax (a 1031 exchange can defer both). Figures are a year-1 estimate at your 24.0% rate — not tax advice; consult a CPA.
Schools (NCES district)
- District
- Saint Regis Falls Central School District
- NCES district ID
- 3627990
- Math proficiency
- 35% ▼ -5.00%
- Reading proficiency
- 35% ▬ 0.00%
- Median HH income
- $41,831
- Composite
- 32.2/100
- National rank
- #10964
- State rank
- #699 of 755 in NY
Livability — St. Regis Falls
No livability data for this city. (Only ~50 U.S. cities are tracked.)
Census & demographics
- Population (ZIP)
- 866
Population outlook (Franklin County) Hauer SSP2
- Today (2025)
- 48,098 people
- By 2030
- 46,790 · -2.7%
- By 2040
- 44,400 · -7.7%
- By 2050
- 41,256 · -14.2%
- By 2075
- 32,190 · -33.1%
- By 2100
- 23,407 · -51.3%
Race, ethnicity, and origin ACS 2023
- Neighborhood character
- Predominantly White (90%)
- Race & ethnicity
- White 90% Two or more races 8% Hispanic / Latino 3% Native American 1%
- Common ancestry
- Lithuanian 10% Italian 4% Slovak 2%
- Foreign-born
- 2% · Canada, China
- Languages at home
- 97% English-only · German/W. Germanic 3%
Political lean MEDSL · Franklin
- 2024 margin
- Lean R (+9.0) · D 45.5% · R 54.5%
- 2008→2024 swing
- -31.2pp toward R · 2008: 22.2pp · 2024: -9.0pp
- All cycles
- 2024: R+9.0 2020: R+2.2 2016: R+7.4 2012: D+26.3 2008: D+22.2
Not yet ingested
- Civics
- —
Market trends
- HPI YoY
- ▲ 17.45%
- Current HPI
- 483.7564
- Rent YoY
- —
- Metro
- —
- State GDP YoY
- ▲ 2.60%
- F500 in state
- 92
Industry mix (Fortune 500 HQ in NY)
| Industry | F500 HQs | Revenue |
|---|---|---|
| Financial Services | 10 | $950B |
|
||
| Consumer Goods | 9 | $162B |
|
||
| Insurance | 4 | $225B |
|
||
| Telecommunications | 2 | $144B |
|
||
| Pharmaceuticals | 2 | $112B |
|
||
| Media / Entertainment | 2 | $69B |
|
||
Price history
+379.3% since first listed4 events — show timeline
- 2026-04-07 Price Changed $71,900 ACVMLS
- 2025-08-21 Price Changed $74,500 ACVMLS
- 2025-06-11 Listed $79,000 ACVMLS
- 2005-05-05 Sold (Public Records) $15,000 Public Records
Property tax history
+2.0%/yrLatest (2025): $859 · +6.2% YoY. Source: county tax records.
Cash-flow waterfall
monthlySold comps — $/sqft
last 12 mo · ≤1 miLoading sold comps…