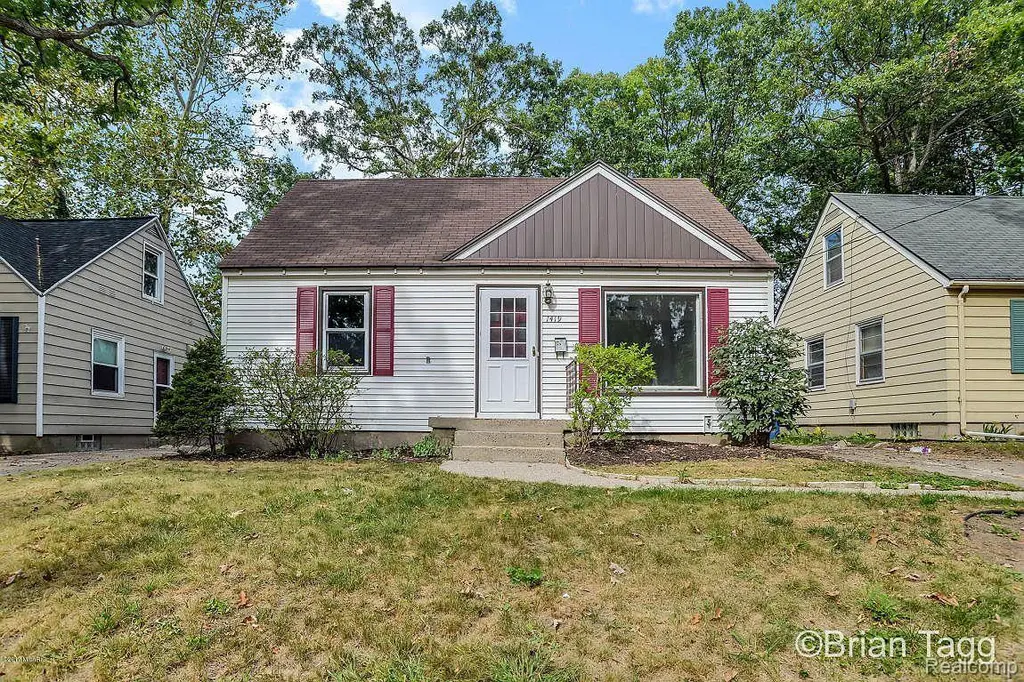
1419 Linwood St SE · Grand Rapids, MI
Flood risk 1/10 · Minimal
- FEMA flood zone
- X (unshaded)
- Chance of flooding over 30 yrs
- 0.0%
- Est. flood insurance / yr
- $473 – $860
Fire risk 1/10 · Minimal
- Est. fire insurance / yr
- $784 – $1,456
Heat risk 2/10 · Minimal
- Hot days now (above 96°F)
- 7 days/yr
- Hot days in 30 yrs
- 16 days/yr
Wind risk 2/10 · Minimal
- Chance of severe wind over 30 yrs
- —
Air-quality risk 2/10 · Minimal
- Unhealthy air days now
- 2 days/yr
- Unhealthy air days in 30 yrs
- 2 days/yr
Risk factors via First Street. Map © Google.
Why this score? — see what drove the D- grade
The composite is a weighted blend of 9 inputs, each scored 0–100. Each bar is that input's sub-score; the figure is the points it added to the 100-point composite (weight × sub-score).
- Cash flow +11.5/30.0
- ARV discount +7.5/15.0
- Livability +4.2/5.0
- Rent growth +3.7/5.0
- DSCR +3.4/10.0
- 1% rule +2.7/10.0
- Condition / age +2.5/5.0
- Schools +1.9/10.0
- Appreciation +0.0/10.0
$199,900
🖨 Deal sheet (PDF) 📄 Offer letter ✓ Due diligence
Listing remarks MLS
Alger Heights Bungalow on a quiet street close to shopping , resturants , bus lines and down town Grand Rapid . This home is Move in ready with brand new high energy efficent windows through out , new furnace , updated electrical , new stainless appliances , counter top , tiled back splash , Completely repainted and new flooring through out .
Key facts
- 5,663 sq ft lot
- Garage
- Built 1950
Property features AI
Exterior
- Parking: Detached 1-car garage
- Utilities: Public water available; Public sewer available
- Home design: Single-family residence; One-and-a-half story; Ground-level entry with steps; Vinyl siding
- Construction: Vinyl siding construction
- Exterior features: Paved road access; Lot roughly 43 x 133 (0.13 acres); No pool
Interior
- Bathrooms: 1 full bathroom
- Heating & cooling: Forced air heating (natural gas); No central air
- Interior features: Full, unfinished basement; Total of 5 rooms
Neighborhood map
What this means for you Summary
Snapshot
- This is a 3-bed/1.0-bath single-family listed at $200k.
Deal economics
- At list price, monthly cash flow is $-65 ($-779/yr) — negative.
- To cash-flow at today's rent, offer at most $188k (5.7% below list).
- To meet the 1% rule (rent ≥ 1% of price), the offer needs to be $155k (22.5% below list).
- Recommended offer: $155k (22.5% below list) — sets the bar for 1% rule.
- Cap rate 5.9% vs local median 4.5% in Grand Rapids — top-decile yield for the area; either an underpriced asset or a hidden risk that comps aren't pricing in. Stress-test before assuming the spread holds.
Location & tenants
- Location reads 83/100 on livability (#44 in MI, #939 nationally) — a professional / high-income tenant draw. Strengths: amenities A+, commute A+, cost of living A+; Watch: employment C-, crime F.
- Grand Rapids Public Schools (urban): math 15% / reading 29% proficiency, ranked #451 of 540 in MI (top 84%) — low school quality limits family demand, transient renter base, plan for 1-2y turnover; 80% free/reduced lunch — lower-income household profile, screen leases tightly.
- Zoned schools: Mulick Park Elementary School (math 15% / reading 24%, grade F, #1,091 of 1,397 statewide, top 79%, 244 students, 89% FRL); Alger Middle School (math 2% / reading 12%, grade F, #481 of 493 statewide, top 98%, 342 students, 95% FRL); City Middlehigh (math 65% / reading 88%, grade A-, #16 of 713 statewide, top 2%, 908 students, 40% FRL).
- Zoned-school proficiency averages 34% at this address vs 22% district-wide (+12 pts) — the actual schools serving this property are materially stronger than the Grand Rapids Public Schools average implies; a family-tenant draw the district grade alone would hide.
- Market conditions: Rents rising fast (+4.7%/yr); 178 active listings in the ZIP; 13 comparable units currently listed for rent nearby; rentals lingering (median 46d on market — plan ~5-8 weeks vacancy on turnover, expect pricing pressure); 77% of comp listings sitting > 30 days — soft ceiling on asking rent; 2,253 units permitted in Kent County in 2024 (969 in 5+ unit buildings).
- This rent runs 30% of the median local income ($61k/yr) — at the standard rent-burdened threshold; future hikes will face affordability resistance.
Forward outlook
- Local home prices are declining (-3.0%/yr); year-one equity from $1k of loan paydown is wiped out by about $6k of value loss. Plan a longer hold.
- Kent County population projected at +22% by 2050 — long-run rental-demand tailwind backs the buy-and-hold thesis.
Negotiation context
- Only 4 days on market — expect competitive offers; lowballing is unlikely to land.
- 8 sale attempts since 28y ago with the ask held roughly flat each time — persistent listings suggest the price (not the market) is what's stuck; bring a comps-based counter.
Risks & watch-outs
- Watch-outs: built in 1950 — expect roof / HVAC / electrical / plumbing capex.
Questions for the listing agent
- What do current leases actually rent for vs. the listed asking? Can we see a recent rent roll and the last 12 months of T-12 income?
- Built in 1950 — when were the roof, HVAC, electrical panel, plumbing, and water heater last replaced?
- Is there a deadline driving the sale (1031 exchange, divorce, estate, relocation)? That informs how much negotiation room exists.
- Crime grade is F in this area — have there been break-ins, vandalism, or insurance claims at this property in the last 3 years? What carrier currently insures it and at what premium?
- The area grade is low — what's the realistic commute time and amenity access for the typical tenant pool here? Any planned neighborhood developments (good or bad) we should know about?
- What's the average days-on-market for RENTAL listings here right now (not sales)? A rising rental-DOM trend means longer vacancies and softer asking-rent achievability than the comps imply.
- What's the recent tenant-quality profile in this submarket — average credit score on applications, eviction rate, late-payment / NSF rate, and stable-employment percentage? A property-management company in the area should have these aggregated.
- How much new for-sale + rental construction is in the pipeline within 1–3 miles? Heavy new supply typically softens prices + rents 12–24 months out; constrained supply supports both.
Investment metrics
- 1% rule
- 0.77% ✗
- Cap rate
- 5.90%
- Cash-on-cash
- -1.39%
- DSCR
- 0.94
- GRM
- 10.8
CMA / ARV
No comps found within radius.
Projected returns pro-forma
-3.0% appreciation · 4.74% rent growth · sell at horizon
- IRR
- -16.8%
- Equity multiple
- 0.40×
- Total profit
- $-33,802
- Equity at exit
- $29,806
- IRR
- -6.0%
- Equity multiple
- 0.59×
- Total profit
- $-23,167
- Equity at exit
- $17,284
Cash invested: $55,972 (down + closing). Projections, not guarantees.
Landlord ↔ Tenant lean methodology
- Overall (STATE)
- 62 Landlord-Friendly
- State Michigan
- 62 Landlord-Friendly · EVEN
- County
- — inherits STATE
- City
- — inherits STATE
ZIP-level market 49507
- Rents YoY
- 4.7%
- Active inventory
- 178
- Price-to-rent
- 10.8×
Monthly cashflow live
- Estimated rent
- $1,549 high interval (Pro) →
- Mortgage (P&I)
- −$1,048
- Tax from tax record
- −$157 /mo · $1,882/yr
- Insurance
- −$83
- HOA
- −$0
- Vacancy / Maint / Mgmt
- −$325
- Net cashflow
- $-65
Break-even live
Sensitivity live
| Price | -10% $48 | -5% $-8 | +0% $-65 | +5% $-121 | +10% $-178 |
|---|---|---|---|---|---|
| Rent | -10% $-187 | -5% $-126 | +0% $-65 | +5% $-4 | +10% $57 |
| Rate | -1.0pp $36 | -0.5pp $-14 | base $-65 | +0.5pp $-117 | +1.0pp $-169 |
UW: 25.0% down · 7.5% · 30yr · 1.5% tax · 5.0% vac · 8.0% maint · 8.0% mgmt
Financing live
Cash to close
- Down payment
- $49,975
- Closing costs
- $5,997
- Reserves months
- —
- Total cash needed
- —
Loan-product check · same deal, 3 products live
Conventional
25% down · 7.5% · 30yr
- Down + closing
- —
- Monthly P&I
- —
- Monthly cashflow
- —
- DSCR
- —
- Eligible?
- —
Personal DTI + credit; lowest rate.
DSCR
20% down · 8.5% · 30yr
- Down + closing
- —
- Monthly P&I
- —
- Monthly cashflow
- —
- DSCR
- —
- Eligible?
- —
No personal income docs; deal must DSCR.
Hard money
10% down · 12.0% · 12mo
- Down + closing
- —
- Monthly P&I
- —
- Monthly cashflow
- —
- DSCR
- —
- Eligible?
- —
Short-term bridge; refi at stabilization.
Rent comps 13 comps
| Address | Beds | Baths | Sqft | Rent | $/sqft | DOM | Units | Dist |
|---|---|---|---|---|---|---|---|---|
| 1220 Ottillia St SE Unit D Grand Rapids, MI | 2.0 | 1.0 | 750 | $1,150 | $1.53 | 46d | 1 | 0.19mi |
| 950 Merritt St SE Grand Rapids, MI | 3.0 | 1.0 | 1000 | $2,100 | $2.10 | 46d | 1 | 0.54mi |
| 1057 Griggs St SE Grand Rapids, MI | 2.0 | 1.0 | 1100 | $1,550 | $1.41 | 46d | 1 | 0.65mi |
| 1966 Burton St SE Unit IVA24 Grand Rapids, MI | 2.0 | 1.5 | 860 | $1,450 | $1.69 | 46d | 1 | 0.71mi |
| 1966 Burton St SE Unit IVA33 Grand Rapids, MI | 2.0 | 1.5 | 860 | $1,350 | $1.57 | 46d | 1 | 0.71mi |
| 1960 Burton St SE Grand Rapids, MI | 1.0–2.0 | 1.0–1.5 | 760 | $1,450 | $1.91 | 4d | 3 | 0.73mi |
| 1970 Burton St SE Unit IVA40 Grand Rapids, MI | 2.0 | 1.0 | 800 | $1,100 | $1.38 | 46d | 1 | 0.73mi |
| 1970 Burton St SE Unit IVA38 Grand Rapids, MI | 2.0 | 1.0 | 800 | $1,450 | $1.81 | 46d | 1 | 0.73mi |
| 1555 Margaret Ave SE Grand Rapids, MI | 2.0 | 1.0 | 900 | $1,500 | $1.67 | 16d | 1 | 0.75mi |
| 2928 Vineland Ave SE Unit 2928 Grand Rapids, MI | 2.0 | 1.0 | 1000 | $1,450 | $1.45 | 25d | 1 | 0.96mi |
| 459 Dickinson St SE Grand Rapids, MI | 2.0 | 1.0 | 731 | $1,195 | $1.63 | 46d | 1 | 1.32mi |
| 3202 Marshall Ave SE Grand Rapids, MI | 2.0 | 1.0 | 850 | $1,095 | $1.29 | 46d | 1 | 1.40mi |
| 2551 Burton St SE Grand Rapids, MI | 2.0 | 1.0 | 1000 | $1,645 | $1.65 | 46d | 1 | 1.45mi |
Listing history 20 events
-
2026-04-29soldstatus $195,000
-
2026-04-13status Pending
-
2026-04-13status Pending
-
2026-04-09$199,900 Active
-
2026-04-09$199,900 Active
-
2017-12-18soldstatus $129,900
-
2017-11-30soldstatus $129,900 345-char remark
Show marketing remark (345 chars)
Alger Heights Bungalow on a quiet street close to shopping , resturants , bus lines and down town Grand Rapid . This home is Move in ready with brand new high energy efficent windows through out , new furnace , updated electrical , new stainless appliances , counter top , tiled back splash , Completely repainted and new flooring through out .
-
2017-11-30soldstatus $129,900 Sold
Show marketing remark (345 chars)
Alger Heights Bungalow on a quiet street close to shopping , resturants , bus lines and down town Grand Rapid . This home is Move in ready with brand new high energy efficent windows through out , new furnace , updated electrical , new stainless appliances , counter top , tiled back splash , Completely repainted and new flooring through out .
-
2017-10-31status Pending
-
2017-10-27price $124,900
-
2017-10-16status Active
-
2017-10-06status Pending
-
2017-10-02status Active
-
2017-09-30status Pending
-
2017-09-28$128,500 Active
Show marketing remark (345 chars)
Alger Heights Bungalow on a quiet street close to shopping , resturants , bus lines and down town Grand Rapid . This home is Move in ready with brand new high energy efficent windows through out , new furnace , updated electrical , new stainless appliances , counter top , tiled back splash , Completely repainted and new flooring through out .
-
2017-09-28$124,900 345-char remark
Show marketing remark (345 chars)
Alger Heights Bungalow on a quiet street close to shopping , resturants , bus lines and down town Grand Rapid . This home is Move in ready with brand new high energy efficent windows through out , new furnace , updated electrical , new stainless appliances , counter top , tiled back splash , Completely repainted and new flooring through out .
-
1998-06-26soldstatus $76,000
-
1998-06-26soldstatus $76,000
-
1998-05-23$78,900
-
1998-05-23$78,900
ⓘ Source: listings_history table (triggers on properties + properties_extension) + one-shot
backfill from property_details.listing_events for pre-trigger history.
Tax reassessment forecast MI · Partial reset (capped growth)
- Current annual tax
- $1,882 · $157/mo
- Projected year-2 tax
- $2,480 · $207/mo
- Expected delta
- +$598/yr (+$50/mo · 31.8%)
ⓘ Screening estimate from a state-policy table — verify with the county assessor before closing.
Climate risk First Street
- Flood 1/10 Low FEMA zone X (unshaded) · 0% chance over 30 yrs
- Wildfire 1/10 Low
- Heat 2/10 Low 7 d/yr ≥96°F today · 16 d/yr by 30 yrs out
- Wind 2/10 Low
- Air quality 2/10 Low 2 unhealthy d/yr today · 2 by 30 yrs out
Nearby sold comps map
Loading sold comps map…
Walkable amenities ~0.75 mi
Loading nearby amenities…
Taxation est. · year 1
- Rental income
- $18,585
- − Mortgage interest
- −$11,198
- − Property taxes
- −$1,882
- − Insurance
- −$1,000
- − Repairs & maintenance
- −$1,487
- − Management
- −$1,487
- − Depreciation
- −$5,815
- Taxable loss
- −$4,283
- Est. tax savings @ 24.0%
- +$1,028
- After-tax cash flow
- $249/yr
For passive investors: Depreciation is non-cash, so a rental often shows a tax loss while cash-flowing — sheltering income. Rental losses are passive: they offset passive income freely, and up to $25,000/yr can offset ordinary (W-2) income if you actively participate and your MAGI is under $100k (phasing out to $0 by $150k); unused losses carry forward. On sale, claimed depreciation is recaptured at up to 25%, and gains may owe capital-gains tax (a 1031 exchange can defer both). Figures are a year-1 estimate at your 24.0% rate — not tax advice; consult a CPA.
Schools (NCES district)
- District
- Grand Rapids Public Schools
- NCES district ID
- 2616440
- Math proficiency
- 15% ▼ -5.00%
- Reading proficiency
- 29% ▼ -1.00%
- Median HH income
- $40,612
- Composite
- 18.62/100
- National rank
- #8899
- State rank
- #451 of 540 in MI
Livability — Grand Rapids
- Score
- 83/100
- State rank
- #44
- US rank
- #939
Category grades
Schools grade is shown separately in the Schools card above.
Census & demographics
- Census place
- Grand Rapids, MI
- County
- Kent County · 533,805 people
- City population
- 181,325
- Metro
- Grand Rapids-Kentwood, MI
- Population (ZIP)
- 38,487
- Household income
- $61,461
- Rent vs Own
- Severe rent burden
- 1625.0
Population outlook (Kent County) Hauer SSP2
- Today (2025)
- 712,484 people
- By 2030
- 748,618 · +5.1%
- By 2040
- 814,777 · +14.4%
- By 2050
- 868,556 · +21.9%
- By 2075
- 966,487 · +35.7%
- By 2100
- 967,975 · +35.9%
Race, ethnicity, and origin ACS 2023
- Neighborhood character
- Highly diverse neighborhood (Simpson 0.71)
- Race & ethnicity
- Hispanic / Latino 31% Black 31% White 30% Two or more races 21%
- Hispanic origin (detail)
- Mexican 18% Puerto Rican 3% Dominican 1%
- Common ancestry
- Iranian 8% Romanian 2% Lithuanian 1%
- Foreign-born
- 18% · Canada
- Languages at home
- 71% English-only · Spanish 23% Arabic 1% Other Indo-European 1%
Political lean MEDSL · Kent
- 2024 margin
- Lean D (+5.4) · D 51.8% · R 46.5% · Other 1.7%
- 2008→2024 swing
- +4.8pp toward D · 2008: 0.5pp · 2024: 5.4pp
- All cycles
- 2024: D+5.4 2020: D+6.1 2016: R+3.1 2012: R+7.9 2008: D+0.5
Not yet ingested
- Civics
- —
Market trends
- HPI YoY
- ▼ -301.99%
- Current HPI
- 325.3878
- Rent YoY
- ▲ 4.74%
- Metro
- Grand Rapids-Kentwood, MI
- State GDP YoY
- ▲ 1.37%
- F500 in state
- 28
Industry mix (Fortune 500 HQ in MI)
| Industry | F500 HQs | Revenue |
|---|---|---|
| Automotive Parts | 3 | $48B |
|
||
| Automotive | 2 | $372B |
|
||
| Chemicals | 1 | $45B |
|
||
| Automotive Retail | 1 | $29B |
|
||
| Healthcare / Medical Devices | 1 | $23B |
|
||
| Automotive Technology | 1 | $20B |
|
||
Price history
+147.1% since first listed20 events — show timeline
- 2026-04-29 Sold (Public Records) $195,000 Public Records
- 2026-04-13 Pending — MiRealSource-MiMLS
- 2026-04-13 Pending — REALCOMP
- 2026-04-09 Listed $199,900 REALCOMP
- 2026-04-09 Listed $199,900 MiRealSource-MiMLS
- 2017-12-18 Sold (Public Records) $129,900 Public Records
- 2017-11-30 Sold (MLS) $129,900 SW Michigan MLS
- 2017-11-30 Sold (MLS) $129,900 REALCOMP
- 2017-10-31 Pending — SW Michigan MLS
- 2017-10-27 Price Changed $124,900 SW Michigan MLS
- 2017-10-16 Relisted — SW Michigan MLS
- 2017-10-06 Pending — SW Michigan MLS
- 2017-10-02 Relisted — SW Michigan MLS
- 2017-09-30 Pending — SW Michigan MLS
- 2017-09-28 Listed $128,500 SW Michigan MLS
- 2017-09-28 Listed $124,900 REALCOMP
- 1998-06-26 Sold (MLS) $76,000 REALCOMP
- 1998-06-26 Sold (MLS) $76,000 SW Michigan MLS
- 1998-05-23 Listed $78,900 REALCOMP
- 1998-05-23 Listed $78,900 SW Michigan MLS
Property tax history
+5.1%/yrLatest (2025): $1,882 · -3.6% YoY. Source: county tax records.
Cash-flow waterfall
monthlySold comps — $/sqft
last 12 mo · ≤1 miLoading sold comps…