3667 Madrid Dr N · Augusta-Richmond County consolidated government (balance), GA
Flood risk 1/10 · Minimal
- FEMA flood zone
- X (unshaded)
- Chance of flooding over 30 yrs
- 0.0%
- Est. flood insurance / yr
- $507 – $1,088
Fire risk 4/10 · Minor
- Est. fire insurance / yr
- $963 – $1,789
Heat risk 7/10 · Major
- Hot days now (above 106°F)
- 7 days/yr
- Hot days in 30 yrs
- 17 days/yr
Wind risk 6/10 · Moderate
- Chance of severe wind over 30 yrs
- 65.0%
Air-quality risk 3/10 · Minor
- Unhealthy air days now
- 3 days/yr
- Unhealthy air days in 30 yrs
- 3 days/yr
Risk factors via First Street. Map © Google.
Why this score? — see what drove the C grade
The composite is a weighted blend of 9 inputs, each scored 0–100. Each bar is that input's sub-score; the figure is the points it added to the 100-point composite (weight × sub-score).
- Cash flow +21.9/30.0
- ARV discount +15.0/15.0
- DSCR +7.0/10.0
- 1% rule +4.6/10.0
- Livability +2.5/5.0
- Condition / age +2.5/5.0
- Rent growth +2.4/5.0
- Schools +1.3/10.0
- Appreciation +0.0/10.0
$205,000
🖨 Deal sheet 📄 Offer letter ✓ Due diligence
Listing remarks
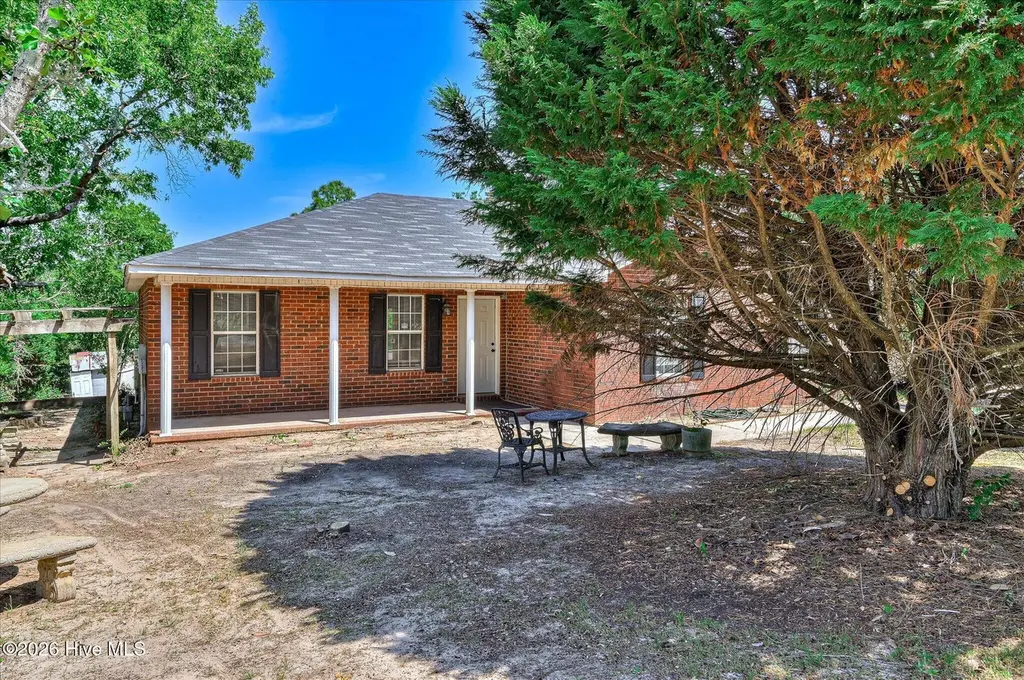
Come home to this charming 4-bedroom, 2-bath home on a little over half an acre with mature trees, a spacious yard, and plenty of room for gardening, outdoor entertaining, or future improvements. This home offers a functional layout with a cozy fireplace, welcoming living room, and a separate den perfect for family gatherings or an office. The eat-in kitchen provides a comfortable gathering area with great potential for updates and customization. The primary suite is equipped with a charming tray ceiling and relaxing natural light. The other 3 bedrooms and full bath are located on the opposite side of the home giving you complete privacy. Being less than 2 miles from Ft. Gordon's Gate 1 and
Key facts
- Spacious yard
- Tray ceiling
- Outdoor entertaining
Tags
Property features AI
Exterior
- Parking: Off-street parking; Driveway
- Utilities: Public water; Public sewer; Cable available; Water service available
- Home design: Single-family residence; One story; Entry level: 1
- Construction: Brick construction; Shingle roof; Slab foundation; Built on one level
- Exterior features: Front porch; Back yard fencing; Has view
Interior
- Kitchen: Electric oven
- Bedrooms: Total rooms: 7
- Bathrooms: 2 full bathrooms
- Heating & cooling: Forced air heating (natural gas); Central air; Ceiling fans
- Interior features: Ceiling fans; Window coverings; Electric oven
- Laundry & utility: Washer hookup; Laundry closet
Neighborhood map
What this means for you Summary
Snapshot
- This is a 4-bed/2.0-bath single-family listed at $205k.
Deal economics
- At list price, monthly cash flow is $323 ($4k/yr) — positive.
- The deal already cash-flows at list — no discount required.
- To meet the 1% rule (rent ≥ 1% of price), the offer needs to be $198k (3.6% below list).
- Recommended offer: $198k (3.6% below list) — sets the bar for 1% rule.
- Cap rate 8.2% vs local median 5.3% in Augusta-Richmond County consolidated government (balance) — top-decile yield for the area; either an underpriced asset or a hidden risk that comps aren't pricing in. Stress-test before assuming the spread holds.
Location & tenants
- Location reads: area grade C — affects rentability + tenant quality, not the cash-flow math above.
- Richmond County (urban): math 12% / reading 20% proficiency, ranked #154 of 174 in GA (top 88%) — low school quality limits family demand, transient renter base, plan for 1-2y turnover; 72% free/reduced lunch — lower-income household profile, screen leases tightly.
- Zoned schools: Glenn Hills Middle School (math 2% / reading 6%, grade F, #467 of 470 statewide, top 99%, 762 students, 98% FRL); Glenn Hills High School (math 2% / reading 2%, grade F, #421 of 424 statewide, top 100%, 883 students, 98% FRL) — zoned schools average 98% FRL vs 72% district-wide (26 pts higher); higher-poverty schools than district average — tighter screening recommended.
- Zoned-school proficiency averages 3% at this address vs 16% district-wide (-13 pts) — the specific schools serving this property underperform the Richmond County average; the district grade overstates school quality for this exact location.
- Market conditions: Rents soft (-0.2%/yr); 364 active listings in the ZIP; 7 comparable units currently listed for rent nearby; rentals at typical pace (median 14d on market — plan ~3-4 weeks tenant-placement turnaround); 561 units permitted in Richmond County in 2024 (0 in 5+ unit buildings).
- At $1,976/mo this rent would consume 52% of the median local household income ($46k/yr) (locally 3363% of renters already pay >50% of income on rent) — very limited rent-growth headroom before tenants either downsize or default.
Forward outlook
- Local home prices are declining (-3.0%/yr); year-one equity from $1k of loan paydown is wiped out by about $6k of value loss. Plan a longer hold.
- Richmond County population projected to shrink 5% by 2050 — rents likely to lag national; underwrite the cash flow, not the appreciation.
Negotiation context
- It's been on market 28 days — a 2% lower offer ($202k) is reasonable based on typical stale-listing flexibility.
- Current owner paid $76k; list at $205k implies a 170% gain — meaningful room to come down on a strong offer.
Risks & watch-outs
- Climate carrying-cost: major wind risk, 65% chance of damaging wind over 30y; extreme-heat days projected 7→17/yr by 2055 (HVAC capex compounding) — expect insurance premiums to compound above CPI over the hold.
Questions for the listing agent
- Is there a deadline driving the sale (1031 exchange, divorce, estate, relocation)? That informs how much negotiation room exists.
- What's the average days-on-market for RENTAL listings here right now (not sales)? A rising rental-DOM trend means longer vacancies and softer asking-rent achievability than the comps imply.
- What's the recent tenant-quality profile in this submarket — average credit score on applications, eviction rate, late-payment / NSF rate, and stable-employment percentage? A property-management company in the area should have these aggregated.
- How much new for-sale + rental construction is in the pipeline within 1–3 miles? Heavy new supply typically softens prices + rents 12–24 months out; constrained supply supports both.
Investment metrics
- 1% rule
- 0.96% ✗
- Cap rate
- 8.19%
- Cash-on-cash
- 6.76%
- DSCR
- 1.30
- GRM
- 8.6
CMA / ARV
- ARV (on-the-fly)
- $324,850
- Comps found
- 12
Show comp detail 12 sales within ~0.75 mi
| Address | Dist | Beds/Ba | Sqft | Sold | Price | $/sf | Match |
|---|---|---|---|---|---|---|---|
| 1059 Burlington Dr | 0.43mi | 4/2.0 | 1,824 (-0%) | 8mo | $328,368 | $180 | 73 |
| 1055 Burlington Dr | 0.47mi | 4/2.0 | 1,824 (-0%) | 12mo | $335,790 | $184 | 68 |
| 729 Holderness Ct | 0.61mi | 4/2.0 | 1,886 (+3%) | 5mo | $280,000 | $148 | 62 |
| 1063 Burlington Dr | 0.41mi | 4/2.0 | 1,961 (+8%) | 11mo | $326,400 | $166 | 59 |
| 4062 Cottingham Way | 0.53mi | 3/2.5 (-1) | 1,881 (+3%) | 8mo | $318,400 | $169 | 56 |
| 4002 Cottingham Way | 0.66mi | 3/2.5 (-1) | 1,881 (+3%) | 3mo | $317,400 | $169 | 54 |
| 1051 Burlington Dr | 0.47mi | 4/2.0 | 1,961 (+8%) | 14mo | $327,550 | $167 | 54 |
| 4061 Cottingham Way | 0.50mi | 4/2.5 | 2,031 (+11%) | 4mo | $327,900 | $161 | 53 |
| 1029 Burlington Dr | 0.51mi | 3/2.0 (-1) | 1,662 (-9%) | 5mo | $295,377 | $178 | 52 |
| 1029 Burlington Dr | 0.51mi | 3/2.0 (-1) | 1,662 (-9%) | 5mo | $295,377 | $178 | 52 |
| 4053 Cottingham Way | 0.51mi | 3/2.0 (-1) | 1,662 (-9%) | 14mo | $306,400 | $184 | 45 |
| 1060 Burlington Dr | 0.50mi | 3/2.0 (-1) | 1,554 (-15%) | 12mo | $303,800 | $195 | 37 |
Match score weights: distance 35% · size 25% · config 20% · recency 20%. Top-matched comps best support the ARV.
Projected returns pro-forma
-3.0% appreciation · 0.0% rent growth · sell at horizon
- IRR
- -9.0%
- Equity multiple
- 0.68×
- Total profit
- $-18,501
- Equity at exit
- $30,566
- IRR
- -3.7%
- Equity multiple
- 0.79×
- Total profit
- $-12,303
- Equity at exit
- $17,725
Cash invested: $57,400 (down + closing). Projections, not guarantees.
Landlord ↔ Tenant lean methodology
- Overall (STATE)
- 90 Strongly Landlord-Friendly
- State Georgia
- 90 Strongly Landlord-Friendly · R+3
- County
- — inherits STATE
- City
- — inherits STATE
ZIP-level market 30906
- Home prices YoY
- -21.6%
- Rents YoY
- -0.2%
- Active inventory
- 364
- Price-to-rent
- 8.6×
Monthly cashflow live
- Estimated rent
- $1,976 high interval (Pro) →
- Mortgage (P&I)
- −$1,075
- Tax from tax record
- −$77 /mo · $927/yr
- Insurance
- −$85
- HOA
- −$0
- Vacancy / Maint / Mgmt
- −$415
- Net cashflow
- $323
Break-even live
UW: 25.0% down · 7.5% · 30yr · 1.5% tax · 5.0% vac · 8.0% maint · 8.0% mgmt
Financing live
Cash to close
- Down payment
- $51,250
- Closing costs
- $6,150
- Reserves months
- —
- Total cash needed
- —
Loan-product check · same deal, 3 products live
Conventional
25% down · 7.5% · 30yr
- Down + closing
- —
- Monthly P&I
- —
- Monthly cashflow
- —
- DSCR
- —
- Eligible?
- —
Personal DTI + credit; lowest rate.
DSCR
20% down · 8.5% · 30yr
- Down + closing
- —
- Monthly P&I
- —
- Monthly cashflow
- —
- DSCR
- —
- Eligible?
- —
No personal income docs; deal must DSCR.
Hard money
10% down · 12.0% · 12mo
- Down + closing
- —
- Monthly P&I
- —
- Monthly cashflow
- —
- DSCR
- —
- Eligible?
- —
Short-term bridge; refi at stabilization.
Rent comps 7 comps
| Address | Beds | Baths | Sqft | Rent | $/sqft | DOM | Units | Dist |
|---|---|---|---|---|---|---|---|---|
| 750 Holderness Ct Augusta, GA | 4.0 | 2.5 | 2294 | $2,270 | $0.99 | 23d | 1 | 0.68mi |
| 3211 Lexington Way Augusta, GA | 4.0 | 2.5 | 2335 | $2,200 | $0.94 | 44d | 1 | 1.11mi |
| 2524 Drayton Dr Augusta, GA | 3.0 | 2.0 | 1404 | $1,700 | $1.21 | 44d | 1 | 1.22mi |
| 2609 Dublin Dr Augusta, GA | 3.0 | 2.0 | 1400 | $1,395 | $1.00 | 14d | 1 | 1.34mi |
| 2631 Drayton Dr Augusta, GA | 3.0 | 2.0 | 1404 | $1,430 | $1.02 | 14d | 1 | 1.48mi |
| 2297 Belair Spring Rd Augusta, GA | 4.0 | 2.5 | 2031 | $2,250 | $1.11 | 14d | 1 | 1.49mi |
| 2514 Winterville Dr Augusta, GA | 3.0 | 2.0 | 1612 | $1,795 | $1.11 | 14d | 1 | 1.50mi |
Listing history 16 events
-
2026-06-18days on market $205,000 Active 28 DOM
-
2026-06-17days on market $205,000 Active 27 DOM
-
2026-06-16days on market $205,000 Active 26 DOM
-
2026-06-15days on market $205,000 Active 25 DOM
-
2026-06-14days on market $205,000 Active 23 DOM
-
2026-06-10days on market $205,000 Active 20 DOM
-
2026-06-09days on market $205,000 Active 19 DOM
-
2026-06-08days on market $205,000 Active 18 DOM
-
2026-06-07days on market $205,000 Active 17 DOM
-
2026-06-03days on market $205,000 Active 13 DOM
-
2026-06-02days on market $205,000 Active 12 DOM
-
2026-06-01days on market $205,000 Active 11 DOM
-
2026-05-31days on market $205,000 Active 10 DOM
-
2026-05-30days on market $205,000 Active 9 DOM
-
2026-05-13$205,000 Active
-
1996-02-07soldstatus $76,000
ⓘ Source: listings_history table (triggers on properties + properties_extension) + one-shot
backfill from property_details.listing_events for pre-trigger history.
Tax reassessment forecast GA · Resets to sale price
- Current annual tax
- $927 · $77/mo
- Projected year-2 tax
- $1,886 · $157/mo
- Expected delta
- +$959/yr (+$80/mo · 103.5%)
ⓘ Screening estimate from a state-policy table — verify with the county assessor before closing.
Climate risk First Street
- Flood 1/10 Low FEMA zone X (unshaded) · 0% chance over 30 yrs
- Wildfire 4/10 Moderate
- Heat 7/10 Severe 7 d/yr ≥106°F today · 17 d/yr by 30 yrs out
- Wind 6/10 Major 65% chance of damaging wind over 30 yrs
- Air quality 3/10 Moderate 3 unhealthy d/yr today · 3 by 30 yrs out
Nearby sold comps map
Loading sold comps map…
Walkable amenities ~0.75 mi
Loading nearby amenities…
Taxation est. · year 1
- Rental income
- $23,711
- − Mortgage interest
- −$11,483
- − Property taxes
- −$927
- − Insurance
- −$1,025
- − Repairs & maintenance
- −$1,897
- − Management
- −$1,897
- − Depreciation
- −$5,964
- Taxable income
- $518
- Est. tax owed @ 24.0%
- −$124
- After-tax cash flow
- $3,755/yr
For passive investors: Depreciation is non-cash, so a rental often shows a tax loss while cash-flowing — sheltering income. Rental losses are passive: they offset passive income freely, and up to $25,000/yr can offset ordinary (W-2) income if you actively participate and your MAGI is under $100k (phasing out to $0 by $150k); unused losses carry forward. On sale, claimed depreciation is recaptured at up to 25%, and gains may owe capital-gains tax (a 1031 exchange can defer both). Figures are a year-1 estimate at your 24.0% rate — not tax advice; consult a CPA.
Schools (NCES district)
- District
- Richmond County
- NCES district ID
- 1304380
- Math proficiency
- 12% ▼ -9.00%
- Reading proficiency
- 20% ▼ -6.00%
- Median HH income
- $38,069
- Composite
- 13.43/100
- National rank
- #9524
- State rank
- #154 of 174 in GA
Livability — Augusta-Richmond County consolidated government (balance)
No livability data for this city. (Only ~50 U.S. cities are tracked.)
Census & demographics
- Census place
- Augusta-Richmond County consolidated government (balance), GA
- County
- Richmond County · 190,917 people
- City population
- 154,035
- Metro
- Augusta-Richmond County, GA-SC
- Population (ZIP)
- 60,423
- Household income
- $45,999
- Rent vs Own
- Severe rent burden
- 3363.0
Population outlook (Richmond County) Hauer SSP2
- Today (2025)
- 200,753 people
- By 2030
- 200,232 · -0.3%
- By 2040
- 196,813 · -2.0%
- By 2050
- 190,347 · -5.2%
- By 2075
- 172,496 · -14.1%
- By 2100
- 146,284 · -27.1%
Race, ethnicity, and origin ACS 2023
- Neighborhood character
- Majority Black (64%)
- Race & ethnicity
- Black 64% White 27% Two or more races 5% Hispanic / Latino 5%
- Common ancestry
- Lithuanian 1%
- Foreign-born
- 2% · Canada
- Languages at home
- 95% English-only · Spanish 3% German/W. Germanic 1%
Political lean MEDSL · Richmond
- 2024 margin
- Solid D (+36.1) · D 67.8% · R 31.7%
- 2008→2024 swing
- +4.3pp toward D · 2008: 31.8pp · 2024: 36.1pp
- All cycles
- 2024: D+36.1 2020: D+37.2 2016: D+32.4 2012: D+33.8 2008: D+31.8
Not yet ingested
- Civics
- —
Market trends
- HPI YoY
- ▼ -58.99%
- Current HPI
- 213.5733
- Rent YoY
- ▼ -0.25%
- Metro
- Augusta-Richmond County, GA-SC
- State GDP YoY
- ▲ 2.66%
- F500 in state
- 28
Industry mix (Fortune 500 HQ in GA)
| Industry | F500 HQs | Revenue |
|---|---|---|
| Paper / Packaging | 2 | $29B |
|
||
| Retail | 1 | $160B |
|
||
| Transportation / Logistics | 1 | $91B |
|
||
| Airlines | 1 | $62B |
|
||
| Consumer Goods | 1 | $47B |
|
||
| Utilities | 1 | $25B |
|
||
Price history
+169.7% since first listed2 events — show timeline
- 2026-05-13 Listed $205,000 Hive MLS
- 1996-02-07 Sold (Public Records) $76,000 Public Records
Property tax history
+3.5%/yrLatest (2025): $927 · +2.9% YoY. Source: county tax records.
Cash-flow waterfall
monthlySold comps — $/sqft
last 12 mo · ≤1 miLoading sold comps…