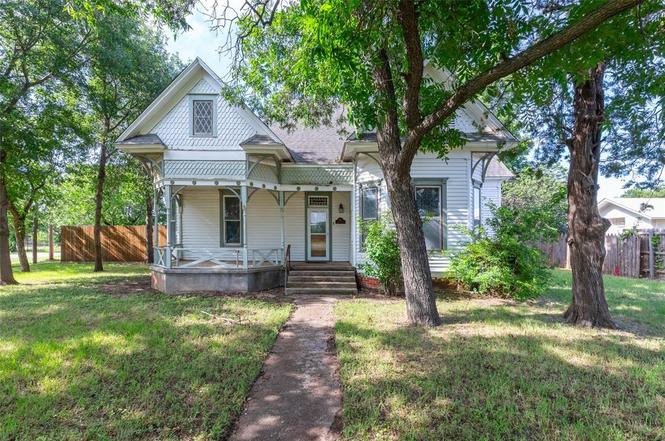
601 W 3rd St · Baird, TX
Flood risk 1/10 · Minimal
- FEMA flood zone
- —
- Chance of flooding over 30 yrs
- 0.0%
- Est. flood insurance / yr
- —
Fire risk 8/10 · Major
- Est. fire insurance / yr
- $1,222 – $2,270
Heat risk 6/10 · Moderate
- Hot days now (above 104°F)
- 7 days/yr
- Hot days in 30 yrs
- 22 days/yr
Wind risk 4/10 · Minor
- Chance of severe wind over 30 yrs
- 15.0%
Air-quality risk 1/10 · Minimal
- Unhealthy air days now
- 0 days/yr
- Unhealthy air days in 30 yrs
- 0 days/yr
Risk factors via First Street. Map © Google.
Why this score? — see what drove the A grade
The composite is a weighted blend of 9 inputs, each scored 0–100. Each bar is that input's sub-score; the figure is the points it added to the 100-point composite (weight × sub-score).
- Cash flow +30.0/30.0
- ARV discount +15.0/15.0
- 1% rule +10.0/10.0
- DSCR +10.0/10.0
- Appreciation +8.9/10.0
- Livability +3.7/5.0
- Schools +3.6/10.0
- Rent growth +2.5/5.0
- Condition / age +2.5/5.0
$99,500
🖨 Deal sheet 📄 Offer letter ✓ Due diligence
Listing remarks MLS
Beautiful Victorian charm. Past and present delights. 12 foot ceilings, some leaded glass windows and on front door, original wood trim and hardware, exterior paint. Additional patio and HVAC, insulation & carpet all new in summer of 2015. Relaxing covered patio and deck, 3 bed, 2 bath, formal dining, large bedrooms, corner lot, lots of trees, above ground pool, storage building. Small town charm only 25 min to Abilene
Key facts
- Pocket doors
- Historical details
- Leaded glass windows
Tags
Property features AI
Finance
- Other: Survey available; Possession at closing/funding
- Financial info: Listing terms: Cash; Second mortgage: No
- HOA & community: No association
Exterior
- Parking: Covered carport (2 spaces)
- Utilities: City water; City sewer; All-weather road
- Home design: Single family residence; One story; Residential property; Subdivision: Railroad - Baird
- Construction: Built in 1998; Wood construction; Composition roof; Pillar/post/pier foundation
- Exterior features: Covered porch(es); Covered patio/porch; Corner lot; Partial wood fencing in back yard
Interior
- Kitchen: Electric cooktop; Kitchen island; Pantry
- Bedrooms: 3 bedrooms; Primary bedroom on level 1 with a fireplace (approx. 19 x 12)
- Flooring: Carpet; Hardwood; Laminate; Wood under carpet
- Bathrooms: 1 full bathroom
- Heating & cooling: Central heating (natural gas); Central air; Electric cooling; Ceiling fans
- Interior features: Chandelier; Kitchen island; Natural woodwork; Paneling; Pantry; Vaulted ceilings; One living area; One dining area; Room count: 2
- Laundry & utility: Full-size washer/dryer area; Gas water heater
Neighborhood map
What this means for you Summary
Snapshot
- This is a 3-bed/1.0-bath single-family listed at $100k.
Deal economics
- At list price, monthly cash flow is $1k ($13k/yr) — positive.
- The deal already cash-flows at list — no discount required.
- Meets the 1% rule at list price ($2k rent vs $100k).
Location & tenants
- Location reads 74/100 on livability (#195 in TX, #4,977 nationally) — a middle-class / working-renter tenant base. Strengths: cost of living A+, housing A+, health & safety A+; Watch: employment C-, amenities F, commute F.
- Baird ISD (rural): math 40% / reading 40% proficiency, ranked #731 of 1,141 in TX (top 64%) — families likely to look elsewhere, expect single-tenant / working-renter base with shorter leases; 63% free/reduced lunch — lower-income household profile, screen leases tightly.
- Zoned schools: Baird El (math 47% / reading 37%, grade F, #1,335 of 4,322 statewide, top 33%, 169 students, 57% FRL).
- Market conditions: 20 active listings in the ZIP; 11 units permitted in Callahan County in 2024 (0 in 5+ unit buildings).
Forward outlook
- In year one you build about $8k of equity ($688 loan paydown + $8k appreciation (7.7% local appreciation)).
- Callahan County population projected to shrink 5% by 2050 — rents likely to lag national; underwrite the cash flow, not the appreciation.
- At projected returns (7.7% appreciation + 3.0% rent growth), your $28k cash investment doubles in ~2 years — after that, you're playing with house money.
- By year 5, paydown + projected appreciation supports a ~$38k cash-out refi (75% LTV) — recoverable capital for the next deal without selling this one.
Negotiation context
- Only 4 days on market — expect competitive offers; lowballing is unlikely to land.
- 7 sale attempts since 11y ago with the ask held roughly flat each time — persistent listings suggest the price (not the market) is what's stuck; bring a comps-based counter.
Risks & watch-outs
- Climate carrying-cost: severe wildfire risk; extreme-heat days projected 7→22/yr by 2055 (HVAC capex compounding) — expect insurance premiums to compound above CPI over the hold.
Questions for the listing agent
- Is there a deadline driving the sale (1031 exchange, divorce, estate, relocation)? That informs how much negotiation room exists.
- What's the average days-on-market for RENTAL listings here right now (not sales)? A rising rental-DOM trend means longer vacancies and softer asking-rent achievability than the comps imply.
- What's the recent tenant-quality profile in this submarket — average credit score on applications, eviction rate, late-payment / NSF rate, and stable-employment percentage? A property-management company in the area should have these aggregated.
- How much new for-sale + rental construction is in the pipeline within 1–3 miles? Heavy new supply typically softens prices + rents 12–24 months out; constrained supply supports both.
Investment metrics
- 1% rule
- 2.39% ✓
- Cap rate
- 19.72%
- Cash-on-cash
- 47.96%
- DSCR
- 3.13
- GRM
- 3.5
CMA / ARV
- ARV (on-the-fly)
- $181,548
- Comps found
- 3
Show comp detail 3 sales within ~0.75 mi
| Address | Dist | Beds/Ba | Sqft | Sold | Price | $/sf | Match |
|---|---|---|---|---|---|---|---|
| 333 Callowhill St | 0.13mi | 3/2.0 | 1,744 (+4%) | 12mo | $179,900 | $103 | 74 |
| 400 Arch St | 0.31mi | 3/2.0 | 1,568 (-7%) | 3mo | $185,000 | $118 | 68 |
| 533 Thelma Ave | 0.64mi | 3/2.0 | 1,576 (-6%) | 12mo | $169,900 | $108 | 46 |
Match score weights: distance 35% · size 25% · config 20% · recency 20%. Top-matched comps best support the ARV.
Projected returns pro-forma
7.74% appreciation · 3.0% rent growth · sell at horizon
- IRR
- 59.1%
- Equity multiple
- 4.96×
- Total profit
- $110,346
- Equity at exit
- $73,843
- IRR
- 54.5%
- Equity multiple
- 10.61×
- Total profit
- $267,599
- Equity at exit
- $144,938
Cash invested: $27,860 (down + closing). Projections, not guarantees.
Landlord ↔ Tenant lean methodology
- Overall (STATE)
- 87 Strongly Landlord-Friendly
- State Texas
- 87 Strongly Landlord-Friendly · R+5
- County
- — inherits STATE
- City
- — inherits STATE
ZIP-level market 79504
- Home prices YoY
- 5.0%
- Active inventory
- 20
- Price-to-rent
- 3.5×
Monthly cashflow live
- Estimated rent
- $2,375 medium interval (Pro) →
- Mortgage (P&I)
- −$522
- Tax from tax record
- −$199 /mo · $2,392/yr
- Insurance
- −$41
- HOA
- −$0
- Vacancy / Maint / Mgmt
- −$499
- Net cashflow
- $1,114
Break-even live
UW: 25.0% down · 7.5% · 30yr · 1.5% tax · 5.0% vac · 8.0% maint · 8.0% mgmt
Financing live
Cash to close
- Down payment
- $24,875
- Closing costs
- $2,985
- Reserves months
- —
- Total cash needed
- —
Loan-product check · same deal, 3 products live
Conventional
25% down · 7.5% · 30yr
- Down + closing
- —
- Monthly P&I
- —
- Monthly cashflow
- —
- DSCR
- —
- Eligible?
- —
Personal DTI + credit; lowest rate.
DSCR
20% down · 8.5% · 30yr
- Down + closing
- —
- Monthly P&I
- —
- Monthly cashflow
- —
- DSCR
- —
- Eligible?
- —
No personal income docs; deal must DSCR.
Hard money
10% down · 12.0% · 12mo
- Down + closing
- —
- Monthly P&I
- —
- Monthly cashflow
- —
- DSCR
- —
- Eligible?
- —
Short-term bridge; refi at stabilization.
Listing history 5 events
-
2026-06-18days on market $99,500 Active 4 DOM
-
2026-06-17days on market $99,500 Active 3 DOM
-
2026-06-16days on market $99,500 Active 2 DOM
-
2026-06-15remarks 699-char remark
-
2026-06-15$99,500 Active 1 DOM
ⓘ Source: listings_history table (triggers on properties + properties_extension) + one-shot
backfill from property_details.listing_events for pre-trigger history.
Tax reassessment forecast TX · Resets to sale price
- Current annual tax
- $2,392 · $199/mo
- Projected year-2 tax
- $2,392 · $199/mo
- Expected delta
- $0/yr ($0/mo · 0.0%)
ⓘ Screening estimate from a state-policy table — verify with the county assessor before closing.
Climate risk First Street
- Flood 1/10 Low 0% chance over 30 yrs
- Wildfire 8/10 Severe
- Heat 6/10 Major 7 d/yr ≥104°F today · 22 d/yr by 30 yrs out
- Wind 4/10 Moderate 15% chance of damaging wind over 30 yrs
- Air quality 1/10 Low 0 unhealthy d/yr today · 0 by 30 yrs out
Nearby sold comps map
Loading sold comps map…
Walkable amenities ~0.75 mi
Loading nearby amenities…
Taxation est. · year 1
- Rental income
- $28,498
- − Mortgage interest
- −$5,574
- − Property taxes
- −$2,392
- − Insurance
- −$498
- − Repairs & maintenance
- −$2,280
- − Management
- −$2,280
- − Depreciation
- −$2,895
- Taxable income
- $12,581
- Est. tax owed @ 24.0%
- −$3,019
- After-tax cash flow
- $10,343/yr
For passive investors: Depreciation is non-cash, so a rental often shows a tax loss while cash-flowing — sheltering income. Rental losses are passive: they offset passive income freely, and up to $25,000/yr can offset ordinary (W-2) income if you actively participate and your MAGI is under $100k (phasing out to $0 by $150k); unused losses carry forward. On sale, claimed depreciation is recaptured at up to 25%, and gains may owe capital-gains tax (a 1031 exchange can defer both). Figures are a year-1 estimate at your 24.0% rate — not tax advice; consult a CPA.
Schools (NCES district)
- District
- Baird ISD
- NCES district ID
- 4809280
- Math proficiency
- 40% ▲ 10.00%
- Reading proficiency
- 40% ▲ 5.00%
- Median HH income
- $43,351
- Composite
- 36.29/100
- National rank
- #9407
- State rank
- #731 of 1141 in TX
Livability — Baird
- Score
- 74/100
- State rank
- #195
- US rank
- #4977
Category grades
Schools grade is shown separately in the Schools card above.
Census & demographics
- Census place
- Baird, TX
- Population (ZIP)
- 2,995
Population outlook (Callahan County) Hauer SSP2
- Today (2025)
- 13,664 people
- By 2030
- 13,578 · -0.6%
- By 2040
- 13,283 · -2.8%
- By 2050
- 13,008 · -4.8%
- By 2075
- 12,354 · -9.6%
- By 2100
- 11,326 · -17.1%
Race, ethnicity, and origin ACS 2023
- Neighborhood character
- Predominantly White (84%)
- Race & ethnicity
- White 84% Hispanic / Latino 11% Two or more races 7% Black 2%
- Hispanic origin (detail)
- Mexican 10%
- Common ancestry
- Italian 16% Slovak 2% Iranian 1%
- Foreign-born
- 1% · Canada
- Languages at home
- 94% English-only · Spanish 6%
Political lean MEDSL · Callahan
- 2024 margin
- Solid R (+77.6) · D 10.9% · R 88.5%
- 2008→2024 swing
- -15.9pp toward R · 2008: -61.7pp · 2024: -77.6pp
- All cycles
- 2024: R+77.6 2020: R+77.3 2016: R+77.2 2012: R+69.8 2008: R+61.7
Not yet ingested
- Civics
- —
Market trends
- HPI YoY
- ▲ 7.74%
- Current HPI
- 161.9583
- Rent YoY
- —
- Metro
- —
- State GDP YoY
- ▲ 3.95%
- F500 in state
- 110
Industry mix (Fortune 500 HQ in TX)
| Industry | F500 HQs | Revenue |
|---|---|---|
| Energy | 16 | $1,198B |
|
||
| Technology | 5 | $198B |
|
||
| Engineering / Construction | 4 | $72B |
|
||
| Energy Services | 3 | $60B |
|
||
| Utilities | 3 | $41B |
|
||
| Healthcare | 2 | $330B |
|
||
Price history
-13.5% since first listed18 events — show timeline
- 2026-06-11 Listed $99,500 NTREIS
- 2026-04-08 Listing Removed — NTREIS
- 2026-04-02 Relisted — NTREIS
- 2026-03-26 Contingent — NTREIS
- 2026-02-25 Relisted — NTREIS
- 2026-02-15 Contingent — NTREIS
- 2026-01-27 Price Changed $99,500 NTREIS
- 2025-08-29 Listed $107,000 NTREIS
- 2016-05-04 Sold (Public Records) — Public Records
- 2016-04-29 Sold (MLS) — NTREIS
- 2016-03-20 Pending — NTREIS
- 2016-03-10 Contingent — NTREIS
- 2016-01-29 Relisted — NTREIS
- 2016-01-24 Contingent — NTREIS
- 2015-12-18 Relisted — NTREIS
- 2015-12-13 Listing Removed — NTREIS
- 2015-11-12 Listed $115,000 NTREIS
- 2015-06-23 Sold (Public Records) — Public Records
Property tax history
+7.7%/yrLatest (2025): $2,392 · -3.5% YoY. Source: county tax records.
Cash-flow waterfall
monthlySold comps — $/sqft
last 12 mo · ≤1 miLoading sold comps…