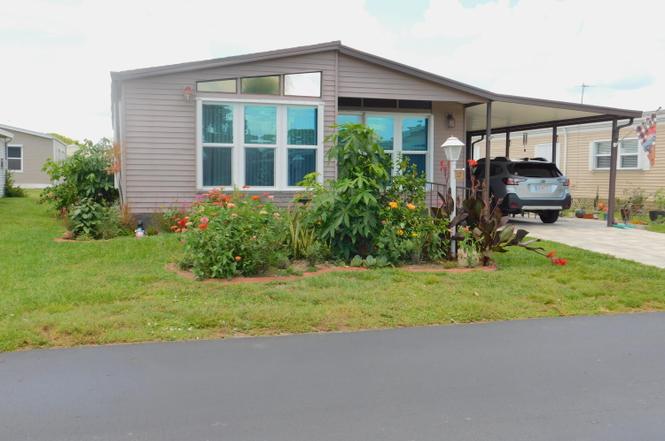
527 Tropical Isles Cir Unit F-30 · Indian River Estates, FL
Flood risk 1/10 · Minimal
- FEMA flood zone
- X (unshaded)
- Chance of flooding over 30 yrs
- 0.0%
- Est. flood insurance / yr
- $507 – $1,088
Fire risk 3/10 · Minor
- Est. fire insurance / yr
- $947 – $1,759
Heat risk 10/10 · Severe
- Hot days now (above 106°F)
- 7 days/yr
- Hot days in 30 yrs
- 24 days/yr
Wind risk 10/10 · Severe
- Chance of severe wind over 30 yrs
- 99.0%
Air-quality risk 2/10 · Minimal
- Unhealthy air days now
- 1 days/yr
- Unhealthy air days in 30 yrs
- 1 days/yr
Risk factors via First Street. Map © Google.
Why this score? — see what drove the C+ grade
The composite is a weighted blend of 9 inputs, each scored 0–100. Each bar is that input's sub-score; the figure is the points it added to the 100-point composite (weight × sub-score).
- Cash flow +24.1/30.0
- 1% rule +8.3/10.0
- DSCR +7.8/10.0
- ARV discount +7.5/15.0
- Rent growth +4.4/5.0
- Schools +3.7/10.0
- Livability +3.2/5.0
- Condition / age +2.5/5.0
- Appreciation +0.0/10.0
$159,900
🖨 Deal sheet 📄 Offer letter ✓ Due diligence
Listing remarks
All Updated and ready to move into. NO LOT LEASE as it comes with a "Share Certificate". Newer Roof, Air Cond. and fans, newer verticals, Newer floor, Newer Plumbing in & out. Newer Vapor barrier, Newer driveway and windows, Newer paint throughout, countertops updated and cabinets painted, house painted outside, Newer windows in sunroom, hurricane shutters and mini split. Great 2 bedroom, 2 bath home with master bath updated and all new appliances. Buyer approval needed.
Key facts
- New verticals
- New plumbing
- New fans
Tags
Property features AI
Finance
- Financial info: Pets allowed (with limits on number and size)
- HOA & community: Association: Tropical Isles Co-op, Inc.; Monthly association fee of $260; Association amenities include pool (heated), spa/hot tub, clubhouse, community room, billiard and game rooms, library, manager on site, security, tennis courts, pickleball and shuffleboard courts, bocce ball, and recreation facilities; Association fee covers sewer, trash, common areas, common real estate tax, and recreation facility; Senior community
Exterior
- Parking: Attached carport (1 covered space)
- Security: Community security (association amenity)
- Utilities: Public water; Public sewer; 200+ amp electric service with circuit breakers; Sewer and water connected
- Home design: Single family residence; One-story; Resale property; Accessible approach with ramp; Faces south
- Construction: Aluminum siding; Metal roof; Piling foundation; Built as a single-story with total building area recorded by appraiser
- Exterior features: Landscaped yard; Shed on property; Private maintained asphalt road
Interior
- Kitchen: Electric range; Microwave; Refrigerator
- Bedrooms: 2 bedrooms on the main level
- Flooring: Laminate flooring
- Bathrooms: 2 full bathrooms on the main level
- Heating & cooling: Central electric heating; Central air conditioning; Ceiling fans
- Interior features: Bedroom layout with stacked bedrooms; Blinds on windows
- Laundry & utility: Washer hookup inside; Gas dryer hookup inside
Neighborhood map
What this means for you Summary
Snapshot
- This is a 2-bed/2.0-bath manufactured listed at $160k.
Deal economics
- At list price, monthly cash flow is $315 ($4k/yr) — positive.
- The deal already cash-flows at list — no discount required.
- Meets the 1% rule at list price ($2k rent vs $160k).
- Cap rate 8.7% vs local median 5.3% in Indian River Estates — top-decile yield for the area; either an underpriced asset or a hidden risk that comps aren't pricing in. Stress-test before assuming the spread holds.
Location & tenants
- Location reads 65/100 on livability (#653 in FL) — a middle-class / working-renter tenant base. Strengths: cost of living A+, housing A+, crime B+; Watch: employment D+, schools F, amenities F.
- St. Lucie (urban): math 40% / reading 48% proficiency, ranked #51 of 73 in FL (top 70%) — families likely to look elsewhere, expect single-tenant / working-renter base with shorter leases.
- Market conditions: Rents rising fast (+7.4%/yr); 336 active listings in the ZIP; 10 comparable units currently listed for rent nearby; rentals at typical pace (median 24d on market — plan ~3-4 weeks tenant-placement turnaround); 4,868 units permitted in St. Lucie County in 2024 (268 in 5+ unit buildings).
- At $2,126/mo this rent would consume 47% of the median local household income ($54k/yr) (locally 1086% of renters already pay >50% of income on rent) — very limited rent-growth headroom before tenants either downsize or default.
Forward outlook
- Local home prices are declining (-3.0%/yr); year-one equity from $1k of loan paydown is wiped out by about $5k of value loss. Plan a longer hold.
- St. Lucie County population projected at +20% by 2050 — long-run rental-demand tailwind backs the buy-and-hold thesis.
- At projected returns (-3.0% appreciation + 7.4% rent growth), your $45k cash investment doubles in ~8 years — after that, you're playing with house money.
Negotiation context
- Only 2 days on market — expect competitive offers; lowballing is unlikely to land.
Risks & watch-outs
- Climate carrying-cost: severe wind risk, 99% chance of damaging wind over 30y; extreme-heat days projected 7→24/yr by 2055 (HVAC capex compounding) — expect insurance premiums to compound above CPI over the hold.
Questions for the listing agent
- What does the HOA fee cover, when was the last increase, and are there any pending special assessments or reserve-fund shortfalls?
- Is there a deadline driving the sale (1031 exchange, divorce, estate, relocation)? That informs how much negotiation room exists.
- Schools are F-rated, which usually means shorter tenancies and higher turnover. Who's the typical renter profile here, and what's been the actual vacancy rate?
- What's the average days-on-market for RENTAL listings here right now (not sales)? A rising rental-DOM trend means longer vacancies and softer asking-rent achievability than the comps imply.
- What's the recent tenant-quality profile in this submarket — average credit score on applications, eviction rate, late-payment / NSF rate, and stable-employment percentage? A property-management company in the area should have these aggregated.
- How much new for-sale + rental construction is in the pipeline within 1–3 miles? Heavy new supply typically softens prices + rents 12–24 months out; constrained supply supports both.
Investment metrics
- 1% rule
- 1.33% ✓
- Cap rate
- 8.66%
- Cash-on-cash
- 8.44%
- DSCR
- 1.38
- GRM
- 6.3
CMA / ARV
- ARV (on-the-fly)
- $80,534
- Comps found
- 1
Show comp detail 1 sale within ~0.75 mi
| Address | Dist | Beds/Ba | Sqft | Sold | Price | $/sf | Match |
|---|---|---|---|---|---|---|---|
| 5683 Hemingway Ct | 0.13mi | 2/2.0 | 1,144 (-5%) | 1mo | $76,800 | $67 | 85 |
Match score weights: distance 35% · size 25% · config 20% · recency 20%. Top-matched comps best support the ARV.
Projected returns pro-forma
-3.0% appreciation · 7.42% rent growth · sell at horizon
- IRR
- 2.3%
- Equity multiple
- 1.09×
- Total profit
- $4,214
- Equity at exit
- $23,842
- IRR
- 16.4%
- Equity multiple
- 2.67×
- Total profit
- $74,685
- Equity at exit
- $13,825
Cash invested: $44,772 (down + closing). Projections, not guarantees.
Landlord ↔ Tenant lean methodology
- Overall (STATE)
- 87 Strongly Landlord-Friendly
- State Florida
- 87 Strongly Landlord-Friendly · R+3
- County
- — inherits STATE
- City
- — inherits STATE
ZIP-level market 34982
- Home prices YoY
- -33.4%
- Rents YoY
- 7.4%
- Active inventory
- 336
- Price-to-rent
- 6.3×
Monthly cashflow live
- Estimated rent
- $2,126 high interval (Pro) →
- Mortgage (P&I)
- −$839
- Tax est. 1.5%
- −$200 /mo · $2,398/yr
- Insurance
- −$67
- HOA
- −$260
- Vacancy / Maint / Mgmt
- −$447
- Net cashflow
- $315
Break-even live
UW: 25.0% down · 7.5% · 30yr · 1.5% tax · 5.0% vac · 8.0% maint · 8.0% mgmt
Financing live
Cash to close
- Down payment
- $39,975
- Closing costs
- $4,797
- Reserves months
- —
- Total cash needed
- —
Loan-product check · same deal, 3 products live
Conventional
25% down · 7.5% · 30yr
- Down + closing
- —
- Monthly P&I
- —
- Monthly cashflow
- —
- DSCR
- —
- Eligible?
- —
Personal DTI + credit; lowest rate.
DSCR
20% down · 8.5% · 30yr
- Down + closing
- —
- Monthly P&I
- —
- Monthly cashflow
- —
- DSCR
- —
- Eligible?
- —
No personal income docs; deal must DSCR.
Hard money
10% down · 12.0% · 12mo
- Down + closing
- —
- Monthly P&I
- —
- Monthly cashflow
- —
- DSCR
- —
- Eligible?
- —
Short-term bridge; refi at stabilization.
Rent comps 10 comps
| Address | Beds | Baths | Sqft | Rent | $/sqft | DOM | Units | Dist |
|---|---|---|---|---|---|---|---|---|
| 203 Melton Dr Unit B Fort Pierce, FL | 2.0 | 1.0 | 1200 | $1,800 | $1.50 | 23d | 1 | 0.37mi |
| 341 Ashley St Fort Pierce, FL | 3.0 | 2.0 | 1128 | $2,460 | $2.18 | 23d | 1 | 0.55mi |
| 355 Johnston St Fort Pierce, FL | 3.0 | 1.5 | 1118 | $2,500 | $2.24 | 23d | 1 | 0.59mi |
| 352 Johnston St Fort Pierce, FL | 3.0 | 2.0 | 936 | $2,100 | $2.24 | 23d | 1 | 0.61mi |
| 330 Borraclough St Fort Pierce, FL | 3.0 | 2.0 | 1404 | $2,175 | $1.55 | 14d | 1 | 0.68mi |
| 492 Salisbury Cir Fort Pierce, FL | 3.0 | 2.5 | 1486 | $2,395 | $1.61 | 23d | 1 | 0.74mi |
| 526 Salisbury Cir Fort Pierce, FL | 3.0 | 2.5 | 1486 | $2,399 | $1.61 | 14d | 1 | 0.77mi |
| 5300 Seagrape Dr Fort Pierce, FL | 3.0 | 2.0 | 1300 | $2,450 | $1.88 | 23d | 1 | 0.81mi |
| 5315 Hickory Dr Fort Pierce, FL | 3.0 | 2.0 | 1400 | $2,045 | $1.46 | 23d | 1 | 0.98mi |
| 699 W Weatherbee Rd Fort Pierce, FL | 2.0 | 1.5 | 1100 | $1,875 | $1.70 | 23d | 1 | 1.29mi |
HOA detail
- Monthly dues
- $260 · $3,120/yr
Listing history 5 events
-
2026-06-18remarks 477-char remark
-
2026-06-18days on market $159,900 Active 2 DOM
-
2026-06-17remarks 424-char remark
-
2026-06-16remarks 408-char remark
-
2026-06-16$159,900 Active 1 DOM
ⓘ Source: listings_history table (triggers on properties + properties_extension) + one-shot
backfill from property_details.listing_events for pre-trigger history.
Climate risk First Street
- Flood 1/10 Low FEMA zone X (unshaded) · 0% chance over 30 yrs
- Wildfire 3/10 Moderate
- Heat 10/10 Extreme 7 d/yr ≥106°F today · 24 d/yr by 30 yrs out
- Wind 10/10 Extreme 99% chance of damaging wind over 30 yrs
- Air quality 2/10 Low 1 unhealthy d/yr today · 1 by 30 yrs out
Nearby sold comps map
Loading sold comps map…
Walkable amenities ~0.75 mi
Loading nearby amenities…
Taxation est. · year 1
- Rental income
- $25,518
- − Mortgage interest
- −$8,957
- − Property taxes
- −$2,398
- − Insurance
- −$800
- − Repairs & maintenance
- −$2,041
- − Management
- −$2,041
- − HOA
- −$3,120
- − Depreciation
- −$4,652
- Taxable income
- $1,508
- Est. tax owed @ 24.0%
- −$362
- After-tax cash flow
- $3,417/yr
For passive investors: Depreciation is non-cash, so a rental often shows a tax loss while cash-flowing — sheltering income. Rental losses are passive: they offset passive income freely, and up to $25,000/yr can offset ordinary (W-2) income if you actively participate and your MAGI is under $100k (phasing out to $0 by $150k); unused losses carry forward. On sale, claimed depreciation is recaptured at up to 25%, and gains may owe capital-gains tax (a 1031 exchange can defer both). Figures are a year-1 estimate at your 24.0% rate — not tax advice; consult a CPA.
Schools (NCES district)
- District
- St. Lucie
- NCES district ID
- 1201770
- Math proficiency
- 40% ▼ -11.00%
- Reading proficiency
- 48% ▼ -4.00%
- Median HH income
- $44,737
- Composite
- 37.28/100
- National rank
- #4449
- State rank
- #51 of 73 in FL
Livability — Indian River Estates
- Score
- 65/100
- State rank
- #653
- US rank
- #12946
Category grades
Schools grade is shown separately in the Schools card above.
Census & demographics
- Census place
- Indian River Estates, FL
- County
- Saint Lucie County · 337,150 people
- City population
- 27,447
- Metro
- Port St. Lucie, FL
- Population (ZIP)
- 31,143
- Household income
- $54,082
- Rent vs Own
- Severe rent burden
- 1086.0
Population outlook (St. Lucie County) Hauer SSP2
- Today (2025)
- 338,016 people
- By 2030
- 355,687 · +5.2%
- By 2040
- 385,521 · +14.1%
- By 2050
- 406,106 · +20.1%
- By 2075
- 441,054 · +30.5%
- By 2100
- 436,885 · +29.2%
Race, ethnicity, and origin ACS 2023
- Neighborhood character
- Majority White (62%)
- Race & ethnicity
- White 62% Hispanic / Latino 22% Two or more races 12% Black 12%
- Hispanic origin (detail)
- Mexican 10% Puerto Rican 3% Cuban 3%
- Common ancestry
- Italian 7% Hispanic 2% Lithuanian 1%
- Foreign-born
- 12% · Canada
- Languages at home
- 80% English-only · Spanish 16% French/Haitian/Cajun 3%
Political lean MEDSL · St. Lucie
- 2024 margin
- Lean R (+9.1) · D 45.1% · R 54.2%
- 2008→2024 swing
- -21.2pp toward R · 2008: 12.1pp · 2024: -9.1pp
- All cycles
- 2024: R+9.1 2020: R+1.6 2016: R+2.5 2012: D+7.9 2008: D+12.1
Not yet ingested
- Civics
- —
Market trends
- HPI YoY
- ▼ -199.47%
- Current HPI
- 397.2649
- Rent YoY
- ▲ 7.42%
- Metro
- Port St. Lucie, FL
- State GDP YoY
- ▲ 3.28%
- F500 in state
- 36
Industry mix (Fortune 500 HQ in FL)
| Industry | F500 HQs | Revenue |
|---|---|---|
| Industrial Technology | 2 | $29B |
|
||
| Insurance | 2 | $17B |
|
||
| Retail | 1 | $60B |
|
||
| Technology Distribution | 1 | $58B |
|
||
| Homebuilding | 1 | $35B |
|
||
| Technology Manufacturing | 1 | $35B |
|
||
Price history
+6.6% since first listed2 events — show timeline
- 2026-06-15 Listed $159,900 Beaches MLS
- 2007-04-20 Sold (Public Records) $150,000 Public Records
Property tax history
-19.1%/yrLatest (2025): $79 · -85.6% YoY. Source: county tax records.
Cash-flow waterfall
monthlySold comps — $/sqft
last 12 mo · ≤1 miLoading sold comps…