 Multi-family
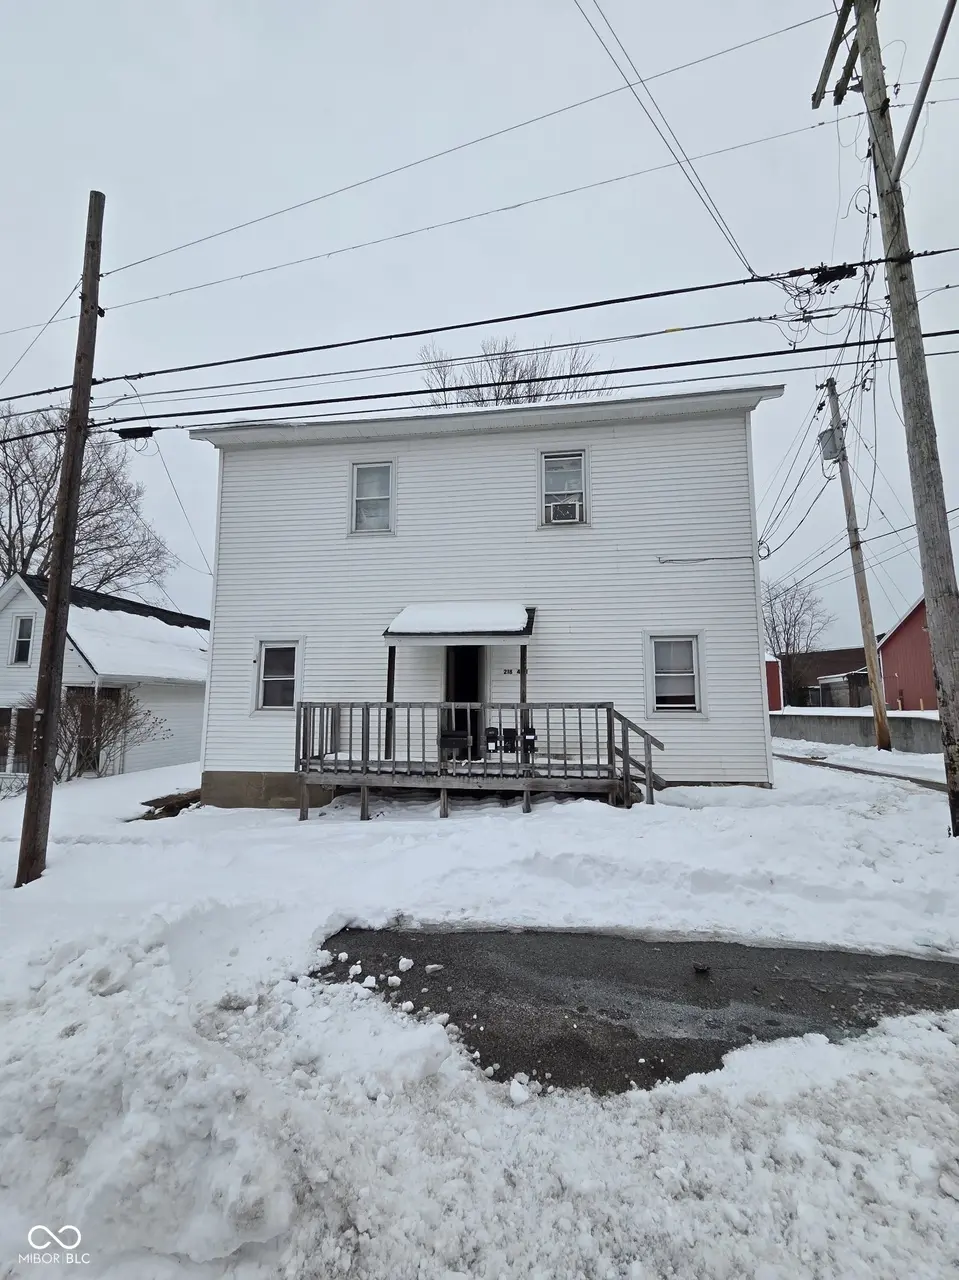
218 4th St · North Vernon, IN
Flood risk 1/10 · Minimal
- FEMA flood zone
- X (unshaded)
- Chance of flooding over 30 yrs
- 0.0%
- Est. flood insurance / yr
- $507 – $1,088
Fire risk 1/10 · Minimal
- Est. fire insurance / yr
- $717 – $1,331
Heat risk 4/10 · Minor
- Hot days now (above 105°F)
- 7 days/yr
- Hot days in 30 yrs
- 19 days/yr
Wind risk 2/10 · Minimal
- Chance of severe wind over 30 yrs
- 1.0%
Air-quality risk 2/10 · Minimal
- Unhealthy air days now
- 0 days/yr
- Unhealthy air days in 30 yrs
- 1 days/yr
Risk factors via First Street. Map © Google.
Why this score? — see what drove the B- grade
The composite is a weighted blend of 9 inputs, each scored 0–100. Each bar is that input's sub-score; the figure is the points it added to the 100-point composite (weight × sub-score).
- Cash flow +30.0/30.0
- 1% rule +10.0/10.0
- DSCR +10.0/10.0
- ARV discount +7.5/15.0
- Livability +4.0/5.0
- Schools +3.0/10.0
- Rent growth +2.5/5.0
- Condition / age +2.5/5.0
- Appreciation +0.0/10.0
$150,000
🖨 Deal sheet 📄 Offer letter ✓ Due diligence
Multi-family units
County records classify this as Multi-Family (2-4 Unit). Listing-text estimate: 1 unit. estimate disagrees with records
Listing remarks MLS
Value-Add 4-Unit Residential Investment | Cash Flow + Upside | Walkable Downtown Location This 4-unit residential investment property offers investors a rare combination of current income, immediate upside, and long-term appreciation potential in a strategic, walkable location near downtown. At full occupancy, the property generates $2,540 in monthly revenue, with one unit currently vacant, providing a clear opportunity for a buyer to increase income from day one. With targeted capital improvements, market rents support projected income of $3,000+ per month, making this an attractive cash-flowing asset and value-add play. The property is already supported by a high-quality, professional property management company, allowing for a passive ownership experience-ideal for both seasoned investors and those looking to scale without adding operational burden. Situated within walking distance to downtown, the property benefits from a location that continues to strengthen as the area sees ongoing public and private investment, supporting future rent growth and appreciation over time. Investment Highlights: 4-unit residential property $2,540/month at full occupancy One vacant unit provides immediate upside Market rent potential of $3,000+ per month Value-add opportunity through capital improvements Professional property management in place Walkable to downtown with long-term appreciation potential This is an excellent opportunity to acquire a stabilizing asset with built-in upside in a growing downtown corridor-perfect for investors seeking reliable cash flow today and equity growth tomorrow. For financials, additional details, or to schedule a showing, reach out today.
Key facts
- Immediate upside
- 7,100 sq ft lot
- Built 1868
Tags
Neighborhood map
What this means for you Summary
Snapshot
- This is a 4-bed/3.0-bath multifamily listed at $150k.
Deal economics
- At list price, monthly cash flow is $3k ($31k/yr) — positive.
- The deal already cash-flows at list — no discount required.
- Meets the 1% rule at list price ($5k rent vs $150k).
- Recommended offer: $136k (9.0% below list) — sets the bar for market timing.
- Cap rate 27.3% vs local median 4.1% in North Vernon — top-decile yield for the area; either an underpriced asset or a hidden risk that comps aren't pricing in. Stress-test before assuming the spread holds.
Location & tenants
- Location reads 79/100 on livability (#29 in IN, #2,347 nationally) — a middle-class / working-renter tenant base. Strengths: cost of living A+, housing A+, health & safety A+; Watch: amenities D, schools D-, commute F.
- Jennings County School Corporation (rural): math 32% / reading 38% proficiency, ranked #194 of 301 in IN (top 64%) — families likely to look elsewhere, expect single-tenant / working-renter base with shorter leases.
- Market conditions: 160 active listings in the ZIP; 84 units permitted in Jennings County in 2024 (0 in 5+ unit buildings).
Forward outlook
- Local home prices are declining (-3.0%/yr); year-one equity from $1k of loan paydown is wiped out by about $4k of value loss. Plan a longer hold.
- Jennings County population projected at -21% by 2050 — secular population decline; favor cash flow + early exit over multi-decade hold.
- At projected returns (-3.0% appreciation + 3.0% rent growth), your $42k cash investment doubles in ~2 years — after that, you're playing with house money.
Negotiation context
- It's been on market 104 days — a 9% lower offer ($136k) is reasonable based on typical stale-listing flexibility.
- 4 sale attempts since 16y ago with the ask held roughly flat each time — persistent listings suggest the price (not the market) is what's stuck; bring a comps-based counter.
- Current owner paid $23k; list at $150k implies a 552% gain — meaningful room to come down on a strong offer.
Risks & watch-outs
- Watch-outs: built in 1868 — expect roof / HVAC / electrical / plumbing capex.
Questions for the listing agent
- It's been on market 104 days. Have you received any prior offers? Is the seller open to a 9% concession, seller financing, or rate buy-down credit?
- Built in 1868 — when were the roof, HVAC, electrical panel, plumbing, and water heater last replaced?
- Why hasn't it sold? Are there any deal-killer items the seller is aware of (foundation, flood, title, zoning, code violations)?
- Is there a deadline driving the sale (1031 exchange, divorce, estate, relocation)? That informs how much negotiation room exists.
- Schools are D-rated, which usually means shorter tenancies and higher turnover. Who's the typical renter profile here, and what's been the actual vacancy rate?
- What's the average days-on-market for RENTAL listings here right now (not sales)? A rising rental-DOM trend means longer vacancies and softer asking-rent achievability than the comps imply.
- What's the recent tenant-quality profile in this submarket — average credit score on applications, eviction rate, late-payment / NSF rate, and stable-employment percentage? A property-management company in the area should have these aggregated.
- How much new apartment / multifamily construction is in the pipeline within 1–3 miles? Heavy new supply (>2% of stock underway) typically softens rents 12–24 months out; light construction supports rent growth.
Investment metrics
- 1% rule
- 3.03% ✓
- Cap rate
- 27.27%
- Cash-on-cash
- 74.93%
- DSCR
- 4.33
- GRM
- 2.7
CMA / ARV
No comps found within radius.
Projected returns pro-forma
-3.0% appreciation · 3.0% rent growth · sell at horizon
- IRR
- 74.8%
- Equity multiple
- 4.40×
- Total profit
- $142,756
- Equity at exit
- $22,365
- IRR
- 78.5%
- Equity multiple
- 9.08×
- Total profit
- $339,508
- Equity at exit
- $12,969
Cash invested: $42,000 (down + closing). Projections, not guarantees.
Landlord ↔ Tenant lean methodology
- Overall (STATE)
- 90 Strongly Landlord-Friendly
- State Indiana
- 90 Strongly Landlord-Friendly · R+11
- County
- — inherits STATE
- City
- — inherits STATE
ZIP-level market 47265
- Home prices YoY
- -31.5%
- Active inventory
- 160
- Price-to-rent
- 11.0×
Monthly cashflow live
- Estimated rent
- $4,549 medium interval (Pro) →
- Mortgage (P&I)
- −$787
- Tax from tax record
- −$122 /mo · $1,464/yr
- Insurance
- −$62
- HOA
- −$0
- Vacancy / Maint / Mgmt
- −$955
- Net cashflow
- $2,623
Break-even live
4-unit breakdown (identical units grouped — click to expand)
| Units | Beds | Baths | Est. rent |
|---|---|---|---|
| 4× units | 4 | 4 | $4,548 |
| #1 | 4 | 4 | $1,137 |
| #2 | 4 | 4 | $1,137 |
| #3 | 4 | 4 | $1,137 |
| #4 | 4 | 4 | $1,137 |
| Total (4 units) | $4,549 | ||
UW: 25.0% down · 7.5% · 30yr · 1.5% tax · 5.0% vac · 8.0% maint · 8.0% mgmt
Financing live
Cash to close
- Down payment
- $37,500
- Closing costs
- $4,500
- Reserves months
- —
- Total cash needed
- —
Loan-product check · same deal, 3 products live
Conventional
25% down · 7.5% · 30yr
- Down + closing
- —
- Monthly P&I
- —
- Monthly cashflow
- —
- DSCR
- —
- Eligible?
- —
Personal DTI + credit; lowest rate.
DSCR
20% down · 8.5% · 30yr
- Down + closing
- —
- Monthly P&I
- —
- Monthly cashflow
- —
- DSCR
- —
- Eligible?
- —
No personal income docs; deal must DSCR.
Hard money
10% down · 12.0% · 12mo
- Down + closing
- —
- Monthly P&I
- —
- Monthly cashflow
- —
- DSCR
- —
- Eligible?
- —
Short-term bridge; refi at stabilization.
Listing history 8 events
-
2026-05-19status Pending 1730-char remark
Show marketing remark (1730 chars)
Value-Add 4-Unit Residential Investment | Cash Flow + Upside | Walkable Downtown Location This 4-unit residential investment property offers investors a rare combination of current income, immediate upside, and long-term appreciation potential in a strategic, walkable location near downtown. At full occupancy, the property generates $2,540 in monthly revenue, with one unit currently vacant, providing a clear opportunity for a buyer to increase income from day one. With targeted capital improvements, market rents support projected income of $3,000+ per month, making this an attractive cash-flowing asset and value-add play. The property is already supported by a high-quality, professional property management company, allowing for a passive ownership experience-ideal for both seasoned investors and those looking to scale without adding operational burden. Situated within walking distance to downtown, the property benefits from a location that continues to strengthen as the area sees ongoing public and private investment, supporting future rent growth and appreciation over time. Investment Highlights: 4-unit residential property $2,540/month at full occupancy One vacant unit provides immediate upside Market rent potential of $3,000+ per month Value-add opportunity through capital improvements Professional property management in place Walkable to downtown with long-term appreciation potential This is an excellent opportunity to acquire a stabilizing asset with built-in upside in a growing downtown corridor-perfect for investors seeking reliable cash flow today and equity growth tomorrow. For financials, additional details, or to schedule a showing, reach out today.
-
2026-02-03$150,000 Active 1730-char remark
Show marketing remark (1730 chars)
Value-Add 4-Unit Residential Investment | Cash Flow + Upside | Walkable Downtown Location This 4-unit residential investment property offers investors a rare combination of current income, immediate upside, and long-term appreciation potential in a strategic, walkable location near downtown. At full occupancy, the property generates $2,540 in monthly revenue, with one unit currently vacant, providing a clear opportunity for a buyer to increase income from day one. With targeted capital improvements, market rents support projected income of $3,000+ per month, making this an attractive cash-flowing asset and value-add play. The property is already supported by a high-quality, professional property management company, allowing for a passive ownership experience-ideal for both seasoned investors and those looking to scale without adding operational burden. Situated within walking distance to downtown, the property benefits from a location that continues to strengthen as the area sees ongoing public and private investment, supporting future rent growth and appreciation over time. Investment Highlights: 4-unit residential property $2,540/month at full occupancy One vacant unit provides immediate upside Market rent potential of $3,000+ per month Value-add opportunity through capital improvements Professional property management in place Walkable to downtown with long-term appreciation potential This is an excellent opportunity to acquire a stabilizing asset with built-in upside in a growing downtown corridor-perfect for investors seeking reliable cash flow today and equity growth tomorrow. For financials, additional details, or to schedule a showing, reach out today.
-
2016-04-13historical
-
2016-01-11$49,900 Active
-
2015-05-07soldstatus $23,000 Sold
-
2013-02-02$27,000
-
2011-10-31historical
-
2010-11-12$29,000
ⓘ Source: listings_history table (triggers on properties + properties_extension) + one-shot
backfill from property_details.listing_events for pre-trigger history.
Tax reassessment forecast IN · Partial reset (capped growth)
- Current annual tax
- $1,464 · $122/mo
- Projected year-2 tax
- $1,464 · $122/mo
- Expected delta
- $0/yr ($0/mo · 0.0%)
ⓘ Screening estimate from a state-policy table — verify with the county assessor before closing.
Climate risk First Street
- Flood 1/10 Low FEMA zone X (unshaded) · 0% chance over 30 yrs
- Wildfire 1/10 Low
- Heat 4/10 Moderate 7 d/yr ≥105°F today · 19 d/yr by 30 yrs out
- Wind 2/10 Low 100% chance of damaging wind over 30 yrs
- Air quality 2/10 Low 0 unhealthy d/yr today · 1 by 30 yrs out
Nearby sold comps map
Loading sold comps map…
Walkable amenities ~0.75 mi
Loading nearby amenities…
Taxation est. · year 1
- Rental income
- $54,588
- − Mortgage interest
- −$8,402
- − Property taxes
- −$1,464
- − Insurance
- −$750
- − Repairs & maintenance
- −$4,367
- − Management
- −$4,367
- − Depreciation
- −$4,364
- Taxable income
- $30,874
- Est. tax owed @ 24.0%
- −$7,410
- After-tax cash flow
- $24,061/yr
For passive investors: Depreciation is non-cash, so a rental often shows a tax loss while cash-flowing — sheltering income. Rental losses are passive: they offset passive income freely, and up to $25,000/yr can offset ordinary (W-2) income if you actively participate and your MAGI is under $100k (phasing out to $0 by $150k); unused losses carry forward. On sale, claimed depreciation is recaptured at up to 25%, and gains may owe capital-gains tax (a 1031 exchange can defer both). Figures are a year-1 estimate at your 24.0% rate — not tax advice; consult a CPA.
Schools (NCES district)
- District
- Jennings County School Corporation
- NCES district ID
- 1805190
- Math proficiency
- 32% ▼ -11.00%
- Reading proficiency
- 38% ▼ -6.00%
- Median HH income
- $45,418
- Composite
- 29.89/100
- National rank
- #6394
- State rank
- #194 of 301 in IN
Livability — North Vernon
- Score
- 79/100
- State rank
- #29
- US rank
- #2347
Category grades
Schools grade is shown separately in the Schools card above.
Census & demographics
- Census place
- North Vernon, IN
- City population
- 20,981
- Population (ZIP)
- 20,981
Population outlook (Jennings County) Hauer SSP2
- Today (2025)
- 26,584 people
- By 2030
- 25,591 · -3.7%
- By 2040
- 23,423 · -11.9%
- By 2050
- 20,973 · -21.1%
- By 2075
- 15,445 · -41.9%
- By 2100
- 10,714 · -59.7%
Race, ethnicity, and origin ACS 2023
- Neighborhood character
- Predominantly White (92%)
- Race & ethnicity
- White 92% Hispanic / Latino 4% Two or more races 3%
- Common ancestry
- Slovak 2% Romanian 1% Italian 1%
- Foreign-born
- 1% · Canada
- Languages at home
- 96% English-only · Spanish 2% German/W. Germanic 1%
Political lean MEDSL · Jennings
- 2024 margin
- Solid R (+58.8) · D 19.7% · R 78.5% · Other 1.8%
- 2008→2024 swing
- -50.8pp toward R · 2008: -8.0pp · 2024: -58.8pp
- All cycles
- 2024: R+58.8 2020: R+56.9 2016: R+52.7 2012: R+22.4 2008: R+8.0
Not yet ingested
- Civics
- —
Market trends
- HPI YoY
- ▼ -107.36%
- Current HPI
- 233.0275
- Rent YoY
- —
- Metro
- —
- State GDP YoY
- ▲ 2.90%
- F500 in state
- 18
Industry mix (Fortune 500 HQ in IN)
| Industry | F500 HQs | Revenue |
|---|---|---|
| Industrial Machinery | 2 | $37B |
|
||
| Healthcare | 1 | $177B |
|
||
| Pharmaceuticals | 1 | $45B |
|
||
| Metals / Steel | 1 | $18B |
|
||
| Agriculture | 1 | $17B |
|
||
| Packaging | 1 | $12B |
|
||
Price history
+417.2% since first listed8 events — show timeline
- 2026-05-19 Pending — MIBOR as Distributed by MLS Grid
- 2026-02-03 Listed $150,000 MIBOR as Distributed by MLS Grid
- 2016-04-13 Listing Removed — MIBOR as Distributed by MLS Grid
- 2016-01-11 Listed $49,900 MIBOR as Distributed by MLS Grid
- 2015-05-07 Sold (MLS) $23,000 MIBOR as Distributed by MLS Grid
- 2013-02-02 Listed $27,000 MIBOR as Distributed by MLS Grid
- 2011-10-31 Listing Removed — MIBOR as Distributed by MLS Grid
- 2010-11-12 Listed $29,000 MIBOR as Distributed by MLS Grid
Property tax history
-1.2%/yrLatest (2024): $1,464 · +10.6% YoY. Source: county tax records.
Cash-flow waterfall
monthlySold comps — $/sqft
last 12 mo · ≤1 miLoading sold comps…