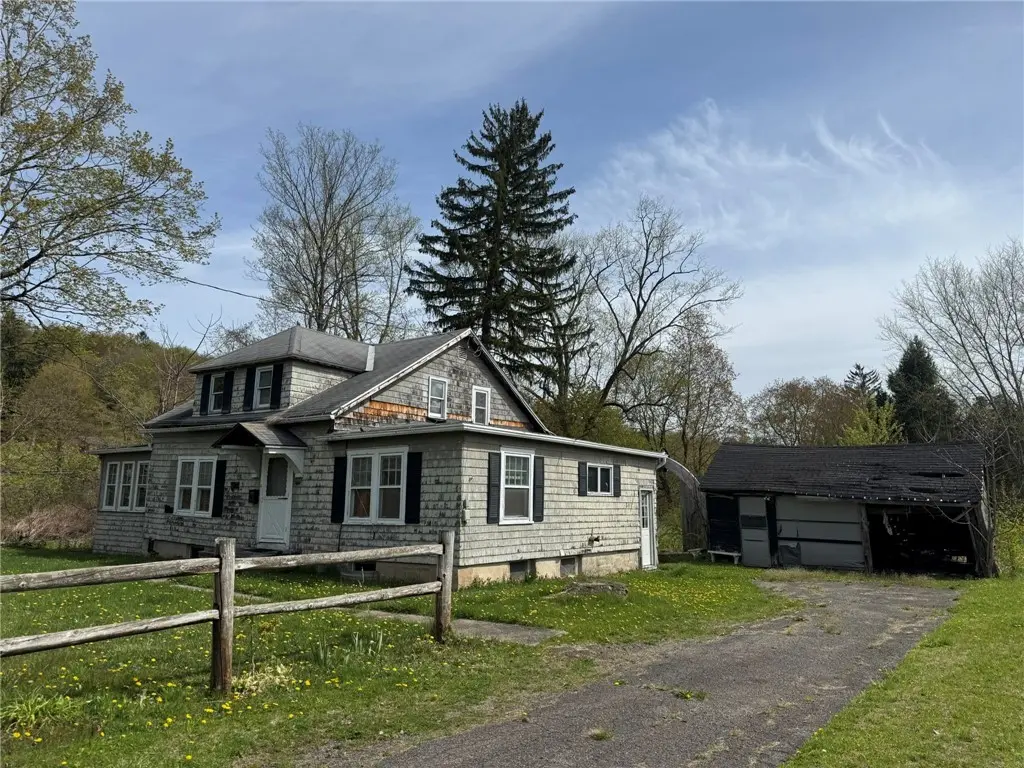
50 Bridge St · Sidney, NY
Flood risk 6/10 · Moderate
- FEMA flood zone
- AE
- Chance of flooding over 30 yrs
- 0.27%
- Est. flood insurance / yr
- $2,026 – $9,024
Fire risk 1/10 · Minimal
- Est. fire insurance / yr
- $691 – $1,283
Heat risk 2/10 · Minimal
- Hot days now (above 92°F)
- 7 days/yr
- Hot days in 30 yrs
- 16 days/yr
Wind risk 2/10 · Minimal
- Chance of severe wind over 30 yrs
- 1.0%
Air-quality risk 2/10 · Minimal
- Unhealthy air days now
- 0 days/yr
- Unhealthy air days in 30 yrs
- 1 days/yr
Risk factors via First Street. Map © Google.
Why this score? — see what drove the B+ grade
The composite is a weighted blend of 9 inputs, each scored 0–100. Each bar is that input's sub-score; the figure is the points it added to the 100-point composite (weight × sub-score).
- Cash flow +30.0/30.0
- 1% rule +10.0/10.0
- DSCR +10.0/10.0
- ARV discount +7.5/15.0
- Appreciation +6.3/10.0
- Schools +3.8/10.0
- Livability +3.5/5.0
- Rent growth +2.5/5.0
- Condition / age +2.5/5.0
$39,900
🖨 Deal sheet 📄 Offer letter ✓ Due diligence
Listing remarks
Opportunity Knocking! 4 bedroom and 1 and 1/2 bath home at 50 Bridge Street in the Village of Sidney is a true Fixer-Upper with incredible potential. Strong investment potential for resale or rental income. Generous lot with room for improvements. Sits back from the river on a quiet brick lined street walking distance to downtown. Selling at appraised value. Bring your vision to renovate and build equity. Must be cash sale.
Key facts
- Generous lot
- 0.31 acre lot
- Garage
Tags
Property features AI
Exterior
- Parking: Detached garage (1 car)
- Utilities: Public water connected; Sewer connected
- Home design: Single-story home; Frame construction with wood siding; Resale fixer condition
- Construction: Block and stone foundation
- Exterior features: Gravel driveway; River access and stream frontage on Susquehanna River
Interior
- Kitchen: Country-style kitchen
- Bedrooms: Total rooms: 9 (includes living spaces such as den, family room, living room)
- Flooring: Carpet; Hardwood; Vinyl; Varied flooring
- Bathrooms: 1 full bathroom; 1 half bathroom; One main-level bathroom
- Heating & cooling: Oil heating; Baseboard heating; Hot water heat
- Interior features: Den; Separate/formal living room; Country kitchen; Full basement; Fireplace (1)
- Laundry & utility: Laundry located in basement; Electric water heater
Neighborhood map
What this means for you Summary
Snapshot
- This is a 4-bed/1.5-bath single-family listed at $40k.
Deal economics
- At list price, monthly cash flow is $457 ($5k/yr) — positive.
- The deal already cash-flows at list — no discount required.
- Meets the 1% rule at list price ($2k rent vs $40k).
- Cap rate 33.9% vs local median 5.9% in Sidney — top-decile yield for the area; either an underpriced asset or a hidden risk that comps aren't pricing in. Stress-test before assuming the spread holds.
Location & tenants
- Location reads 69/100 on livability (#476 in NY) — a middle-class / working-renter tenant base. Strengths: cost of living A+, health & safety A+, housing A; Watch: schools D+, employment D, amenities F.
- Sidney Central School District (town): math 44% / reading 47% proficiency, ranked #462 of 590 in NY (top 78%) — families likely to look elsewhere, expect single-tenant / working-renter base with shorter leases.
- Market conditions: 32 active listings in the ZIP; 66 units permitted in Delaware County in 2024 (0 in 5+ unit buildings).
Forward outlook
- In year one you build about $1k of equity ($276 loan paydown + $1k appreciation (2.6% local appreciation)).
- Delaware County population projected at -27% by 2050 — secular population decline; favor cash flow + early exit over multi-decade hold.
- At projected returns (2.6% appreciation + 3.0% rent growth), your $11k cash investment doubles in ~2 years — after that, you're playing with house money.
Negotiation context
- Only 5 days on market — expect competitive offers; lowballing is unlikely to land.
Risks & watch-outs
- Watch-outs: flood insurance adds $460/mo; built in 1940 — expect roof / HVAC / electrical / plumbing capex.
- Climate carrying-cost: in FEMA flood zone AE (mandatory federal flood insurance) — expect insurance premiums to compound above CPI over the hold.
Questions for the listing agent
- Built in 1940 — when were the roof, HVAC, electrical panel, plumbing, and water heater last replaced?
- What's the actual annual flood-insurance premium (NFIP or private), and is the property in a SFHA with mandatory coverage?
- Is there a deadline driving the sale (1031 exchange, divorce, estate, relocation)? That informs how much negotiation room exists.
- Schools are D-rated, which usually means shorter tenancies and higher turnover. Who's the typical renter profile here, and what's been the actual vacancy rate?
- What's the average days-on-market for RENTAL listings here right now (not sales)? A rising rental-DOM trend means longer vacancies and softer asking-rent achievability than the comps imply.
- What's the recent tenant-quality profile in this submarket — average credit score on applications, eviction rate, late-payment / NSF rate, and stable-employment percentage? A property-management company in the area should have these aggregated.
- How much new for-sale + rental construction is in the pipeline within 1–3 miles? Heavy new supply typically softens prices + rents 12–24 months out; constrained supply supports both.
Investment metrics
- 1% rule
- 3.78% ✓
- Cap rate
- 33.88%
- Cash-on-cash
- 98.53%
- DSCR
- 5.38
- GRM
- 2.2
CMA / ARV
- ARV (median comp)
- $137,234
- List price
- $39,900
- Delta
- -70.93%
- Verdict
- UNDERPRICED
- Comps
- 20 within 1.0 mi
Show comp detail 6 sales within ~0.75 mi
| Address | Dist | Beds/Ba | Sqft | Sold | Price | $/sf | Match |
|---|---|---|---|---|---|---|---|
| 8 Weir St | 0.39mi | 4/3.0 | 1,768 (+1%) | 23mo | $65,000 | $37 | 55 |
| 76 Main St W | 0.34mi | 3/1.0 (-1) | 1,808 (+3%) | 22mo | $112,000 | $62 | 54 |
| 30 W Main St | 0.61mi | 3/2.0 (-1) | 1,816 (+4%) | 12mo | $80,000 | $44 | 49 |
| 5 Chestnut St | 0.51mi | 3/2.0 (-1) | 1,638 (-7%) | 11mo | $150,000 | $92 | 49 |
| 68 River St | 0.56mi | 3/1.5 (-1) | 1,558 (-11%) | 16mo | $95,000 | $61 | 37 |
| 121 Skyline Dr | 0.51mi | 3/2.5 (-1) | 1,960 (+12%) | 21mo | $285,000 | $145 | 30 |
Match score weights: distance 35% · size 25% · config 20% · recency 20%. Top-matched comps best support the ARV.
Projected returns pro-forma
2.6% appreciation · 3.0% rent growth · sell at horizon
- IRR
- 54.1%
- Equity multiple
- 3.99×
- Total profit
- $33,384
- Equity at exit
- $17,060
- IRR
- 54.2%
- Equity multiple
- 8.12×
- Total profit
- $79,533
- Equity at exit
- $25,625
Cash invested: $11,172 (down + closing). Projections, not guarantees.
Landlord ↔ Tenant lean methodology
- Overall (STATE)
- 15 Strongly Tenant-Friendly
- State New York
- 15 Strongly Tenant-Friendly · D+10
- County
- — inherits STATE
- City
- — inherits STATE
ZIP-level market 13838
- Home prices YoY
- 0.8%
- Active inventory
- 32
- Price-to-rent
- 2.2×
Monthly cashflow live
- Estimated rent
- $1,510 medium interval (Pro) →
- Mortgage (P&I)
- −$209
- Tax est. 1.5%
- −$50 /mo · $598/yr
- Insurance
- −$17
- Flood insurance flood zone
- −$460 /mo · $5,525/yr
- HOA
- −$0
- Vacancy / Maint / Mgmt
- −$317
- Net cashflow
- $457
Break-even live
UW: 25.0% down · 7.5% · 30yr · 1.5% tax · 5.0% vac · 8.0% maint · 8.0% mgmt
Financing live
Cash to close
- Down payment
- $9,975
- Closing costs
- $1,197
- Reserves months
- —
- Total cash needed
- —
Loan-product check · same deal, 3 products live
Conventional
25% down · 7.5% · 30yr
- Down + closing
- —
- Monthly P&I
- —
- Monthly cashflow
- —
- DSCR
- —
- Eligible?
- —
Personal DTI + credit; lowest rate.
DSCR
20% down · 8.5% · 30yr
- Down + closing
- —
- Monthly P&I
- —
- Monthly cashflow
- —
- DSCR
- —
- Eligible?
- —
No personal income docs; deal must DSCR.
Hard money
10% down · 12.0% · 12mo
- Down + closing
- —
- Monthly P&I
- —
- Monthly cashflow
- —
- DSCR
- —
- Eligible?
- —
Short-term bridge; refi at stabilization.
Listing history 2 events
-
2026-05-11status Pending 427-char remark
-
2026-05-06$39,900 Active 427-char remark
ⓘ Source: listings_history table (triggers on properties + properties_extension) + one-shot
backfill from property_details.listing_events for pre-trigger history.
Climate risk First Street
- Flood 6/10 Major FEMA zone AE · 27% chance over 30 yrs
- Wildfire 1/10 Low
- Heat 2/10 Low 7 d/yr ≥92°F today · 16 d/yr by 30 yrs out
- Wind 2/10 Low 100% chance of damaging wind over 30 yrs
- Air quality 2/10 Low 0 unhealthy d/yr today · 1 by 30 yrs out
Nearby sold comps map
Loading sold comps map…
Walkable amenities ~0.75 mi
Loading nearby amenities…
Taxation est. · year 1
- Rental income
- $18,122
- − Mortgage interest
- −$2,235
- − Property taxes
- −$598
- − Insurance
- −$5,724
- − Repairs & maintenance
- −$1,450
- − Management
- −$1,450
- − Depreciation
- −$1,161
- Taxable income
- $5,504
- Est. tax owed @ 24.0%
- −$1,321
- After-tax cash flow
- $4,162/yr
For passive investors: Depreciation is non-cash, so a rental often shows a tax loss while cash-flowing — sheltering income. Rental losses are passive: they offset passive income freely, and up to $25,000/yr can offset ordinary (W-2) income if you actively participate and your MAGI is under $100k (phasing out to $0 by $150k); unused losses carry forward. On sale, claimed depreciation is recaptured at up to 25%, and gains may owe capital-gains tax (a 1031 exchange can defer both). Figures are a year-1 estimate at your 24.0% rate — not tax advice; consult a CPA.
Schools (NCES district)
- District
- Sidney Central School District
- NCES district ID
- 3626850
- Math proficiency
- 44% ▼ -2.00%
- Reading proficiency
- 47% ▲ 5.00%
- Median HH income
- $42,110
- Composite
- 38.29/100
- National rank
- #4232
- State rank
- #462 of 590 in NY
Livability — Sidney
- Score
- 69/100
- State rank
- #476
- US rank
- #8397
Category grades
Schools grade is shown separately in the Schools card above.
Census & demographics
- Census place
- Sidney, NY
- Population (ZIP)
- 4,185
Population outlook (Delaware County) Hauer SSP2
- Today (2025)
- 42,668 people
- By 2030
- 40,337 · -5.5%
- By 2040
- 35,514 · -16.8%
- By 2050
- 31,265 · -26.7%
- By 2075
- 24,455 · -42.7%
- By 2100
- 19,529 · -54.2%
Race, ethnicity, and origin ACS 2023
- Neighborhood character
- Predominantly White (86%)
- Race & ethnicity
- White 86% Two or more races 12% Hispanic / Latino 8% Black 2%
- Hispanic origin (detail)
- Common ancestry
- Romanian 10% Iranian 9% Lithuanian 4%
- Foreign-born
- 1%
- Languages at home
- 92% English-only · German/W. Germanic 5% Other Asian/Pacific 2% Spanish 2%
Political lean MEDSL · Delaware
- 2024 margin
- R (+19.8) · D 40.1% · R 59.9%
- 2008→2024 swing
- -14.6pp toward R · 2008: -5.2pp · 2024: -19.8pp
- All cycles
- 2024: R+19.8 2020: R+18.4 2016: R+29.2 2012: R+9.6 2008: R+5.2
Not yet ingested
- Civics
- —
Market trends
- HPI YoY
- ▲ 2.60%
- Current HPI
- 324.4858
- Rent YoY
- —
- Metro
- —
- State GDP YoY
- ▲ 2.60%
- F500 in state
- 92
Industry mix (Fortune 500 HQ in NY)
| Industry | F500 HQs | Revenue |
|---|---|---|
| Financial Services | 10 | $950B |
|
||
| Consumer Goods | 9 | $162B |
|
||
| Insurance | 4 | $225B |
|
||
| Telecommunications | 2 | $144B |
|
||
| Pharmaceuticals | 2 | $112B |
|
||
| Media / Entertainment | 2 | $69B |
|
||
Price history
2 events — show timeline
- 2026-05-11 Pending — UNYREIS
- 2026-05-06 Listed $39,900 UNYREIS
Property tax history
+2.8%/yrLatest (2025): $4,398 · +2.0% YoY. Source: county tax records.
Cash-flow waterfall
monthlySold comps — $/sqft
last 12 mo · ≤1 miLoading sold comps…