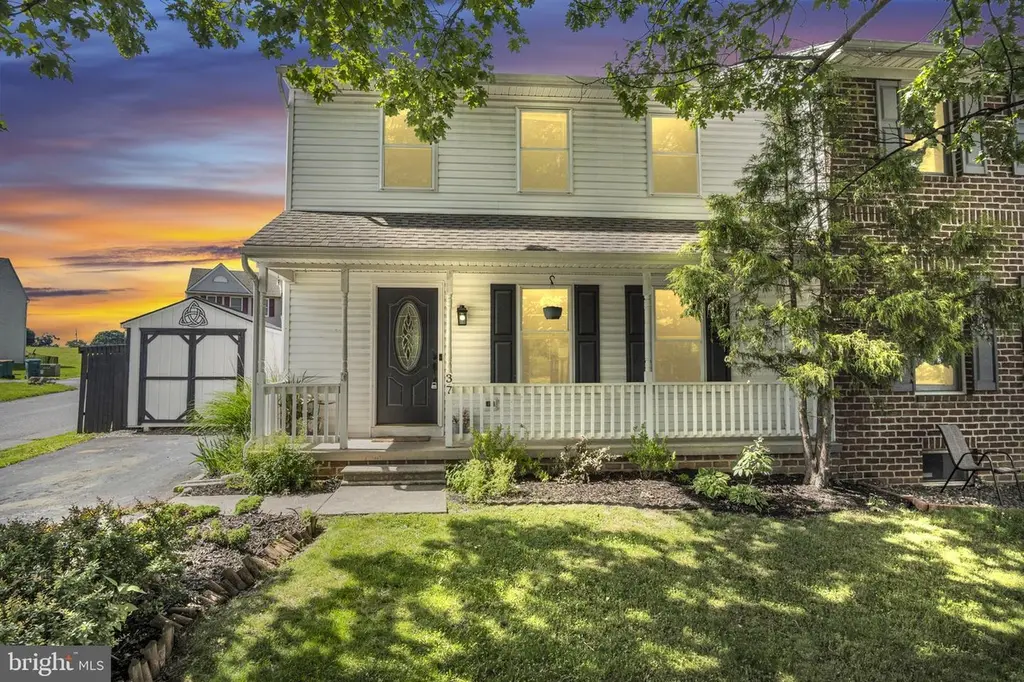
37 Brian Dr · Carlisle, PA
Flood risk 1/10 · Minimal
- FEMA flood zone
- X (unshaded)
- Chance of flooding over 30 yrs
- 0.0%
- Est. flood insurance / yr
- $507 – $1,088
Fire risk 1/10 · Minimal
- Est. fire insurance / yr
- $511 – $949
Heat risk 5/10 · Moderate
- Hot days now (above 101°F)
- 7 days/yr
- Hot days in 30 yrs
- 15 days/yr
Wind risk 3/10 · Minor
- Chance of severe wind over 30 yrs
- 4.0%
Air-quality risk 2/10 · Minimal
- Unhealthy air days now
- 1 days/yr
- Unhealthy air days in 30 yrs
- 3 days/yr
Risk factors via First Street. Map © Google.
Why this score? — see what drove the D+ grade
The composite is a weighted blend of 9 inputs, each scored 0–100. Each bar is that input's sub-score; the figure is the points it added to the 100-point composite (weight × sub-score).
- Cash flow +14.0/30.0
- ARV discount +10.8/15.0
- Schools +4.8/10.0
- DSCR +4.2/10.0
- Livability +3.9/5.0
- 1% rule +3.5/10.0
- Rent growth +2.5/5.0
- Condition / age +2.5/5.0
- Appreciation +0.0/10.0
$259,900
🖨 Deal sheet (PDF) 📄 Offer letter ✓ Due diligence
Listing remarks MLS
Immaculately kept 3 bedroom, 2.5 bath, semi-detached townhome in South Middleton. One Owner! Close to shopping, major highways, and medical offices. Enjoy privacy with a master bedroom boasting an en suite and large walk in closet! The oversized deck is perfect for backyard privacy and entertaining! Bonus room in basement could be 4th bedroom, office space, play room, the possibilities are endless. This one is a must see! Won't last long. Call for a private showing today!
Key facts
- Close to schools
- Raised garden beds
- Finished basement
Tags
Property features AI
Finance
- Other: Above-grade finished area approximately estimated; Below-grade finished area approximately 621 (estimated)
- HOA & community: HOA fee $126 annually
Exterior
- Parking: Two driveway spaces; Driveway and on-street parking (total 2 garage/parking spaces)
- Utilities: Public water; Public sewer; 200+ amp electric service; Natural gas hot water and heating
- Home design: End of row townhouse; Fee simple ownership
- Construction: Stick-built construction; Block foundation
- Exterior features: Deck(s); Porch(es); Outbuilding(s) / shed; Sidewalks; Not in a federal flood zone; 2+ access exits
Interior
- Bedrooms: Three bedrooms on the upper level
- Bathrooms: Two full bathrooms; One half bathroom on the main level
- Heating & cooling: Forced air heating; Heat pump cooling (electric)
- Interior features: Fully finished basement with full height; Den; Office
- Laundry & utility: Laundry on the lower floor
Neighborhood map
What this means for you Summary
Snapshot
- This is a 3-bed/2.5-bath townhouse listed at $260k.
Deal economics
- At list price, monthly cash flow is $33 ($401/yr) — positive.
- The deal already cash-flows at list — no discount required.
- To meet the 1% rule (rent ≥ 1% of price), the offer needs to be $222k (14.6% below list).
- Recommended offer: $222k (14.6% below list) — sets the bar for 1% rule.
- Cap rate 6.4% vs local median 3.7% in Carlisle — top-decile yield for the area; either an underpriced asset or a hidden risk that comps aren't pricing in. Stress-test before assuming the spread holds.
Location & tenants
- Location reads 78/100 on livability (#297 in PA, #2,632 nationally) — a middle-class / working-renter tenant base. Strengths: cost of living A+, housing A+, health & safety A+; Watch: employment C-, amenities D, commute F.
- South Middleton SD (town): math 45% / reading 63% proficiency, ranked #106 of 539 in PA (top 20%) — acceptable for families but not a draw, mixed tenant base, ~2y average lease; only 16% free/reduced lunch — higher-income household profile.
- Zoned schools: W.G. Rice El Sch (432 students, 38% FRL); Yellow Breeches Ms (math 27% / reading 59%, grade D-, #214 of 512 statewide, top 42%, 474 students, 31% FRL); Boiling Springs Hs (math 72% / reading 72%, grade B+, #39 of 437 statewide, top 9%, 777 students, 22% FRL).
- Market conditions: 188 active listings in the ZIP; 9 comparable units currently listed for rent nearby; rentals at typical pace (median 26d on market — plan ~3-4 weeks tenant-placement turnaround); solid renter incomes; 1,052 units permitted in Cumberland County in 2024 (310 in 5+ unit buildings).
- This rent runs 31% of the median local income ($87k/yr) — at the standard rent-burdened threshold; future hikes will face affordability resistance.
Forward outlook
- Local home prices are declining (-3.0%/yr); year-one equity from $2k of loan paydown is wiped out by about $8k of value loss. Plan a longer hold.
- Cumberland County population projected at +17% by 2050 — long-run rental-demand tailwind backs the buy-and-hold thesis.
Negotiation context
- Only 5 days on market — expect competitive offers; lowballing is unlikely to land.
- 2 sale attempts since 5y ago with the ask held roughly flat each time — persistent listings suggest the price (not the market) is what's stuck; bring a comps-based counter.
- Current owner paid $180k; 44% above their basis — modest negotiation headroom, anchor on the comps not their cost.
Risks & watch-outs
- Climate carrying-cost: extreme-heat days projected 7→15/yr by 2055 (HVAC capex compounding) — expect insurance premiums to compound above CPI over the hold.
Questions for the listing agent
- What does the HOA fee cover, when was the last increase, and are there any pending special assessments or reserve-fund shortfalls?
- Is there a deadline driving the sale (1031 exchange, divorce, estate, relocation)? That informs how much negotiation room exists.
- Schools are B-rated — typically a magnet for longer-tenancy family renters. What's the average tenant stay here, and is there a school-zone premium baked into asking?
- The area grade is low — what's the realistic commute time and amenity access for the typical tenant pool here? Any planned neighborhood developments (good or bad) we should know about?
- What's the average days-on-market for RENTAL listings here right now (not sales)? A rising rental-DOM trend means longer vacancies and softer asking-rent achievability than the comps imply.
- What's the recent tenant-quality profile in this submarket — average credit score on applications, eviction rate, late-payment / NSF rate, and stable-employment percentage? A property-management company in the area should have these aggregated.
- How much new for-sale + rental construction is in the pipeline within 1–3 miles? Heavy new supply typically softens prices + rents 12–24 months out; constrained supply supports both.
Investment metrics
- 1% rule
- 0.85% ✗
- Cap rate
- 6.45%
- Cash-on-cash
- 0.55%
- DSCR
- 1.02
- GRM
- 9.8
CMA / ARV
- ARV (on-the-fly)
- $280,288
- Comps found
- 7
Show comp detail 7 sales within ~0.75 mi
| Address | Dist | Beds/Ba | Sqft | Sold | Price | $/sf | Match |
|---|---|---|---|---|---|---|---|
| 310 Fairview St | 0.12mi | 3/1.5 | 1,608 (-13%) | 0mo | $140,000 | $87 | 69 |
| 134 Sable Dr | 0.74mi | 3/2.5 | 1,629 (-12%) | 1mo | $223,000 | $137 | 45 |
| 319 Pelham Ct | 0.74mi | 3/2.5 | 1,584 (-14%) | 8mo | $307,000 | $194 | 35 |
| 317 Pelham Ct | 0.75mi | 3/2.5 | 1,584 (-14%) | 9mo | $240,000 | $152 | 34 |
| 41 Abbey Ct | 0.60mi | 2/2.0 (-1) | 1,588 (-14%) | 11mo | $263,000 | $166 | 32 |
| 202 Sable Dr | 0.69mi | 3/2.5 | 1,629 (-12%) | 23mo | $240,200 | $147 | 29 |
| 22 Abbey Ct | 0.68mi | 2/2.0 (-1) | 1,654 (-10%) | 21mo | $265,000 | $160 | 27 |
Match score weights: distance 35% · size 25% · config 20% · recency 20%. Top-matched comps best support the ARV.
Projected returns pro-forma
-3.0% appreciation · 3.0% rent growth · sell at horizon
- IRR
- -15.4%
- Equity multiple
- 0.45×
- Total profit
- $-39,998
- Equity at exit
- $38,752
- IRR
- -6.9%
- Equity multiple
- 0.56×
- Total profit
- $-32,139
- Equity at exit
- $22,471
Cash invested: $72,772 (down + closing). Projections, not guarantees.
Landlord ↔ Tenant lean methodology
- Overall (STATE)
- 62 Landlord-Friendly
- State Pennsylvania
- 62 Landlord-Friendly · EVEN
- County
- — inherits STATE
- City
- — inherits STATE
ZIP-level market 17015
- Home prices YoY
- -25.2%
- Active inventory
- 188
- Price-to-rent
- 9.8×
Monthly cashflow live
- Estimated rent
- $2,220 high interval (Pro) →
- Mortgage (P&I)
- −$1,363
- Tax from tax record
- −$238 /mo · $2,859/yr
- Insurance
- −$108
- HOA
- −$11
- Vacancy / Maint / Mgmt
- −$466
- Net cashflow
- $33
Break-even live
Sensitivity live
| Price | -10% $181 | -5% $107 | +0% $33 | +5% $-40 | +10% $-114 |
|---|---|---|---|---|---|
| Rent | -10% $-142 | -5% $-54 | +0% $33 | +5% $121 | +10% $209 |
| Rate | -1.0pp $164 | -0.5pp $100 | base $33 | +0.5pp $-34 | +1.0pp $-102 |
UW: 25.0% down · 7.5% · 30yr · 1.5% tax · 5.0% vac · 8.0% maint · 8.0% mgmt
Financing live
Cash to close
- Down payment
- $64,975
- Closing costs
- $7,797
- Reserves months
- —
- Total cash needed
- —
Loan-product check · same deal, 3 products live
Conventional
25% down · 7.5% · 30yr
- Down + closing
- —
- Monthly P&I
- —
- Monthly cashflow
- —
- DSCR
- —
- Eligible?
- —
Personal DTI + credit; lowest rate.
DSCR
20% down · 8.5% · 30yr
- Down + closing
- —
- Monthly P&I
- —
- Monthly cashflow
- —
- DSCR
- —
- Eligible?
- —
No personal income docs; deal must DSCR.
Hard money
10% down · 12.0% · 12mo
- Down + closing
- —
- Monthly P&I
- —
- Monthly cashflow
- —
- DSCR
- —
- Eligible?
- —
Short-term bridge; refi at stabilization.
Rent comps 9 comps
| Address | Beds | Baths | Sqft | Rent | $/sqft | DOM | Units | Dist |
|---|---|---|---|---|---|---|---|---|
| 315 York Rd Carlisle, PA | 3.0 | 2.5 | 1604 | $2,100 | $1.31 | 16d | 1 | 0.38mi |
| 134 Sable Dr Carlisle, PA | 3.0 | 2.5 | 1629 | $2,100 | $1.29 | 16d | 1 | 0.72mi |
| 308 Alfalfa Dr CARLISLE BRKS, PA | 4.0 | 2.5 | 1625 | $2,150 | $1.32 | 25d | 1 | 1.12mi |
| 206 Alfalfa Dr CARLISLE BRKS, PA | 4.0 | 2.5 | 1625 | $2,050 | $1.26 | 25d | 1 | 1.12mi |
| 79 Dawn Ridge Loop Carlisle, PA | 2.0–3.0 | 1.0–1.5 | 1179 | $1,474 | $1.25 | 16d | 4 | 1.19mi |
| 495 S Spring Garden St #109 Carlisle, PA | 4.0 | 2.5 | 1625 | $2,150 | $1.32 | 25d | 1 | 1.35mi |
| 495 S Spring Garden St #202 Carlisle, PA | 4.0 | 2.5 | 1625 | $2,050 | $1.26 | 25d | 1 | 1.35mi |
| 495 S Spring Garden St #308 Carlisle, PA | 4.0 | 2.5 | 1625 | $1,835 | $1.13 | 45d | 1 | 1.35mi |
| 495 S Spring Garden St Unit 302 Carlisle, PA | 4.0 | 2.5 | 1625 | $1,735 | $1.07 | 45d | 1 | 1.35mi |
HOA detail
- Monthly dues
- $11 · $132/yr
Listing history 7 events
-
2026-06-14status $259,900 Pending 5 DOM
-
2026-06-03statusdays on market $259,900 Active Under Contract 5 DOM
-
2026-06-02days on market $259,900 Active 4 DOM
-
2026-06-01days on market $259,900 Active 3 DOM
-
2026-05-31days on market $259,900 Active 2 DOM
-
2026-05-31remarks 689-char remark
-
2026-05-31$259,900 Active 1 DOM
ⓘ Source: listings_history table (triggers on properties + properties_extension) + one-shot
backfill from property_details.listing_events for pre-trigger history.
Tax reassessment forecast PA · Partial reset (capped growth)
- Current annual tax
- $2,859 · $238/mo
- Projected year-2 tax
- $3,482 · $290/mo
- Expected delta
- +$624/yr (+$52/mo · 21.8%)
ⓘ Screening estimate from a state-policy table — verify with the county assessor before closing.
Climate risk First Street
- Flood 1/10 Low FEMA zone X (unshaded) · 0% chance over 30 yrs
- Wildfire 1/10 Low
- Heat 5/10 Major 7 d/yr ≥101°F today · 15 d/yr by 30 yrs out
- Wind 3/10 Moderate 4% chance of damaging wind over 30 yrs
- Air quality 2/10 Low 1 unhealthy d/yr today · 3 by 30 yrs out
Nearby sold comps map
Loading sold comps map…
Walkable amenities ~0.75 mi
Loading nearby amenities…
Taxation est. · year 1
- Rental income
- $26,641
- − Mortgage interest
- −$14,558
- − Property taxes
- −$2,859
- − Insurance
- −$1,300
- − Repairs & maintenance
- −$2,131
- − Management
- −$2,131
- − HOA
- −$132
- − Depreciation
- −$7,561
- Taxable loss
- −$4,030
- Est. tax savings @ 24.0%
- +$967
- After-tax cash flow
- $1,369/yr
For passive investors: Depreciation is non-cash, so a rental often shows a tax loss while cash-flowing — sheltering income. Rental losses are passive: they offset passive income freely, and up to $25,000/yr can offset ordinary (W-2) income if you actively participate and your MAGI is under $100k (phasing out to $0 by $150k); unused losses carry forward. On sale, claimed depreciation is recaptured at up to 25%, and gains may owe capital-gains tax (a 1031 exchange can defer both). Figures are a year-1 estimate at your 24.0% rate — not tax advice; consult a CPA.
Schools (NCES district)
- District
- South Middleton SD
- NCES district ID
- 4222050
- Math proficiency
- 45% ▼ -8.00%
- Reading proficiency
- 63% ▼ -7.00%
- Median HH income
- $67,822
- Composite
- 47.74/100
- National rank
- #2236
- State rank
- #106 of 539 in PA
Livability — Carlisle
- Score
- 78/100
- State rank
- #297
- US rank
- #2632
Category grades
Schools grade is shown separately in the Schools card above.
Census & demographics
- County
- Cumberland County · 257,673 people
- City population
- 62,898
- Metro
- Harrisburg-Carlisle, PA
- Population (ZIP)
- 24,385
- Household income
- $86,981
- Rent vs Own
- Severe rent burden
- 172.0
Population outlook (Cumberland County) Hauer SSP2
- Today (2025)
- 267,950 people
- By 2030
- 278,105 · +3.8%
- By 2040
- 296,552 · +10.7%
- By 2050
- 312,937 · +16.8%
- By 2075
- 349,233 · +30.3%
- By 2100
- 361,875 · +35.1%
Race, ethnicity, and origin ACS 2023
- Neighborhood character
- Predominantly White (94%)
- Race & ethnicity
- White 94% Two or more races 2% Hispanic / Latino 2%
- Common ancestry
- Romanian 3% Lithuanian 2% Slovak 2%
- Foreign-born
- 2% · Canada
- Languages at home
- 97% English-only · German/W. Germanic 1% Spanish 1% Other Indo-European 1%
Political lean MEDSL · Cumberland
- 2024 margin
- Lean R (+9.4) · D 44.6% · R 54.1% · Other 1.3%
- 2008→2024 swing
- +4.2pp toward D · 2008: -13.6pp · 2024: -9.4pp
- All cycles
- 2024: R+9.4 2020: R+10.6 2016: R+18.6 2012: R+18.5 2008: R+13.6
Not yet ingested
- Civics
- —
Market trends
- HPI YoY
- ▼ -89.66%
- Current HPI
- 265.9175
- Rent YoY
- —
- Metro
- Harrisburg-Carlisle, PA
- State GDP YoY
- ▲ 1.68%
- F500 in state
- 34
Industry mix (Fortune 500 HQ in PA)
| Industry | F500 HQs | Revenue |
|---|---|---|
| Healthcare | 2 | $309B |
|
||
| Insurance | 2 | $27B |
|
||
| Telecommunications / Media | 1 | $124B |
|
||
| Industrial Distribution | 1 | $22B |
|
||
| Financial Services | 1 | $20B |
|
||
| Chemicals / Materials | 1 | $18B |
|
||
Price history
+191.7% since first listed6 events — show timeline
- 2026-05-29 Listed $259,900 BRIGHT MLS
- 2021-03-02 Sold (Public Records) $180,000 Public Records
- 2021-03-01 Sold (MLS) $180,000 BRIGHT MLS
- 2021-01-18 Pending — BRIGHT MLS
- 2021-01-14 Listed $175,000 BRIGHT MLS
- 1990-10-22 Sold (Public Records) $89,100 Public Records
Property tax history
+4.3%/yrLatest (2026): $2,859 · +4.5% YoY. Source: county tax records.
Cash-flow waterfall
monthlySold comps — $/sqft
last 12 mo · ≤1 miLoading sold comps…