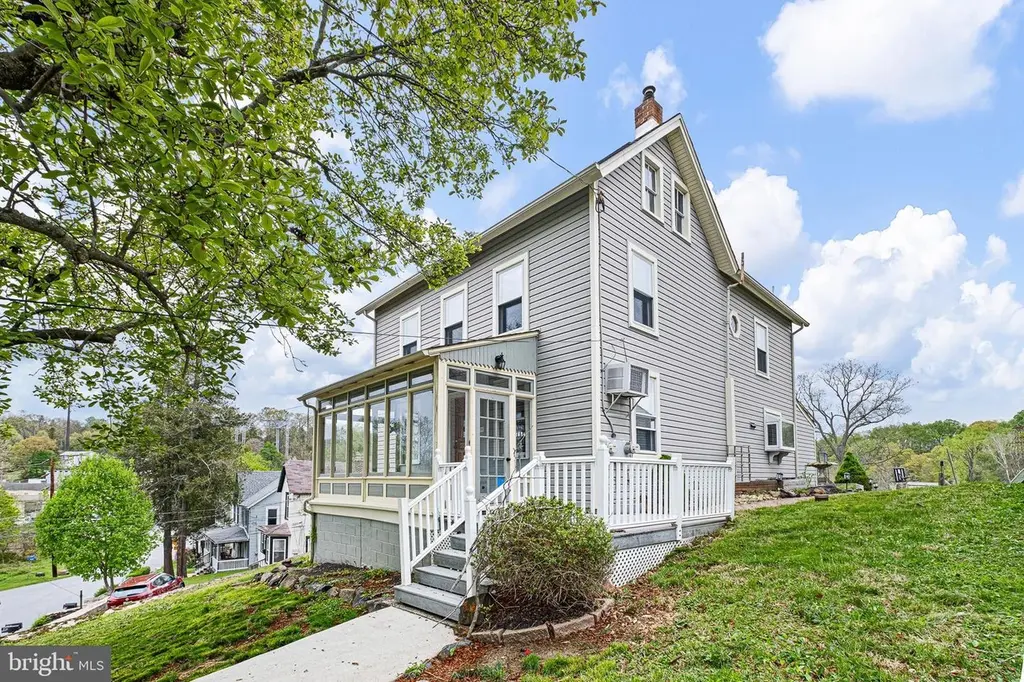
10 Convent Rd · Chester Heights, PA
Flood risk No data
- FEMA flood zone
- —
- Chance of flooding over 30 yrs
- —
- Est. flood insurance / yr
- —
Fire risk No data
- Est. fire insurance / yr
- —
Heat risk No data
- Hot days now (above threshold)
- —
- Hot days in 30 yrs
- —
Wind risk No data
- Chance of severe wind over 30 yrs
- —
Air-quality risk No data
- Unhealthy air days now
- —
- Unhealthy air days in 30 yrs
- —
Risk factors via First Street. Map © Google.
Why this score? — see what drove the B grade
The composite is a weighted blend of 9 inputs, each scored 0–100. Each bar is that input's sub-score; the figure is the points it added to the 100-point composite (weight × sub-score).
- Cash flow +27.8/30.0
- ARV discount +15.0/15.0
- DSCR +9.8/10.0
- 1% rule +6.5/10.0
- Schools +4.3/10.0
- Livability +3.4/5.0
- Rent growth +2.5/5.0
- Condition / age +2.5/5.0
- Appreciation +0.0/10.0
$309,900
🖨 Deal sheet 📄 Offer letter ✓ Due diligence
Listing remarks
Rarely Available in Historic Aston Mills Charm – Walk to Trails, Space to Make It Your Own. Located in the historic Aston Mills – Rockdale Arts District, this charming 3-bedroom, 1.5-bath home offers a rare blend of character, convenience, and opportunity. Walk to Chester Creek trails, local fishing spots, local parade route, and a nearby playground, and enjoy the feel of a tucked-away neighborhood with everyday amenities close by. Priced to reflect condition and offered as-is, this is a standout opportunity in a desirable Aston location. Inside, the home features a large kitchen, dedicated dinning room, along with both a family room and living room, providing flexible space for
Key facts
- Local fishing spots
- Walk to trails
- Large kitchen
Tags
Property features AI
Finance
- Other: Fee simple ownership; Property condition listed as average
Exterior
- Parking: Two off-street parking spaces; Stone, unpaved driveway
- Utilities: Public water; Public sewer; Electric hot water
- Home design: Detached structure; Estimated year built
- Construction: Frame construction; Stone foundation
- Exterior features: Not in a federal flood zone; Other structures both above grade and below grade
Interior
- Kitchen: Kitchen (appliances not specified)
- Bedrooms: Three bedrooms on the upper level
- Bathrooms: One full bathroom; One half bathroom on the main level
- Heating & cooling: Hot water heating; Oil fuel
- Interior features: Not furnished; Living Room, Dining Room, Family Room, Solarium, Attic, Storage room, Basement workshop
- Laundry & utility: Hot water is electric
Neighborhood map
What this means for you Summary
Snapshot
- This is a 3-bed/1.5-bath single-family listed at $310k.
Deal economics
- At list price, monthly cash flow is $948 ($11k/yr) — positive.
- The deal already cash-flows at list — no discount required.
- Meets the 1% rule at list price ($4k rent vs $310k).
- Recommended offer: $305k (1.5% below list) — sets the bar for market timing.
- Cap rate 10.0% vs local median 2.6% in Chester Heights — top-decile yield for the area; either an underpriced asset or a hidden risk that comps aren't pricing in. Stress-test before assuming the spread holds.
Location & tenants
- Location reads 67/100 on livability (#994 in PA) — a middle-class / working-renter tenant base. Strengths: crime A+, employment A+, housing A+; Watch: schools C-, amenities F, commute F.
- Penn-Delco SD (suburban): math 37% / reading 59% proficiency, ranked #174 of 539 in PA (top 32%) — families likely to look elsewhere, expect single-tenant / working-renter base with shorter leases; only 16% free/reduced lunch — higher-income household profile.
- Market conditions: 71 active listings in the ZIP; 3 comparable units currently listed for rent nearby; rentals leasing fast (median 1d on market — plan ~1-2 weeks tenant-placement turnaround); solid renter incomes; 299 units permitted in Delaware County in 2024 (5 in 5+ unit buildings).
- This rent runs 44% of the median local income ($97k/yr) — at the standard rent-burdened threshold; future hikes will face affordability resistance.
Forward outlook
- Local home prices are declining (-3.0%/yr); year-one equity from $2k of loan paydown is wiped out by about $9k of value loss. Plan a longer hold.
- At projected returns (-3.0% appreciation + 3.0% rent growth), your $87k cash investment doubles in ~9 years — after that, you're playing with house money.
Negotiation context
- It's been on market 30 days — a 2% lower offer ($305k) is reasonable based on typical stale-listing flexibility.
- 2 sale attempts; this cycle's ask has dropped $20k (6%) from the opening price — seller is motivated, your offer sets the floor, not the list.
- Current owner paid $52k; list at $310k implies a 502% gain — meaningful room to come down on a strong offer.
Risks & watch-outs
- Watch-outs: built in 1920 — expect roof / HVAC / electrical / plumbing capex.
Questions for the listing agent
- Built in 1920 — when were the roof, HVAC, electrical panel, plumbing, and water heater last replaced?
- Is there a deadline driving the sale (1031 exchange, divorce, estate, relocation)? That informs how much negotiation room exists.
- What's the average days-on-market for RENTAL listings here right now (not sales)? A rising rental-DOM trend means longer vacancies and softer asking-rent achievability than the comps imply.
- What's the recent tenant-quality profile in this submarket — average credit score on applications, eviction rate, late-payment / NSF rate, and stable-employment percentage? A property-management company in the area should have these aggregated.
- How much new for-sale + rental construction is in the pipeline within 1–3 miles? Heavy new supply typically softens prices + rents 12–24 months out; constrained supply supports both.
Investment metrics
- 1% rule
- 1.15% ✓
- Cap rate
- 9.97%
- Cash-on-cash
- 13.12%
- DSCR
- 1.58
- GRM
- 7.2
CMA / ARV
- ARV (median comp)
- $437,531
- List price
- $309,900
- Delta
- -29.17%
- Verdict
- UNDERPRICED
- Comps
- 20 within 1.0 mi
Show comp detail 12 sales within ~0.75 mi
| Address | Dist | Beds/Ba | Sqft | Sold | Price | $/sf | Match |
|---|---|---|---|---|---|---|---|
| 624 Convent Rd | 0.27mi | 4/2.0 (+1) | 1,819 (-11%) | 2mo | $482,500 | $265 | 60 |
| 184 Woodlark Ln | 0.62mi | 4/1.5 (+1) | 2,087 (+2%) | 5mo | $564,000 | $270 | 58 |
| 313 Highgrove Ln | 0.55mi | 3/2.5 | 1,988 (-3%) | 10mo | $555,500 | $279 | 57 |
| 41 Dogwood Ln | 0.40mi | 4/3.5 (+1) | 2,092 (+2%) | 12mo | $590,000 | $282 | 55 |
| 249 S Pennell Rd | 0.50mi | 3/2.5 | 1,797 (-12%) | 2mo | $400,000 | $223 | 50 |
| 222 S Pennell Rd | 0.56mi | 3/1.5 | 1,810 (-12%) | 10mo | $380,000 | $210 | 46 |
| 206 Chestnut Ave | 0.66mi | 4/1.5 (+1) | 1,808 (-12%) | 1mo | $415,000 | $230 | 44 |
| 615 Convent Rd | 0.40mi | 4/2.0 (+1) | 2,337 (+14%) | 10mo | $417,000 | $178 | 42 |
| 207 Elm Ave | 0.51mi | 4/2.0 (+1) | 1,885 (-8%) | 20mo | $491,215 | $261 | 40 |
| 4 Riddlewood Dr | 0.68mi | 3/2.0 | 1,800 (-12%) | 10mo | $540,000 | $300 | 38 |
| 233 S Pennell Rd | 0.57mi | 3/2.5 | 1,797 (-12%) | 16mo | $488,000 | $272 | 36 |
| 1795 Hillcrest Ln | 0.64mi | 4/2.0 (+1) | 2,296 (+12%) | 11mo | $542,500 | $236 | 34 |
Match score weights: distance 35% · size 25% · config 20% · recency 20%. Top-matched comps best support the ARV.
Projected returns pro-forma
-3.0% appreciation · 3.0% rent growth · sell at horizon
- IRR
- 3.0%
- Equity multiple
- 1.12×
- Total profit
- $10,074
- Equity at exit
- $46,207
- IRR
- 12.5%
- Equity multiple
- 1.99×
- Total profit
- $86,086
- Equity at exit
- $26,794
Cash invested: $86,772 (down + closing). Projections, not guarantees.
Landlord ↔ Tenant lean methodology
- Overall (STATE)
- 62 Landlord-Friendly
- State Pennsylvania
- 62 Landlord-Friendly · EVEN
- County
- — inherits STATE
- City
- — inherits STATE
ZIP-level market 19014
- Active inventory
- 71
- Price-to-rent
- 7.2×
Monthly cashflow live
- Estimated rent
- $3,563 medium interval (Pro) →
- Mortgage (P&I)
- −$1,625
- Tax from tax record
- −$112 /mo · $1,344/yr
- Insurance
- −$129
- HOA
- −$0
- Vacancy / Maint / Mgmt
- −$748
- Net cashflow
- $948
Break-even live
UW: 25.0% down · 7.5% · 30yr · 1.5% tax · 5.0% vac · 8.0% maint · 8.0% mgmt
Financing live
Cash to close
- Down payment
- $77,475
- Closing costs
- $9,297
- Reserves months
- —
- Total cash needed
- —
Loan-product check · same deal, 3 products live
Conventional
25% down · 7.5% · 30yr
- Down + closing
- —
- Monthly P&I
- —
- Monthly cashflow
- —
- DSCR
- —
- Eligible?
- —
Personal DTI + credit; lowest rate.
DSCR
20% down · 8.5% · 30yr
- Down + closing
- —
- Monthly P&I
- —
- Monthly cashflow
- —
- DSCR
- —
- Eligible?
- —
No personal income docs; deal must DSCR.
Hard money
10% down · 12.0% · 12mo
- Down + closing
- —
- Monthly P&I
- —
- Monthly cashflow
- —
- DSCR
- —
- Eligible?
- —
Short-term bridge; refi at stabilization.
Rent comps 3 comps
| Address | Beds | Baths | Sqft | Rent | $/sqft | DOM | Units | Dist |
|---|---|---|---|---|---|---|---|---|
| 274 Oak Ave Media, PA | 4.0 | 2.5 | 3000 | $4,975 | $1.66 | 1d | 1 | 0.48mi |
| 117 Woodcrest Ave Aston, PA | 3.0 | 2.0 | 1536 | $2,750 | $1.79 | 19d | 1 | 0.82mi |
| 440 Cricket Ln Media, PA | 4.0 | 2.5 | 2132 | $3,600 | $1.69 | 1d | 1 | 1.49mi |
Listing history 6 events
-
2026-05-17price $309,900 1017-char remark
-
2026-05-17status Active 1017-char remark
-
2026-05-15historical 1017-char remark
-
2026-04-24$329,900 Active 1017-char remark
-
1984-12-03soldstatus $51,500
-
1983-07-01soldstatus $45,000
ⓘ Source: listings_history table (triggers on properties + properties_extension) + one-shot
backfill from property_details.listing_events for pre-trigger history.
Tax reassessment forecast PA · Partial reset (capped growth)
- Current annual tax
- $1,344 · $112/mo
- Projected year-2 tax
- $3,120 · $260/mo
- Expected delta
- +$1,776/yr (+$148/mo · 132.2%)
ⓘ Screening estimate from a state-policy table — verify with the county assessor before closing.
Nearby sold comps map
Loading sold comps map…
Walkable amenities ~0.75 mi
Loading nearby amenities…
Taxation est. · year 1
- Rental income
- $42,755
- − Mortgage interest
- −$17,359
- − Property taxes
- −$1,344
- − Insurance
- −$1,550
- − Repairs & maintenance
- −$3,420
- − Management
- −$3,420
- − Depreciation
- −$9,015
- Taxable income
- $6,646
- Est. tax owed @ 24.0%
- −$1,595
- After-tax cash flow
- $9,786/yr
For passive investors: Depreciation is non-cash, so a rental often shows a tax loss while cash-flowing — sheltering income. Rental losses are passive: they offset passive income freely, and up to $25,000/yr can offset ordinary (W-2) income if you actively participate and your MAGI is under $100k (phasing out to $0 by $150k); unused losses carry forward. On sale, claimed depreciation is recaptured at up to 25%, and gains may owe capital-gains tax (a 1031 exchange can defer both). Figures are a year-1 estimate at your 24.0% rate — not tax advice; consult a CPA.
Schools (NCES district)
- District
- Penn-Delco SD
- NCES district ID
- 4218580
- Math proficiency
- 37% ▼ -18.00%
- Reading proficiency
- 59% ▼ -13.00%
- Median HH income
- $71,673
- Composite
- 43.11/100
- National rank
- #3083
- State rank
- #174 of 539 in PA
Livability — Chester Heights
- Score
- 67/100
- State rank
- #994
- US rank
- #10966
Category grades
Schools grade is shown separately in the Schools card above.
Census & demographics
- County
- Delaware County · 399,863 people
- City population
- 297
- Metro
- Philadelphia-Camden-Wilmington, PA-NJ-DE-MD
- Population (ZIP)
- 21,427
- Household income
- $96,781
- Rent vs Own
- Severe rent burden
- 276.0
Population outlook (Delaware County) Hauer SSP2
- Today (2025)
- 577,490 people
- By 2030
- 581,243 · +0.6%
- By 2040
- 584,700 · +1.2%
- By 2050
- 586,581 · +1.6%
- By 2075
- 598,706 · +3.7%
- By 2100
- 590,823 · +2.3%
Race, ethnicity, and origin ACS 2023
- Neighborhood character
- Predominantly White (86%)
- Race & ethnicity
- White 86% Black 9% Two or more races 2% Asian 2% Hispanic / Latino 2%
- Common ancestry
- Romanian 9% Italian 2% Iranian 1%
- Foreign-born
- 4% · South Korea, Canada
- Languages at home
- 95% English-only · Russian/Polish/Slavic 1% Other Indo-European 1% Spanish 1%
Political lean MEDSL · Delaware
- 2024 margin
- Strong D (+23.7) · D 61.4% · R 37.6% · Other 1.0%
- 2008→2024 swing
- +2.3pp toward D · 2008: 21.4pp · 2024: 23.7pp
- All cycles
- 2024: D+23.7 2020: D+26.7 2016: D+22.0 2012: D+21.8 2008: D+21.4
Not yet ingested
- Civics
- —
Market trends
- HPI YoY
- ▼ -260.34%
- Current HPI
- 262.8409
- Rent YoY
- —
- Metro
- Philadelphia-Camden-Wilmington, PA-NJ-DE-MD
- State GDP YoY
- ▲ 1.68%
- F500 in state
- 34
Industry mix (Fortune 500 HQ in PA)
| Industry | F500 HQs | Revenue |
|---|---|---|
| Healthcare | 2 | $309B |
|
||
| Insurance | 2 | $27B |
|
||
| Telecommunications / Media | 1 | $124B |
|
||
| Industrial Distribution | 1 | $22B |
|
||
| Financial Services | 1 | $20B |
|
||
| Chemicals / Materials | 1 | $18B |
|
||
Price history
+588.7% since first listed7 events — show timeline
- 2026-05-26 Pending — BRIGHT MLS
- 2026-05-17 Price Changed $309,900 BRIGHT MLS
- 2026-05-17 Relisted — BRIGHT MLS
- 2026-05-15 Listing Removed — BRIGHT MLS
- 2026-04-24 Listed $329,900 BRIGHT MLS
- 1984-12-03 Sold (Public Records) $51,500 Public Records
- 1983-07-01 Sold (Public Records) $45,000 Public Records
Property tax history
-5.2%/yrLatest (2026): $1,344 · -76.1% YoY. Source: county tax records.
Cash-flow waterfall
monthlySold comps — $/sqft
last 12 mo · ≤1 miLoading sold comps…