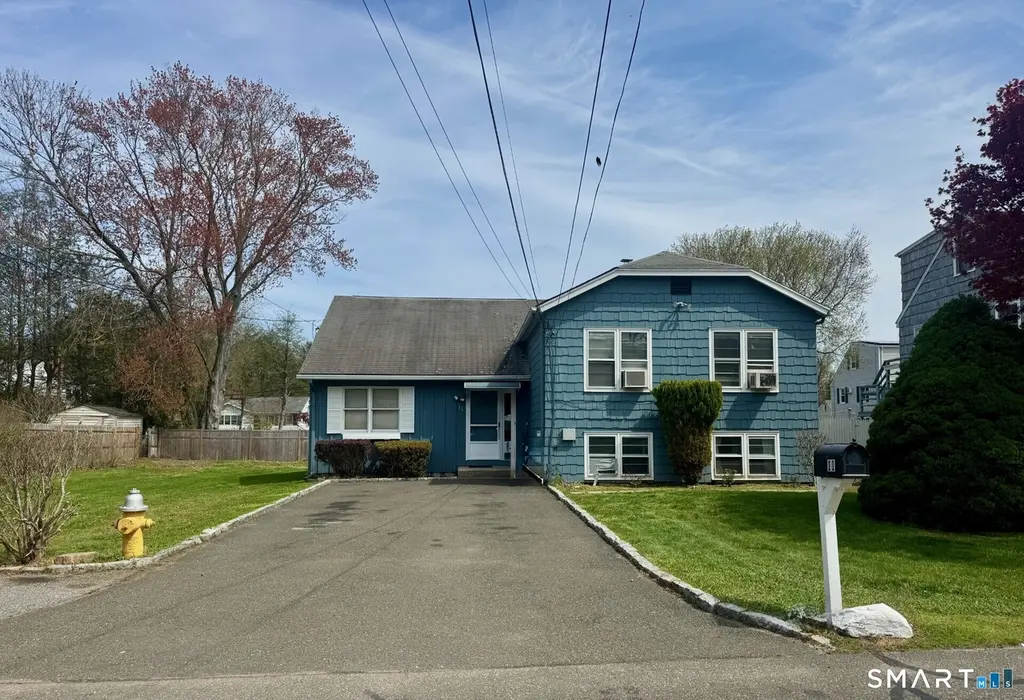
11 Hale St · Compo, CT
Flood risk 8/10 · Major
- FEMA flood zone
- A
- Chance of flooding over 30 yrs
- 0.99%
- Est. flood insurance / yr
- $946 – $6,584
Fire risk 1/10 · Minimal
- Est. fire insurance / yr
- $829 – $1,539
Heat risk 6/10 · Moderate
- Hot days now (above 99°F)
- 7 days/yr
- Hot days in 30 yrs
- 15 days/yr
Wind risk 6/10 · Moderate
- Chance of severe wind over 30 yrs
- 72.0%
Air-quality risk 8/10 · Major
- Unhealthy air days now
- 13 days/yr
- Unhealthy air days in 30 yrs
- 18 days/yr
Risk factors via First Street. Map © Google.
Why this score? — see what drove the A- grade
The composite is a weighted blend of 9 inputs, each scored 0–100. Each bar is that input's sub-score; the figure is the points it added to the 100-point composite (weight × sub-score).
- Cash flow +30.0/30.0
- ARV discount +15.0/15.0
- DSCR +10.0/10.0
- 1% rule +9.2/10.0
- Schools +7.6/10.0
- Rent growth +3.9/5.0
- Livability +2.5/5.0
- Condition / age +2.5/5.0
- Appreciation +0.0/10.0
$599,000
🖨 Deal sheet 📄 Offer letter ✓ Due diligence
Listing remarks
Bring your vision to life in Westport. Set on . 23 acres and ideally located less than 2 miles from the beach, just 1 mile to the train & I-95 and minutes to downtown, this property presents an opportunity to build new or completely reimagine. The existing structure is being sold strictly "As Is". An ideal offering for builders, investors or end users looking to customize to their own specifications. Buyers are encouraged to do their own due diligence. Estate property. Seller does not warranty any systems, appliances or utilities.
Key facts
- 0.23 acre lot
- 4 parking spots
- Built 1974
Property features AI
Exterior
- Parking: Paved driveway; Paved parking; 4 parking spaces
- Utilities: Public water connected; Public sewer connected
- Home design: Single-family home; Blue exterior
- Construction: Frame construction; Block foundation; Asphalt shingle roof; Shingle and wood siding
- Exterior features: Patio; Level lot; Beach rights
Interior
- Kitchen: Electric range; Refrigerator
- Bedrooms: 3 bedrooms
- Bathrooms: 1 full bath; 1 half bath
- Heating & cooling: Hot air heating; Oil-fired heat with above-ground fuel tank
- Interior features: 6 total rooms; Crawl space and partial basement; Attic with pull-down stairs
- Laundry & utility: Domestic hot water
Neighborhood map
What this means for you Summary
Snapshot
- This is a 3-bed/1.5-bath single-family listed at $599k.
Deal economics
- At list price, monthly cash flow is $3k ($31k/yr) — positive.
- The deal already cash-flows at list — no discount required.
- Meets the 1% rule at list price ($9k rent vs $599k).
Location & tenants
- Location reads: area grade A — affects rentability + tenant quality, not the cash-flow math above.
- Westport School District (suburban): math 74% / reading 82% proficiency, ranked #3 of 153 in CT (top 2%) — strong family-tenant draw, lease renewals of 3-5y typical; only 2% free/reduced lunch — higher-income household profile.
- Zoned schools: Saugatuck Elementary School (math 69% / reading 80%, grade A, #44 of 553 statewide, top 10%, 434 students, 2% FRL); Staples High School (math 76% / reading 92%, grade A, #3 of 194 statewide, top 1%, 1,686 students, 2% FRL) — zoned schools at 2% FRL track the district average.
- Market conditions: Rents rising fast (+5.6%/yr); 196 active listings in the ZIP; 39 comparable units currently listed for rent nearby; rentals at typical pace (median 24d on market — plan ~3-4 weeks tenant-placement turnaround); high-income renter base; 1,151 units permitted in Western Connecticut Planning Region in 2024 (714 in 5+ unit buildings).
- This rent runs 41% of the median local income ($250k/yr) — at the standard rent-burdened threshold; future hikes will face affordability resistance.
Forward outlook
- Local home prices are declining (-3.0%/yr); year-one equity from $4k of loan paydown is wiped out by about $18k of value loss. Plan a longer hold.
- At projected returns (-3.0% appreciation + 5.6% rent growth), your $168k cash investment doubles in ~6 years — after that, you're playing with house money.
Negotiation context
- Only 9 days on market — expect competitive offers; lowballing is unlikely to land.
- 2 sale attempts since 34y ago with the ask held roughly flat each time — persistent listings suggest the price (not the market) is what's stuck; bring a comps-based counter.
Risks & watch-outs
- Watch-outs: flood insurance adds $314/mo.
- Climate carrying-cost: in FEMA flood zone A (mandatory federal flood insurance); major wind risk, 72% chance of damaging wind over 30y; extreme-heat days projected 7→15/yr by 2055 (HVAC capex compounding) — expect insurance premiums to compound above CPI over the hold.
Questions for the listing agent
- Built in 1974 — when were the roof, HVAC, electrical panel, plumbing, and water heater last replaced?
- What's the actual annual flood-insurance premium (NFIP or private), and is the property in a SFHA with mandatory coverage?
- Is there a deadline driving the sale (1031 exchange, divorce, estate, relocation)? That informs how much negotiation room exists.
- What's the average days-on-market for RENTAL listings here right now (not sales)? A rising rental-DOM trend means longer vacancies and softer asking-rent achievability than the comps imply.
- What's the recent tenant-quality profile in this submarket — average credit score on applications, eviction rate, late-payment / NSF rate, and stable-employment percentage? A property-management company in the area should have these aggregated.
- How much new for-sale + rental construction is in the pipeline within 1–3 miles? Heavy new supply typically softens prices + rents 12–24 months out; constrained supply supports both.
Investment metrics
- 1% rule
- 1.42% ✓
- Cap rate
- 12.07%
- Cash-on-cash
- 20.63%
- DSCR
- 1.92
- GRM
- 5.9
CMA / ARV
- ARV (median comp)
- $1,017,988
- List price
- $599,000
- Delta
- -41.16%
- Verdict
- UNDERPRICED
- Comps
- 20 within 1.0 mi
Show comp detail 6 sales within ~0.75 mi
| Address | Dist | Beds/Ba | Sqft | Sold | Price | $/sf | Match |
|---|---|---|---|---|---|---|---|
| 2 Inwood Ln | 0.33mi | 3/1.5 | 1,358 (+2%) | 20mo | $950,000 | $700 | 65 |
| 1 Drumlin Rd | 0.28mi | 3/2.0 | 1,445 (+8%) | 18mo | $1,100,000 | $761 | 56 |
| 23 Hale St | 0.07mi | 4/3.0 (+1) | 1,509 (+13%) | 11mo | $1,200,000 | $795 | 55 |
| 16 Drumlin Rd | 0.35mi | 3/1.0 | 1,240 (-7%) | 22mo | $875,000 | $706 | 52 |
| 69 Grove Point Rd | 0.73mi | 2/1.5 (-1) | 1,394 (+4%) | 3mo | $1,225,000 | $879 | 51 |
| 20 Vani Ct | 0.61mi | 4/2.0 (+1) | 1,512 (+13%) | 21mo | $930,000 | $615 | 25 |
Match score weights: distance 35% · size 25% · config 20% · recency 20%. Top-matched comps best support the ARV.
Projected returns pro-forma
-3.0% appreciation · 5.58% rent growth · sell at horizon
- IRR
- 13.0%
- Equity multiple
- 1.53×
- Total profit
- $89,387
- Equity at exit
- $89,313
- IRR
- 23.8%
- Equity multiple
- 3.31×
- Total profit
- $387,208
- Equity at exit
- $51,791
Cash invested: $167,720 (down + closing). Projections, not guarantees.
Landlord ↔ Tenant lean methodology
- Overall (STATE)
- 27 Tenant-Leaning
- State Connecticut
- 27 Tenant-Leaning · D+7
- County
- — inherits STATE
- City
- — inherits STATE
ZIP-level market 06880
- Rents YoY
- 5.6%
- Active inventory
- 196
- Price-to-rent
- 5.9×
Monthly cashflow live
- Estimated rent
- $8,515 high interval (Pro) →
- Mortgage (P&I)
- −$3,141
- Tax from tax record
- −$453 /mo · $5,435/yr
- Insurance
- −$250
- Flood insurance flood zone
- −$314 /mo · $3,765/yr
- HOA
- −$0
- Vacancy / Maint / Mgmt
- −$1,788
- Net cashflow
- $2,569
Break-even live
UW: 25.0% down · 7.5% · 30yr · 1.5% tax · 5.0% vac · 8.0% maint · 8.0% mgmt
Financing live
Cash to close
- Down payment
- $149,750
- Closing costs
- $17,970
- Reserves months
- —
- Total cash needed
- —
Loan-product check · same deal, 3 products live
Conventional
25% down · 7.5% · 30yr
- Down + closing
- —
- Monthly P&I
- —
- Monthly cashflow
- —
- DSCR
- —
- Eligible?
- —
Personal DTI + credit; lowest rate.
DSCR
20% down · 8.5% · 30yr
- Down + closing
- —
- Monthly P&I
- —
- Monthly cashflow
- —
- DSCR
- —
- Eligible?
- —
No personal income docs; deal must DSCR.
Hard money
10% down · 12.0% · 12mo
- Down + closing
- —
- Monthly P&I
- —
- Monthly cashflow
- —
- DSCR
- —
- Eligible?
- —
Short-term bridge; refi at stabilization.
Rent comps 39 comps
| Address | Beds | Baths | Sqft | Rent | $/sqft | DOM | Units | Dist |
|---|---|---|---|---|---|---|---|---|
| 26 High St Westport, CT | 3.0 | 2.5 | 1440 | $6,350 | $4.41 | 3d | 1 | 0.10mi |
| 18 Hales Rd Westport, CT | 4.0 | 2.5 | 1542 | $7,500 | $4.86 | 43d | 1 | 0.40mi |
| 4 River View Rd Westport, CT | 3.0 | 2.0 | 1258 | $7,200 | $5.72 | 43d | 1 | 0.70mi |
| 253 Riverside Ave Unit 101 Westport, CT | 2.0 | 3.0 | 1300 | $10,500 | $8.08 | 23d | 1 | 0.81mi |
| 253 Riverside Ave Unit 202 Westport, CT | 2.0 | 3.0 | 1200 | $11,500 | $9.58 | 23d | 1 | 0.81mi |
| 251 Riverside Ave Unit 251B Westport, CT | 2.0 | 2.5 | 1560 | $12,500 | $8.01 | 23d | 1 | 0.81mi |
| 251 Riverside Ave Unit 251A Westport, CT | 2.0 | 2.5 | 1420 | $12,000 | $8.45 | 23d | 1 | 0.81mi |
| 85 Post Rd W Westport, CT | 1.0–3.0 | 1.0–2.0 | 1180 | $9,489 | $8.04 | 43d | 24 | 1.08mi |
| 85 Post Rd W Westport, CT | 1.0–3.0 | 1.0–2.0 | 1180 | $9,789 | $8.30 | 2d | 31 | 1.08mi |
| 85 Post Rd W Unit 307 Westport, CT | 3.0 | 2.0 | 1412 | $8,597 | $6.09 | 23d | 1 | 1.08mi |
| 85 Post Rd W Unit 214 Westport, CT | 2.0 | 2.0 | 1385 | $7,187 | $5.19 | 3d | 1 | 1.08mi |
| 85 Post Rd W Unit 309 Westport, CT | 2.0 | 2.0 | 1494 | $8,889 | $5.95 | 3d | 1 | 1.08mi |
| 85 Post Rd W Unit 510 Westport, CT | 3.0 | 2.0 | 1432 | $9,169 | $6.40 | 23d | 1 | 1.08mi |
| 85 Post Rd W Unit 402 Westport, CT | 2.0 | 2.0 | 1466 | $9,089 | $6.20 | 23d | 1 | 1.08mi |
| 85 Post Rd W Unit 507 Westport, CT | 3.0 | 2.0 | 1412 | $8,997 | $6.37 | 23d | 1 | 1.08mi |
| 85 Post Rd W Unit 311 Westport, CT | 2.0 | 2.0 | 1255 | $6,997 | $5.58 | 23d | 1 | 1.08mi |
| 85 Post Rd W Unit 502 Westport, CT | 3.0 | 2.0 | 1466 | $9,189 | $6.27 | 3d | 1 | 1.08mi |
| 85 Post Rd W Unit 401 Westport, CT | 3.0 | 2.0 | 1604 | $9,789 | $6.10 | 23d | 1 | 1.08mi |
| 85 Post Rd W Unit 512 Westport, CT | 3.0 | 2.0 | 1311 | $9,037 | $6.89 | 23d | 1 | 1.08mi |
| 85 Post Rd W Unit 514 Westport, CT | 2.0 | 2.0 | 1343 | $8,897 | $6.62 | 23d | 1 | 1.08mi |
| 85 Post Rd W Unit 302 Westport, CT | 2.0 | 2.0 | 1466 | $8,789 | $6.00 | 14d | 1 | 1.08mi |
| 85 Post Rd W Unit 208 Westport, CT | 3.0 | 2.0 | 1515 | $8,889 | $5.87 | 3d | 1 | 1.08mi |
| 85 Post Rd W Unit 202 Westport, CT | 2.0 | 2.0 | 1466 | $7,389 | $5.04 | 3d | 1 | 1.08mi |
| 85 Post Rd W Unit 301 Westport, CT | 3.0 | 2.0 | 1604 | $9,489 | $5.92 | 23d | 1 | 1.08mi |
| 85 Post Rd W Unit 509 Westport, CT | 3.0 | 2.0 | 1446 | $9,289 | $6.42 | 23d | 1 | 1.08mi |
| 85 Post Rd W Unit 314 Westport, CT | 3.0 | 2.0 | 1311 | $8,337 | $6.36 | 23d | 1 | 1.08mi |
| 85 Post Rd W Unit 408 Westport, CT | 3.0 | 2.0 | 1515 | $9,789 | $6.46 | 3d | 1 | 1.08mi |
| 85 Post Rd W Unit 102 Westport, CT | 2.0 | 2.0 | 1449 | $7,289 | $5.03 | 3d | 1 | 1.08mi |
| 28 Treadwell Ave Westport, CT | 3.0 | 3.0 | 1651 | $6,950 | $4.21 | 3d | 1 | 1.10mi |
| 14 Cross St Unit D Westport, CT | 2.0 | 2.0 | 1165 | $5,250 | $4.51 | 21d | 1 | 1.10mi |
| 20 Cross St #5 Westport, CT | 2.0 | 2.0 | 1182 | $4,750 | $4.02 | 43d | 1 | 1.10mi |
| 30 Crescent Park Rd Westport, CT | 2.0 | 2.0 | 960 | $3,600 | $3.75 | 23d | 1 | 1.21mi |
| 31 Hillandale Rd Westport, CT | 3.0 | 1.5 | 1363 | $5,000 | $3.67 | 21d | 1 | 1.26mi |
| 55 Kings Hwy N Westport, CT | 3.0 | 2.0 | 1719 | $10,000 | $5.82 | 43d | 1 | 1.27mi |
| 19 Whitney St Westport, CT | 2.0 | 2.0 | 1400 | $4,000 | $2.86 | 14d | 1 | 1.29mi |
| 87 Myrtle Ave Westport, CT | 2.0 | 1.5 | 1604 | $16,500 | $10.29 | 3d | 1 | 1.34mi |
| 33 Strathmore Ln #33 Westport, CT | 2.0 | 2.5 | 1440 | $4,100 | $2.85 | 13d | 1 | 1.37mi |
| 201 Main St Unit 201 Westport, CT | 2.0 | 1.5 | 935 | $4,700 | $5.03 | 21d | 1 | 1.40mi |
| 61 Hillandale Rd Westport, CT | 3.0 | 1.5 | 1724 | $7,500 | $4.35 | 13d | 1 | 1.46mi |
Listing history 7 events
-
2026-05-15status Under Contract 550-char remark
-
2026-05-07$599,000 Active 550-char remark
-
2026-05-04historical $599,000 550-char remark
-
1993-01-22soldstatus $195,000
-
1993-01-22soldstatus $196,000
-
1992-11-30$214,900
-
1989-10-02soldstatus $207,000
ⓘ Source: listings_history table (triggers on properties + properties_extension) + one-shot
backfill from property_details.listing_events for pre-trigger history.
Tax reassessment forecast CT · Partial reset (capped growth)
- Current annual tax
- $5,435 · $453/mo
- Projected year-2 tax
- $9,127 · $761/mo
- Expected delta
- +$3,692/yr (+$308/mo · 67.9%)
ⓘ Screening estimate from a state-policy table — verify with the county assessor before closing.
Climate risk First Street
- Flood 8/10 Severe FEMA zone A · 99% chance over 30 yrs
- Wildfire 1/10 Low
- Heat 6/10 Major 7 d/yr ≥99°F today · 15 d/yr by 30 yrs out
- Wind 6/10 Major 72% chance of damaging wind over 30 yrs
- Air quality 8/10 Severe 13 unhealthy d/yr today · 18 by 30 yrs out
Nearby sold comps map
Loading sold comps map…
Walkable amenities ~0.75 mi
Loading nearby amenities…
Taxation est. · year 1
- Rental income
- $102,178
- − Mortgage interest
- −$33,553
- − Property taxes
- −$5,435
- − Insurance
- −$6,760
- − Repairs & maintenance
- −$8,174
- − Management
- −$8,174
- − Depreciation
- −$17,425
- Taxable income
- $22,656
- Est. tax owed @ 24.0%
- −$5,437
- After-tax cash flow
- $25,394/yr
For passive investors: Depreciation is non-cash, so a rental often shows a tax loss while cash-flowing — sheltering income. Rental losses are passive: they offset passive income freely, and up to $25,000/yr can offset ordinary (W-2) income if you actively participate and your MAGI is under $100k (phasing out to $0 by $150k); unused losses carry forward. On sale, claimed depreciation is recaptured at up to 25%, and gains may owe capital-gains tax (a 1031 exchange can defer both). Figures are a year-1 estimate at your 24.0% rate — not tax advice; consult a CPA.
Schools (NCES district)
- District
- Westport School District
- NCES district ID
- 0905040
- Math proficiency
- 74% ▼ -8.00%
- Reading proficiency
- 82% ▼ -3.00%
- Median HH income
- $156,579
- Composite
- 76.16/100
- National rank
- #114
- State rank
- #3 of 153 in CT
Livability — Compo
No livability data for this city. (Only ~50 U.S. cities are tracked.)
Census & demographics
- Census place
- Compo, CT
- County
- Fairfield County · 765,532 people
- Metro
- Bridgeport-Stamford-Norwalk, CT
- Population (ZIP)
- 27,583
- Household income
- $250,001
- Rent vs Own
- Severe rent burden
- 225.0
Population outlook (Western Connecticut County) Hauer SSP2
- By 2040
- 685,031
Race, ethnicity, and origin ACS 2023
- Neighborhood character
- Predominantly White (79%)
- Race & ethnicity
- White 79% Hispanic / Latino 9% Two or more races 9% Asian 5% Black 2%
- Hispanic origin (detail)
- Mexican 1% Puerto Rican 1%
- Common ancestry
- Romanian 6% Scotch-Irish 4% Italian 3%
- Foreign-born
- 16% · Canada, China, Jamaica
- Languages at home
- 85% English-only · Other Indo-European 5% Spanish 5% French/Haitian/Cajun 1%
Political lean MEDSL · Western Connecticut
- 2024 margin
- D (+19.1) · D 58.8% · R 39.7% · Other 1.6%
- All cycles
- 2024: D+19.1
Not yet ingested
- Civics
- —
Market trends
- HPI YoY
- ▼ -608.79%
- Current HPI
- 200.5498
- Rent YoY
- ▲ 5.58%
- Metro
- Bridgeport-Stamford-Norwalk, CT
- State GDP YoY
- ▲ 1.06%
- F500 in state
- 38
Industry mix (Fortune 500 HQ in CT)
| Industry | F500 HQs | Revenue |
|---|---|---|
| Industrial Machinery | 4 | $38B |
|
||
| Insurance | 3 | $71B |
|
||
| Financial Services | 2 | $25B |
|
||
| Transportation / Logistics | 2 | $18B |
|
||
| Healthcare | 1 | $247B |
|
||
| Telecommunications | 1 | $55B |
|
||
Price history
+243.0% since first listed8 events — show timeline
- 2026-06-04 Sold (MLS) $710,000 Smart MLS
- 2026-05-15 Pending — Smart MLS
- 2026-05-07 Listed $599,000 Smart MLS
- 2026-05-04 Coming Soon $599,000 Smart MLS
- 1993-01-22 Sold (Public Records) $196,000 Public Records
- 1993-01-22 Sold (MLS) $195,000 Smart MLS
- 1992-11-30 Listed $214,900 Smart MLS
- 1989-10-02 Sold (Public Records) $207,000 Public Records
Property tax history
+1.8%/yrLatest (2023): $5,435 · +1.6% YoY. Source: county tax records.
Cash-flow waterfall
monthlySold comps — $/sqft
last 12 mo · ≤1 miLoading sold comps…