8550 Little Gasparilla Is · Rotonda, FL
Flood risk 10/10 · Severe
- FEMA flood zone
- AE
- Chance of flooding over 30 yrs
- 0.99%
- Est. flood insurance / yr
- $1,737 – $8,500
Fire risk 1/10 · Minimal
- Est. fire insurance / yr
- $947 – $1,759
Heat risk 10/10 · Severe
- Hot days now (above 107°F)
- 7 days/yr
- Hot days in 30 yrs
- 26 days/yr
Wind risk 10/10 · Severe
- Chance of severe wind over 30 yrs
- 99.0%
Air-quality risk 3/10 · Minor
- Unhealthy air days now
- 2 days/yr
- Unhealthy air days in 30 yrs
- 2 days/yr
Risk factors via First Street. Map © Google.
Why this score? — see what drove the C grade
The composite is a weighted blend of 9 inputs, each scored 0–100. Each bar is that input's sub-score; the figure is the points it added to the 100-point composite (weight × sub-score).
- Cash flow +24.5/30.0
- DSCR +7.9/10.0
- 1% rule +6.3/10.0
- Schools +4.6/10.0
- Appreciation +4.0/10.0
- Livability +3.4/5.0
- Rent growth +2.5/5.0
- Condition / age +2.5/5.0
- ARV discount +0.0/15.0
$629,000
🖨 Deal sheet 📄 Offer letter ✓ Due diligence
Listing remarks
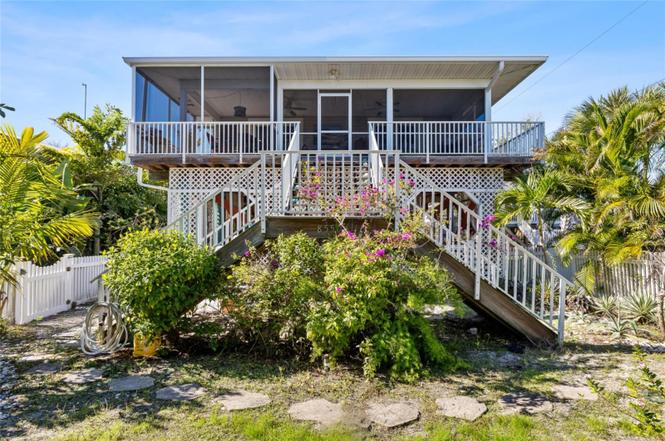
This stylish two-bedroom, two-bath home is nestled among mature tropical foliage on Little Gasparilla Island, a unique bridgeless barrier island located off the Cape Haze peninsula. The island is accessible exclusively by boat or water taxi, offering a peaceful getaway surrounded by natural beauty. Little Gasparilla Island (LGI) is renowned for its peaceful and friendly atmosphere, with no shops, restaurants, or car traffic. Designed with low maintenance in mind, the home features vinyl siding, composite decking and stair treads, as well as powder-coated aluminum railings that wrap around the exterior. These features ensure durability and minimize upkeep for homeowners. Positioned just one
Key facts
- Water views
- Garden oasis
- Outdoor shower
Tags
Property features AI
Finance
- Other: Furnished; Zoning: BBI
- HOA & community: Total annual fees $250 (approx. $20.83/month)
Exterior
- Parking: Accessible by private boat or water taxi only (transportation from Eldred's Marina)
- Utilities: Public water; Septic tank sewer; Electricity connected; Water connected
- Home design: Single family residence; One story (entry level: one); Faces east; Residential property
- Construction: Vinyl siding and frame construction; Metal roof; Stilt/on piling foundation; Built approximately as a 1-story structure
- Exterior features: French doors; Exterior lighting; Outdoor shower; Outdoor storage; Partial bay/harbor water view; Water access to bay/harbor, gulf/ocean, gulf/ocean to bay, and intracoastal waterway
Interior
- Kitchen: Dishwasher; Microwave; Range; Refrigerator; Solid surface counters; Kitchen/family room combo
- Bedrooms: 2 bedrooms
- Flooring: Ceramic tile
- Bathrooms: 2 full bathrooms
- Heating & cooling: Central heating (electric); Central air conditioning
- Interior features: Built-in features; Cathedral ceilings; Ceiling fans; High ceilings; Kitchen/family room combo; Open floorplan; Solid surface counters; Vaulted ceilings; Wet bar
- Laundry & utility: Washer; Dryer; Inside laundry in a laundry closet; Electric water heater
Neighborhood map
What this means for you Summary
Snapshot
- This is a 2-bed/2.0-bath single-family listed at $629k.
Deal economics
- At list price, monthly cash flow is $868 ($10k/yr) — positive.
- The deal already cash-flows at list — no discount required.
- Meets the 1% rule at list price ($7k rent vs $629k).
- Recommended offer: $554k (12.0% below list) — sets the bar for market timing.
- Cap rate 8.8% vs local median 3.1% in Rotonda — top-decile yield for the area; either an underpriced asset or a hidden risk that comps aren't pricing in. Stress-test before assuming the spread holds.
Location & tenants
- Location reads 67/100 on livability (#548 in FL) — a middle-class / working-renter tenant base. Strengths: crime A+, housing A-, cost of living B+; Watch: schools D, amenities F, commute F.
- Charlotte (suburban): math 54% / reading 54% proficiency, ranked #22 of 73 in FL (top 30%) — acceptable for families but not a draw, mixed tenant base, ~2y average lease.
- Market conditions: 915 active listings in the ZIP; 4 comparable units currently listed for rent nearby; rentals at typical pace (median 21d on market — plan ~3-4 weeks tenant-placement turnaround); 4,585 units permitted in Charlotte County in 2024 (703 in 5+ unit buildings).
Forward outlook
- Local home prices are declining (-1.9%/yr); year-one equity from $4k of loan paydown is wiped out by about $12k of value loss. Plan a longer hold.
- Charlotte County population projected at +24% by 2050 — long-run rental-demand tailwind backs the buy-and-hold thesis.
Negotiation context
- It's been on market 176 days — a 12% lower offer ($554k) is reasonable based on typical stale-listing flexibility.
- 8 sale attempts since 18y ago with the ask held roughly flat each time — persistent listings suggest the price (not the market) is what's stuck; bring a comps-based counter.
- Current owner paid $418k; list at $629k implies a 50% gain — meaningful room to come down on a strong offer.
Risks & watch-outs
- Watch-outs: flood insurance adds $427/mo.
- Climate carrying-cost: in FEMA flood zone AE (mandatory federal flood insurance); severe wind risk, 99% chance of damaging wind over 30y; extreme-heat days projected 7→26/yr by 2055 (HVAC capex compounding) — expect insurance premiums to compound above CPI over the hold.
Questions for the listing agent
- It's been on market 176 days. Have you received any prior offers? Is the seller open to a 12% concession, seller financing, or rate buy-down credit?
- What's the actual annual flood-insurance premium (NFIP or private), and is the property in a SFHA with mandatory coverage?
- What does the HOA fee cover, when was the last increase, and are there any pending special assessments or reserve-fund shortfalls?
- Why hasn't it sold? Are there any deal-killer items the seller is aware of (foundation, flood, title, zoning, code violations)?
- Is there a deadline driving the sale (1031 exchange, divorce, estate, relocation)? That informs how much negotiation room exists.
- Schools are D-rated, which usually means shorter tenancies and higher turnover. Who's the typical renter profile here, and what's been the actual vacancy rate?
- What's the average days-on-market for RENTAL listings here right now (not sales)? A rising rental-DOM trend means longer vacancies and softer asking-rent achievability than the comps imply.
- What's the recent tenant-quality profile in this submarket — average credit score on applications, eviction rate, late-payment / NSF rate, and stable-employment percentage? A property-management company in the area should have these aggregated.
- How much new for-sale + rental construction is in the pipeline within 1–3 miles? Heavy new supply typically softens prices + rents 12–24 months out; constrained supply supports both.
Investment metrics
- 1% rule
- 1.13% ✓
- Cap rate
- 8.76%
- Cash-on-cash
- 8.82%
- DSCR
- 1.39
- GRM
- 7.4
CMA / ARV
- ARV (on-the-fly)
- $474,000
- Comps found
- 1
Show comp detail 1 sale within ~0.75 mi
| Address | Dist | Beds/Ba | Sqft | Sold | Price | $/sf | Match |
|---|---|---|---|---|---|---|---|
| 8418 Little Gasparilla Is | 0.06mi | 3/1.0 (+1) | 1,064 (-11%) | 17mo | $420,000 | $395 | 55 |
Match score weights: distance 35% · size 25% · config 20% · recency 20%. Top-matched comps best support the ARV.
Projected returns pro-forma
-1.9% appreciation · 3.0% rent growth · sell at horizon
- IRR
- -2.4%
- Equity multiple
- 0.90×
- Total profit
- $-16,988
- Equity at exit
- $124,984
- IRR
- 5.6%
- Equity multiple
- 1.48×
- Total profit
- $84,094
- Equity at exit
- $109,514
Cash invested: $176,120 (down + closing). Projections, not guarantees.
Landlord ↔ Tenant lean methodology
- Overall (STATE)
- 87 Strongly Landlord-Friendly
- State Florida
- 87 Strongly Landlord-Friendly · R+3
- County
- — inherits STATE
- City
- — inherits STATE
ZIP-level market 33946
- Home prices YoY
- -0.7%
- Active inventory
- 915
- Price-to-rent
- 7.4×
Monthly cashflow live
- Estimated rent
- $7,118 medium interval (Pro) →
- Mortgage (P&I)
- −$3,299
- Tax from tax record
- −$748 /mo · $8,979/yr
- Insurance
- −$262
- Flood insurance flood zone
- −$427 /mo · $5,118/yr
- HOA
- −$20
- Vacancy / Maint / Mgmt
- −$1,495
- Net cashflow
- $868
Break-even live
UW: 25.0% down · 7.5% · 30yr · 1.5% tax · 5.0% vac · 8.0% maint · 8.0% mgmt
Financing live
Cash to close
- Down payment
- $157,250
- Closing costs
- $18,870
- Reserves months
- —
- Total cash needed
- —
Loan-product check · same deal, 3 products live
Conventional
25% down · 7.5% · 30yr
- Down + closing
- —
- Monthly P&I
- —
- Monthly cashflow
- —
- DSCR
- —
- Eligible?
- —
Personal DTI + credit; lowest rate.
DSCR
20% down · 8.5% · 30yr
- Down + closing
- —
- Monthly P&I
- —
- Monthly cashflow
- —
- DSCR
- —
- Eligible?
- —
No personal income docs; deal must DSCR.
Hard money
10% down · 12.0% · 12mo
- Down + closing
- —
- Monthly P&I
- —
- Monthly cashflow
- —
- DSCR
- —
- Eligible?
- —
Short-term bridge; refi at stabilization.
Rent comps 4 comps
| Address | Beds | Baths | Sqft | Rent | $/sqft | DOM | Units | Dist |
|---|---|---|---|---|---|---|---|---|
| 9400 Little Gasparilla Unit F9 Placida, FL | 2.0 | 2.0 | 946 | $6,500 | $6.87 | 21d | 1 | 0.85mi |
| 9400 Little Gasparilla Unit H8 Placida, FL | 2.0 | 2.0 | 946 | $5,850 | $6.18 | 21d | 1 | 0.85mi |
| 9400 Little Gasparilla Unit G9 Placida, FL | 2.0 | 2.0 | 946 | $6,900 | $7.29 | 21d | 1 | 0.90mi |
| 9750 Little Gasparilla Placida, FL | 3.0 | 1.5 | 957 | $10,000 | $10.45 | 21d | 1 | 1.19mi |
HOA detail
- Monthly dues
- $20 · $240/yr
- Likely covers
- watergas
Listing history 33 events
-
2026-06-18days on market $629,000 Active 176 DOM
-
2026-06-17days on market $629,000 Active 175 DOM
-
2026-06-16days on market $629,000 Active 174 DOM
-
2026-06-15days on market $629,000 Active 173 DOM
-
2026-06-14days on market $629,000 Active 171 DOM
-
2026-06-13days on market $629,000 Active 170 DOM
-
2026-06-10days on market $629,000 Active 168 DOM
-
2026-06-09days on market $629,000 Active 167 DOM
-
2026-06-08days on market $629,000 Active 166 DOM
-
2026-06-05days on market $629,000 Active 162 DOM
-
2026-06-03days on market $629,000 Active 161 DOM
-
2026-06-02days on market $629,000 Active 160 DOM
-
2026-06-01days on market $629,000 Active 159 DOM
-
2026-05-31days on market $629,000 Active 158 DOM
-
2026-05-30days on market $629,000 Active 157 DOM
-
2025-12-24$629,000 Active
-
2019-03-26soldstatus $418,000
-
2018-09-20historical
-
2018-05-11price $424,000
-
2017-06-16$434,900 Active
-
2017-02-10historical
-
2016-11-16$434,900 Active
-
2016-08-15historical
-
2016-02-25status Active
-
2016-01-22historical
-
2015-10-25$449,000 Active
-
2015-10-17historical
-
2015-06-23status Active
-
2015-06-22historical
-
2015-04-22$449,000 Active
-
2009-08-28soldstatus $405,000
-
2008-11-13$489,000
-
2003-07-11soldstatus $105,000
ⓘ Source: listings_history table (triggers on properties + properties_extension) + one-shot
backfill from property_details.listing_events for pre-trigger history.
Tax reassessment forecast FL · Resets to sale price
- Current annual tax
- $8,979 · $748/mo
- Projected year-2 tax
- $8,979 · $748/mo
- Expected delta
- $0/yr ($0/mo · 0.0%)
ⓘ Screening estimate from a state-policy table — verify with the county assessor before closing.
Climate risk First Street
- Flood 10/10 Extreme FEMA zone AE · 99% chance over 30 yrs
- Wildfire 1/10 Low
- Heat 10/10 Extreme 7 d/yr ≥107°F today · 26 d/yr by 30 yrs out
- Wind 10/10 Extreme 99% chance of damaging wind over 30 yrs
- Air quality 3/10 Moderate 2 unhealthy d/yr today · 2 by 30 yrs out
Nearby sold comps map
Loading sold comps map…
Walkable amenities ~0.75 mi
Loading nearby amenities…
Taxation est. · year 1
- Rental income
- $85,411
- − Mortgage interest
- −$35,234
- − Property taxes
- −$8,979
- − Insurance
- −$8,264
- − Repairs & maintenance
- −$6,833
- − Management
- −$6,833
- − HOA
- −$240
- − Depreciation
- −$18,298
- Taxable income
- $731
- Est. tax owed @ 24.0%
- −$175
- After-tax cash flow
- $10,235/yr
For passive investors: Depreciation is non-cash, so a rental often shows a tax loss while cash-flowing — sheltering income. Rental losses are passive: they offset passive income freely, and up to $25,000/yr can offset ordinary (W-2) income if you actively participate and your MAGI is under $100k (phasing out to $0 by $150k); unused losses carry forward. On sale, claimed depreciation is recaptured at up to 25%, and gains may owe capital-gains tax (a 1031 exchange can defer both). Figures are a year-1 estimate at your 24.0% rate — not tax advice; consult a CPA.
Schools (NCES district)
- District
- Charlotte
- NCES district ID
- 1200240
- Math proficiency
- 54% ▼ -6.00%
- Reading proficiency
- 54% ▼ -1.00%
- Median HH income
- $44,864
- Composite
- 45.62/100
- National rank
- #2586
- State rank
- #22 of 73 in FL
Livability — Rotonda
- Score
- 67/100
- State rank
- #548
- US rank
- #10359
Category grades
Schools grade is shown separately in the Schools card above.
Census & demographics
- City population
- 10,490
- Population (ZIP)
- 2,745
Population outlook (Charlotte County) Hauer SSP2
- Today (2025)
- 198,646 people
- By 2030
- 210,507 · +6.0%
- By 2040
- 230,857 · +16.2%
- By 2050
- 247,148 · +24.4%
- By 2075
- 281,777 · +41.8%
- By 2100
- 293,609 · +47.8%
Race, ethnicity, and origin ACS 2023
- Neighborhood character
- Predominantly White (95%)
- Race & ethnicity
- White 95% Hispanic / Latino 2% Asian 1% Two or more races 1%
- Common ancestry
- Italian 3% Romanian 2% Russian 2%
- Foreign-born
- 6% · Canada
- Languages at home
- 91% English-only · Russian/Polish/Slavic 5% Spanish 1% French/Haitian/Cajun 1%
Political lean MEDSL · Charlotte
- 2024 margin
- Solid R (+34.0) · D 32.7% · R 66.7%
- 2008→2024 swing
- -26.7pp toward R · 2008: -7.2pp · 2024: -34.0pp
- All cycles
- 2024: R+34.0 2020: R+26.6 2016: R+27.8 2012: R+14.3 2008: R+7.2
Not yet ingested
- Civics
- —
Market trends
- HPI YoY
- ▼ -1.90%
- Current HPI
- 288.559
- Rent YoY
- —
- Metro
- —
- State GDP YoY
- ▲ 3.28%
- F500 in state
- 36
Industry mix (Fortune 500 HQ in FL)
| Industry | F500 HQs | Revenue |
|---|---|---|
| Industrial Technology | 2 | $29B |
|
||
| Insurance | 2 | $17B |
|
||
| Retail | 1 | $60B |
|
||
| Technology Distribution | 1 | $58B |
|
||
| Homebuilding | 1 | $35B |
|
||
| Technology Manufacturing | 1 | $35B |
|
||
Price history
+499.0% since first listed18 events — show timeline
- 2025-12-24 Listed $629,000 Stellar MLS as Distributed by MLS Grid
- 2019-03-26 Sold (Public Records) $418,000 Public Records
- 2018-09-20 Listing Removed — Stellar MLS as Distributed by MLS Grid
- 2018-05-11 Price Changed $424,000 Stellar MLS as Distributed by MLS Grid
- 2017-06-16 Listed $434,900 Stellar MLS as Distributed by MLS Grid
- 2017-02-10 Listing Removed — Stellar MLS as Distributed by MLS Grid
- 2016-11-16 Listed $434,900 Stellar MLS as Distributed by MLS Grid
- 2016-08-15 Listing Removed — Stellar MLS as Distributed by MLS Grid
- 2016-02-25 Relisted — Stellar MLS as Distributed by MLS Grid
- 2016-01-22 Listing Removed — Stellar MLS as Distributed by MLS Grid
- 2015-10-25 Listed $449,000 Stellar MLS as Distributed by MLS Grid
- 2015-10-17 Listing Removed — Stellar MLS as Distributed by MLS Grid
- 2015-06-23 Relisted — Stellar MLS as Distributed by MLS Grid
- 2015-06-22 Listing Removed — Stellar MLS as Distributed by MLS Grid
- 2015-04-22 Listed $449,000 Stellar MLS as Distributed by MLS Grid
- 2009-08-28 Sold (MLS) $405,000 Stellar MLS as Distributed by MLS Grid
- 2008-11-13 Listed $489,000 Stellar MLS as Distributed by MLS Grid
- 2003-07-11 Sold (Public Records) $105,000 Public Records
Property tax history
+4.8%/yrLatest (2025): $8,979 · -3.6% YoY. Source: county tax records.
Cash-flow waterfall
monthlySold comps — $/sqft
last 12 mo · ≤1 miLoading sold comps…