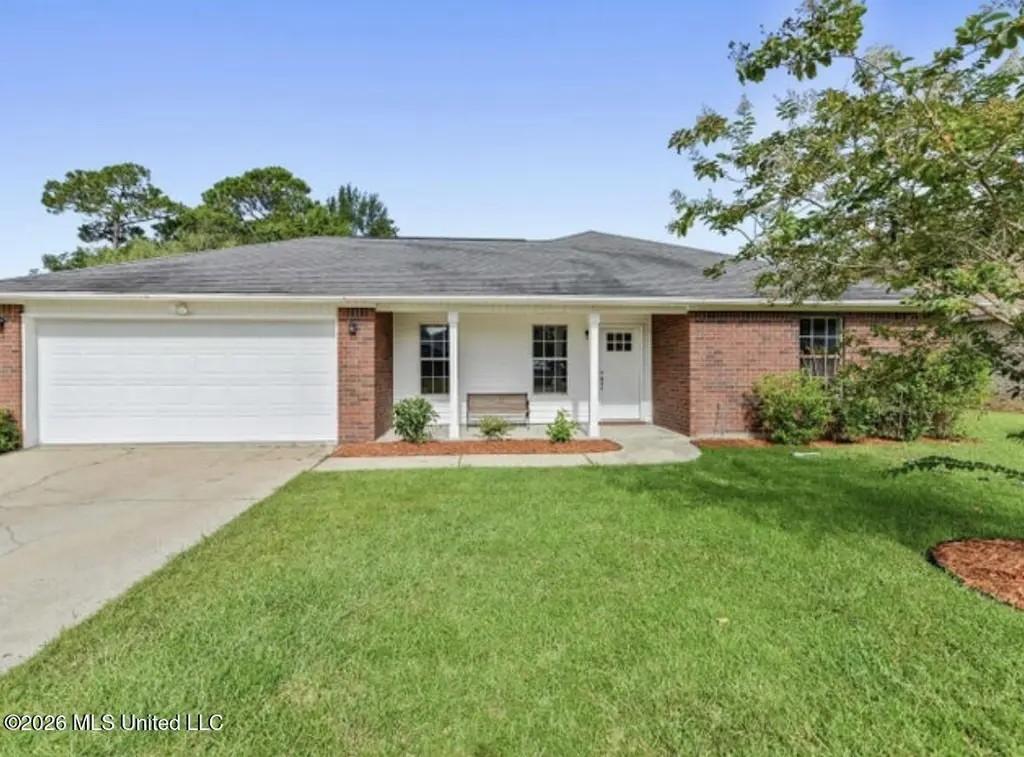
3421 N 10th St · Gulf Park Estates, MS
Flood risk 4/10 · Minor
- FEMA flood zone
- X (shaded)
- Chance of flooding over 30 yrs
- 0.13%
- Est. flood insurance / yr
- $507 – $1,088
Fire risk 4/10 · Minor
- Est. fire insurance / yr
- $1,241 – $2,305
Heat risk 10/10 · Severe
- Hot days now (above 106°F)
- 7 days/yr
- Hot days in 30 yrs
- 24 days/yr
Wind risk 9/10 · Severe
- Chance of severe wind over 30 yrs
- 99.0%
Air-quality risk 2/10 · Minimal
- Unhealthy air days now
- 1 days/yr
- Unhealthy air days in 30 yrs
- 2 days/yr
Risk factors via First Street. Map © Google.
Why this score? — see what drove the D+ grade
The composite is a weighted blend of 9 inputs, each scored 0–100. Each bar is that input's sub-score; the figure is the points it added to the 100-point composite (weight × sub-score).
- Cash flow +17.8/30.0
- ARV discount +8.1/15.0
- DSCR +5.6/10.0
- Schools +5.3/10.0
- 1% rule +4.1/10.0
- Livability +3.5/5.0
- Rent growth +2.8/5.0
- Condition / age +2.5/5.0
- Appreciation +0.0/10.0
$267,000
🖨 Deal sheet 📄 Offer letter ✓ Due diligence
Listing remarks
I am pleased to present this exceptional home located in Gulf Park Estates. This three-bedroom, two-bathroom residence is situated in a quiet neighborhood with convenient access to Highway 90, downtown Ocean Springs, local restaurants, fishing piers, and the beach. Built in 1999 and recently remodeled, the property is in excellent condition. The owner is highly motivated to sell.
Key facts
- Recently remodeled
- Convenient access
- The beach
Tags
Property features AI
Exterior
- Parking: 2-car garage; Driveway; See remarks for additional parking details
- Utilities: Public water; Public sewer; Electricity available
- Home design: Single-family house; One level
- Construction: Brick and siding exterior; Architectural shingle roof; Slab foundation; Built area reported as 1,806 (per appraiser)
- Exterior features: See remarks (additional exterior details available)
Interior
- Kitchen: Electric cooktop
- Flooring: Luxury vinyl flooring
- Bathrooms: 2 full bathrooms
- Heating & cooling: Central electric heating; Central air conditioning
- Interior features: See remarks (additional interior details available); Wood burning stove fireplace
Neighborhood map
What this means for you Summary
Snapshot
- This is a 4-bed/2.0-bath single-family listed at $267k.
Deal economics
- At list price, monthly cash flow is $218 ($3k/yr) — positive.
- The deal already cash-flows at list — no discount required.
- To meet the 1% rule (rent ≥ 1% of price), the offer needs to be $243k (9.2% below list).
- Recommended offer: $243k (9.2% below list) — sets the bar for 1% rule.
- Cap rate 7.3% vs local median 5.2% in Gulf Park Estates — top-decile yield for the area; either an underpriced asset or a hidden risk that comps aren't pricing in. Stress-test before assuming the spread holds.
Location & tenants
- Location reads 70/100 on livability (#43 in MS) — a middle-class / working-renter tenant base. Strengths: crime A+, cost of living A+, housing A+; Watch: schools D+, health & safety D+, amenities F.
- Ocean Springs School District (suburban): math 64% / reading 59% proficiency, ranked #1 of 130 in MS (top 1%) — acceptable for families but not a draw, mixed tenant base, ~2y average lease.
- Market conditions: Rents rising (+1.3%/yr); 714 active listings in the ZIP; 2 comparable units currently listed for rent nearby; solid renter incomes; 516 units permitted in Jackson County in 2024 (6 in 5+ unit buildings).
- This rent runs 37% of the median local income ($79k/yr) — at the standard rent-burdened threshold; future hikes will face affordability resistance.
Forward outlook
- Local home prices are declining (-3.0%/yr); year-one equity from $2k of loan paydown is wiped out by about $8k of value loss. Plan a longer hold.
Negotiation context
- It's been on market 17 days — a 2% lower offer ($263k) is reasonable based on typical stale-listing flexibility.
- 9 sale attempts since 6y ago with the ask held roughly flat each time — persistent listings suggest the price (not the market) is what's stuck; bring a comps-based counter.
Risks & watch-outs
- Climate carrying-cost: severe wind risk, 99% chance of damaging wind over 30y; extreme-heat days projected 7→24/yr by 2055 (HVAC capex compounding) — expect insurance premiums to compound above CPI over the hold.
Questions for the listing agent
- Is there a deadline driving the sale (1031 exchange, divorce, estate, relocation)? That informs how much negotiation room exists.
- Schools are D-rated, which usually means shorter tenancies and higher turnover. Who's the typical renter profile here, and what's been the actual vacancy rate?
- The area grade is low — what's the realistic commute time and amenity access for the typical tenant pool here? Any planned neighborhood developments (good or bad) we should know about?
- What's the average days-on-market for RENTAL listings here right now (not sales)? A rising rental-DOM trend means longer vacancies and softer asking-rent achievability than the comps imply.
- What's the recent tenant-quality profile in this submarket — average credit score on applications, eviction rate, late-payment / NSF rate, and stable-employment percentage? A property-management company in the area should have these aggregated.
- How much new for-sale + rental construction is in the pipeline within 1–3 miles? Heavy new supply typically softens prices + rents 12–24 months out; constrained supply supports both.
Investment metrics
- 1% rule
- 0.91% ✗
- Cap rate
- 7.27%
- Cash-on-cash
- 3.49%
- DSCR
- 1.16
- GRM
- 9.2
CMA / ARV
- ARV (on-the-fly)
- $270,900
- Comps found
- 12
Show comp detail 12 sales within ~0.75 mi
| Address | Dist | Beds/Ba | Sqft | Sold | Price | $/sf | Match |
|---|---|---|---|---|---|---|---|
| 3524 N 8th St | 0.16mi | 4/2.0 | 1,835 (+2%) | 2mo | $275,000 | $150 | 88 |
| 3300 N 9th St | 0.07mi | 3/2.0 (-1) | 1,858 (+3%) | 2mo | $315,000 | $170 | 85 |
| 3301 N 7th St | 0.26mi | 4/2.0 | 1,829 (+1%) | 6mo | $275,000 | $150 | 80 |
| 3425 Beachview Dr | 0.26mi | 4/2.0 | 1,993 (+10%) | 5mo | $279,900 | $140 | 67 |
| 3717 Tangerine St | 0.56mi | 3/2.0 (-1) | 1,752 (-3%) | 2mo | $250,000 | $143 | 62 |
| 2804 Beachview Dr | 0.69mi | 4/2.5 | 1,798 (-0%) | 4mo | $235,000 | $131 | 62 |
| 3212 N 5th St | 0.42mi | 3/2.0 (-1) | 1,641 (-9%) | 0mo | $249,900 | $152 | 60 |
| 9321 Coconut Dr | 0.61mi | 3/3.0 (-1) | 1,836 (+2%) | 1mo | $270,000 | $147 | 59 |
| 9336 Ridgeview Dr | 0.62mi | 3/2.0 (-1) | 1,785 (-1%) | 7mo | $380,000 | $213 | 58 |
| 124 Spanish Cove Dr | 0.52mi | 3/2.0 (-1) | 1,937 (+7%) | 6mo | $400,000 | $207 | 54 |
| 3301 Pineridge Dr | 0.69mi | 3/2.0 (-1) | 2,048 (+13%) | 0mo | $349,000 | $170 | 40 |
| 2808 Hickory Ln | 0.68mi | 3/2.5 (-1) | 2,073 (+15%) | 1mo | $269,000 | $130 | 36 |
Match score weights: distance 35% · size 25% · config 20% · recency 20%. Top-matched comps best support the ARV.
Projected returns pro-forma
-3.0% appreciation · 1.31% rent growth · sell at horizon
- IRR
- -12.6%
- Equity multiple
- 0.55×
- Total profit
- $-33,518
- Equity at exit
- $39,811
- IRR
- -6.2%
- Equity multiple
- 0.63×
- Total profit
- $-27,650
- Equity at exit
- $23,085
Cash invested: $74,760 (down + closing). Projections, not guarantees.
Landlord ↔ Tenant lean methodology
- Overall (STATE)
- 90 Strongly Landlord-Friendly
- State Mississippi
- 90 Strongly Landlord-Friendly · R+11
- County
- — inherits STATE
- City
- — inherits STATE
ZIP-level market 39564
- Home prices YoY
- -26.8%
- Rents YoY
- 1.3%
- Active inventory
- 714
- Price-to-rent
- 9.2×
Monthly cashflow live
- Estimated rent
- $2,426 medium interval (Pro) →
- Mortgage (P&I)
- −$1,400
- Tax from tax record
- −$187 /mo · $2,246/yr
- Insurance
- −$111
- HOA
- −$0
- Vacancy / Maint / Mgmt
- −$509
- Net cashflow
- $218
Break-even live
UW: 25.0% down · 7.5% · 30yr · 1.5% tax · 5.0% vac · 8.0% maint · 8.0% mgmt
Financing live
Cash to close
- Down payment
- $66,750
- Closing costs
- $8,010
- Reserves months
- —
- Total cash needed
- —
Loan-product check · same deal, 3 products live
Conventional
25% down · 7.5% · 30yr
- Down + closing
- —
- Monthly P&I
- —
- Monthly cashflow
- —
- DSCR
- —
- Eligible?
- —
Personal DTI + credit; lowest rate.
DSCR
20% down · 8.5% · 30yr
- Down + closing
- —
- Monthly P&I
- —
- Monthly cashflow
- —
- DSCR
- —
- Eligible?
- —
No personal income docs; deal must DSCR.
Hard money
10% down · 12.0% · 12mo
- Down + closing
- —
- Monthly P&I
- —
- Monthly cashflow
- —
- DSCR
- —
- Eligible?
- —
Short-term bridge; refi at stabilization.
Rent comps 2 comps
| Address | Beds | Baths | Sqft | Rent | $/sqft | DOM | Units | Dist |
|---|---|---|---|---|---|---|---|---|
| 3305 N 8th St Ocean Springs, MS | 4.0 | 2.0 | 1802 | $2,250 | $1.25 | 21d | 1 | 0.20mi |
| 106 Booth Cir Ocean Springs, MS | 4.0 | 2.0 | 2100 | $2,500 | $1.19 | 13d | 1 | 1.07mi |
Listing history 12 events
-
2026-06-18days on market $267,000 Active 17 DOM
-
2026-06-17days on market $267,000 Active 16 DOM
-
2026-06-16days on market $267,000 Active 15 DOM
-
2026-06-15days on market $267,000 Active 14 DOM
-
2026-06-14days on market $267,000 Active 12 DOM
-
2026-06-13days on market $267,000 Active 11 DOM
-
2026-06-10days on market $267,000 Active 9 DOM
-
2026-06-09days on market $267,000 Active 8 DOM
-
2026-06-08days on market $267,000 Active 7 DOM
-
2026-06-07days on market $267,000 Active 6 DOM
-
2026-06-02remarks 382-char remark
-
2026-06-02$267,000 Active 1 DOM
ⓘ Source: listings_history table (triggers on properties + properties_extension) + one-shot
backfill from property_details.listing_events for pre-trigger history.
Tax reassessment forecast MS · Resets to sale price
- Current annual tax
- $2,246 · $187/mo
- Projected year-2 tax
- $2,246 · $187/mo
- Expected delta
- $0/yr ($0/mo · 0.0%)
ⓘ Screening estimate from a state-policy table — verify with the county assessor before closing.
Climate risk First Street
- Flood 4/10 Moderate FEMA zone X (shaded) · 13% chance over 30 yrs
- Wildfire 4/10 Moderate
- Heat 10/10 Extreme 7 d/yr ≥106°F today · 24 d/yr by 30 yrs out
- Wind 9/10 Extreme 99% chance of damaging wind over 30 yrs
- Air quality 2/10 Low 1 unhealthy d/yr today · 2 by 30 yrs out
Nearby sold comps map
Loading sold comps map…
Walkable amenities ~0.75 mi
Loading nearby amenities…
Taxation est. · year 1
- Rental income
- $29,106
- − Mortgage interest
- −$14,956
- − Property taxes
- −$2,246
- − Insurance
- −$1,335
- − Repairs & maintenance
- −$2,328
- − Management
- −$2,328
- − Depreciation
- −$7,767
- Taxable loss
- −$1,855
- Est. tax savings @ 24.0%
- +$445
- After-tax cash flow
- $3,056/yr
For passive investors: Depreciation is non-cash, so a rental often shows a tax loss while cash-flowing — sheltering income. Rental losses are passive: they offset passive income freely, and up to $25,000/yr can offset ordinary (W-2) income if you actively participate and your MAGI is under $100k (phasing out to $0 by $150k); unused losses carry forward. On sale, claimed depreciation is recaptured at up to 25%, and gains may owe capital-gains tax (a 1031 exchange can defer both). Figures are a year-1 estimate at your 24.0% rate — not tax advice; consult a CPA.
Schools (NCES district)
- District
- Ocean Springs School District
- NCES district ID
- 2803360
- Math proficiency
- 64% ▼ -3.00%
- Reading proficiency
- 59% ▲ 1.00%
- Median HH income
- $60,485
- Composite
- 53.35/100
- National rank
- #1477
- State rank
- #1 of 130 in MS
Livability — Gulf Park Estates
- Score
- 70/100
- State rank
- #43
- US rank
- #7955
Category grades
Schools grade is shown separately in the Schools card above.
Census & demographics
- Census place
- Gulf Park Estates, MS
- County
- Jackson County · 82,196 people
- Metro
- Gulfport-Biloxi, MS
- Population (ZIP)
- 43,240
- Household income
- $78,596
- Rent vs Own
- Severe rent burden
- 734.0
Population outlook (Jackson County) Hauer SSP2
- Today (2025)
- 146,926 people
- By 2030
- 148,442 · +1.0%
- By 2040
- 149,631 · +1.8%
- By 2050
- 148,723 · +1.2%
- By 2075
- 147,845 · +0.6%
- By 2100
- 144,510 · -1.6%
Race, ethnicity, and origin ACS 2023
- Neighborhood character
- Predominantly White (74%)
- Race & ethnicity
- White 74% Black 10% Hispanic / Latino 8% Two or more races 7% Asian 4%
- Hispanic origin (detail)
- Mexican 3% Puerto Rican 2%
- Common ancestry
- Lithuanian 5% Slovak 4% Romanian 2%
- Foreign-born
- 5% · Canada, South Korea, Vietnam
- Languages at home
- 93% English-only · Spanish 3% Vietnamese 2% Tagalog/Filipino 1%
Political lean MEDSL · Jackson
- 2024 margin
- Solid R (+39.9) · D 29.5% · R 69.4% · Other 1.1%
- 2008→2024 swing
- -6.4pp toward R · 2008: -33.5pp · 2024: -39.9pp
- All cycles
- 2024: R+39.9 2020: R+34.6 2016: R+39.9 2012: R+36.1 2008: R+33.5
Not yet ingested
- Civics
- —
Market trends
- HPI YoY
- ▼ -74.77%
- Current HPI
- 204.2244
- Rent YoY
- ▲ 1.31%
- Metro
- Gulfport-Biloxi, MS
- State GDP YoY
- —
- F500 in state
- 0
Price history
+41.3% since first listed24 events — show timeline
- 2026-06-01 Listed $267,000 MLSU
- 2026-04-01 Listing Removed — MLSU
- 2026-03-23 Listed $267,000 MLSU
- 2026-03-22 Listing Removed — MLSU
- 2025-11-29 Listed $272,000 MLSU
- 2025-11-20 Rental Removed $1,900 TURBOTENANT
- 2025-11-13 Price Changed $1,900 TURBOTENANT
- 2025-11-07 Listed for Rent $1,950 TURBOTENANT
- 2025-02-27 Rental Removed $1,900 TURBOTENANT
- 2025-02-19 Price Changed $1,900 TURBOTENANT
- 2025-01-28 Listed for Rent $1,899 TURBOTENANT
- 2024-08-06 Rental Removed $2,200 MLSU
- 2024-07-17 Price Changed $2,200 MLSU
- 2024-07-07 Listed for Rent $2,300 MLSU
- 2024-06-30 Rental Removed $2,200 MLSU
- 2024-06-22 Listed for Rent $2,200 MLSU
- 2024-06-07 Sold (MLS) — MLSU
- 2024-06-03 Sold (Public Records) — Public Records
- 2024-05-08 Pending — MLSU
- 2024-04-28 Price Changed $235,000 MLSU
- 2024-04-24 Listed $245,000 MLSU
- 2020-10-13 Sold (Public Records) — Public Records
- 2020-10-08 Sold (MLS) — MLSU
- 2020-08-01 Listed $189,000 MLSU
Property tax history
+1.7%/yrLatest (2025): $2,246 · +74.9% YoY. Source: county tax records.
Cash-flow waterfall
monthlySold comps — $/sqft
last 12 mo · ≤1 miLoading sold comps…