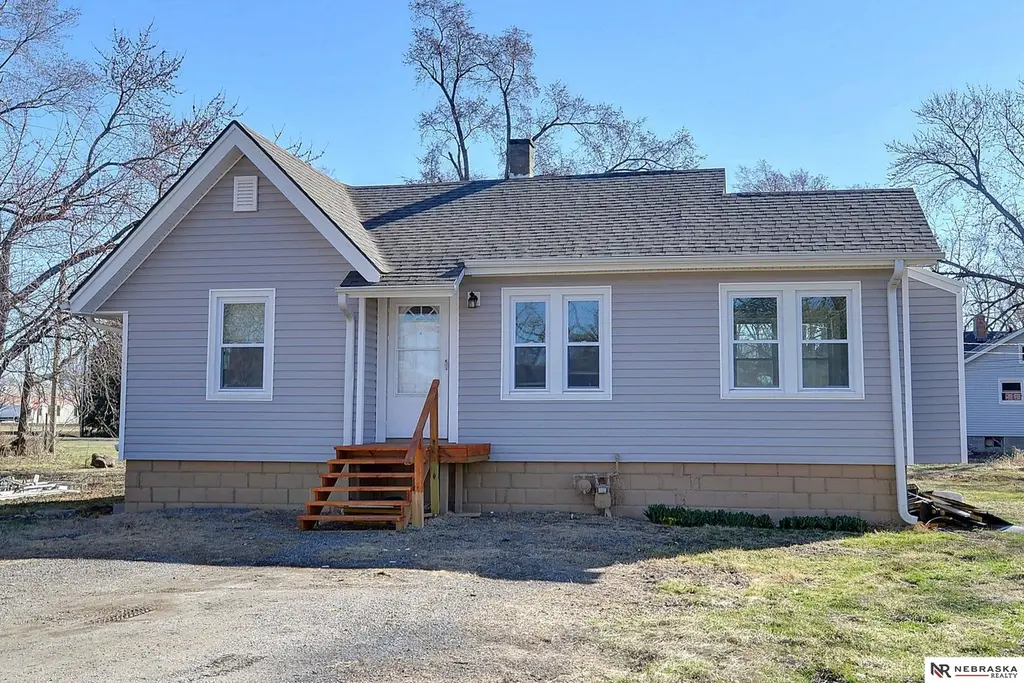
5217 N 9th Street East · Omaha, NE
Flood risk 4/10 · Minor
- FEMA flood zone
- X
- Chance of flooding over 30 yrs
- 0.22%
- Est. flood insurance / yr
- $473 – $860
Fire risk 2/10 · Minimal
- Est. fire insurance / yr
- $1,161 – $2,155
Heat risk 3/10 · Minor
- Hot days now (above 105°F)
- 7 days/yr
- Hot days in 30 yrs
- 15 days/yr
Wind risk 2/10 · Minimal
- Chance of severe wind over 30 yrs
- —
Air-quality risk 2/10 · Minimal
- Unhealthy air days now
- 1 days/yr
- Unhealthy air days in 30 yrs
- 1 days/yr
Risk factors via First Street. Map © Google.
Why this score? — see what drove the C+ grade
The composite is a weighted blend of 9 inputs, each scored 0–100. Each bar is that input's sub-score; the figure is the points it added to the 100-point composite (weight × sub-score).
- Cash flow +23.8/30.0
- ARV discount +13.0/15.0
- DSCR +7.7/10.0
- 1% rule +5.5/10.0
- Livability +4.2/5.0
- Rent growth +2.5/5.0
- Condition / age +2.5/5.0
- Schools +2.1/10.0
- Appreciation +0.0/10.0
$129,500
🖨 Deal sheet 📄 Offer letter ✓ Due diligence
Listing remarks
Contract Pending. Cute as a button and fully updated ranch home near Carter Lake! This move-in ready 2-bedroom, 1-bath ranch features new windows, siding, engineered wood floors, kitchen cabinets, and stainless steel appliances, plus main floor washer and dryer included. The bright, modern kitchen and open living space make everyday living easy. Enjoy relaxing or entertaining on the new deck overlooking a huge lot with plenty of space to garden, play, or expand. Located just steps from Carter Lake and Levi Carter Park, offering walking trails, bike paths, fishing, boating, and a public boat ramp. Prime location just minutes from Eppley Airfield, Downtown Omaha, the Old Market, CHI Health Ce
Key facts
- New siding
- Kitchen cabinets
- New windows
Tags
Property features AI
Exterior
- Parking: Off-street parking
- Utilities: Public water; Septic tank; Electricity available; Natural gas available
- Home design: Single-family residential home; Not new / not a model; One-story; Built in 1936
- Construction: Vinyl siding; Composition roof; Block foundation
- Exterior features: Porch; Deck; Window coverings
Interior
- Kitchen: Dining area; Sliding glass door in kitchen; Engineered wood flooring in kitchen; Range; Refrigerator; Dishwasher; Microwave
- Bedrooms: Main-floor primary bedroom (about 11.0 x 10.1 ft); Main-floor second bedroom (about 12.1 x 8.1 ft)
- Flooring: Engineered wood; Ceramic tile
- Bathrooms: One full bathroom (main floor)
- Heating & cooling: Natural gas forced-air heating; Central air conditioning
- Interior features: Ceiling fans; Sliding doors; Sump pump
- Laundry & utility: Washer; Dryer
Neighborhood map
What this means for you Summary
Snapshot
- This is a 2-bed/1.0-bath single-family listed at $130k.
Deal economics
- At list price, monthly cash flow is $248 ($3k/yr) — positive.
- The deal already cash-flows at list — no discount required.
- Meets the 1% rule at list price ($1k rent vs $130k).
- Recommended offer: $126k (3.0% below list) — sets the bar for market timing.
- Cap rate 8.6% vs local median 3.6% in Omaha — top-decile yield for the area; either an underpriced asset or a hidden risk that comps aren't pricing in. Stress-test before assuming the spread holds.
Location & tenants
- Location reads 84/100 on livability (#7 in NE, #663 nationally) — a professional / high-income tenant draw. Strengths: amenities A+, commute A+, cost of living A+; Watch: crime F.
- Omaha Public Schools (urban): math 20% / reading 28% proficiency, ranked #110 of 111 in NE (top 99%) — low school quality limits family demand, transient renter base, plan for 1-2y turnover; 62% free/reduced lunch — lower-income household profile, screen leases tightly.
- Zoned schools: Sherman Elementary School (math 8% / reading 22%, grade F, #482 of 502 statewide, top 96%, 225 students, 0% FRL); North High School (math 21% / reading 25%, grade F, #247 of 261 statewide, top 95%, 1,796 students, 0% FRL) — zoned schools average 0% FRL vs 62% district-wide (62 pts lower); this property's tenant base skews higher-income than the district average.
- Market conditions: 45 active listings in the ZIP; 4,539 units permitted in Douglas County in 2024 (2,583 in 5+ unit buildings).
Forward outlook
- Local home prices are declining (-3.0%/yr); year-one equity from $895 of loan paydown is wiped out by about $4k of value loss. Plan a longer hold.
- Douglas County population projected at +28% by 2050 — long-run rental-demand tailwind backs the buy-and-hold thesis.
Negotiation context
- It's been on market 31 days — a 3% lower offer ($126k) is reasonable based on typical stale-listing flexibility.
- 4 sale attempts with the ask held roughly flat each time — persistent listings suggest the price (not the market) is what's stuck; bring a comps-based counter.
- Current owner paid $110k; 18% above their basis — modest negotiation headroom, anchor on the comps not their cost.
Risks & watch-outs
- Watch-outs: built in 1936 — expect roof / HVAC / electrical / plumbing capex.
Questions for the listing agent
- It's been on market 31 days. Have you received any prior offers? Is the seller open to a 3% concession, seller financing, or rate buy-down credit?
- Built in 1936 — when were the roof, HVAC, electrical panel, plumbing, and water heater last replaced?
- Is there a deadline driving the sale (1031 exchange, divorce, estate, relocation)? That informs how much negotiation room exists.
- Crime grade is F in this area — have there been break-ins, vandalism, or insurance claims at this property in the last 3 years? What carrier currently insures it and at what premium?
- What's the average days-on-market for RENTAL listings here right now (not sales)? A rising rental-DOM trend means longer vacancies and softer asking-rent achievability than the comps imply.
- What's the recent tenant-quality profile in this submarket — average credit score on applications, eviction rate, late-payment / NSF rate, and stable-employment percentage? A property-management company in the area should have these aggregated.
- How much new for-sale + rental construction is in the pipeline within 1–3 miles? Heavy new supply typically softens prices + rents 12–24 months out; constrained supply supports both.
Investment metrics
- 1% rule
- 1.05% ✓
- Cap rate
- 8.59%
- Cash-on-cash
- 8.21%
- DSCR
- 1.37
- GRM
- 7.9
CMA / ARV
- ARV (median comp)
- $147,567
- List price
- $129,500
- Delta
- -12.24%
- Verdict
- UNDERPRICED
- Comps
- 20 within 1.0 mi
Show comp detail 2 sales within ~0.75 mi
| Address | Dist | Beds/Ba | Sqft | Sold | Price | $/sf | Match |
|---|---|---|---|---|---|---|---|
| 5217 N 9th St | 0.00mi | 2/1.0 | 711 (0%) | 18mo | $110,000 | $155 | 85 |
| 1001 E Fort St | 0.06mi | 1/1.0 (-1) | 729 (+2%) | 18mo | $115,000 | $158 | 73 |
Match score weights: distance 35% · size 25% · config 20% · recency 20%. Top-matched comps best support the ARV.
Projected returns pro-forma
-3.0% appreciation · 3.0% rent growth · sell at horizon
- IRR
- -3.8%
- Equity multiple
- 0.86×
- Total profit
- $-5,209
- Equity at exit
- $19,309
- IRR
- 5.8%
- Equity multiple
- 1.43×
- Total profit
- $15,715
- Equity at exit
- $11,197
Cash invested: $36,260 (down + closing). Projections, not guarantees.
Landlord ↔ Tenant lean methodology
- Overall (STATE)
- 83 Strongly Landlord-Friendly
- State Nebraska
- 83 Strongly Landlord-Friendly · R+13
- County
- — inherits STATE
- City
- — inherits STATE
ZIP-level market 68110
- Home prices YoY
- -9.5%
- Active inventory
- 45
- Price-to-rent
- 7.9×
Monthly cashflow live
- Estimated rent
- $1,358 medium interval (Pro) →
- Mortgage (P&I)
- −$679
- Tax from tax record
- −$92 /mo · $1,102/yr
- Insurance
- −$54
- HOA
- −$0
- Vacancy / Maint / Mgmt
- −$285
- Net cashflow
- $248
Break-even live
UW: 25.0% down · 7.5% · 30yr · 1.5% tax · 5.0% vac · 8.0% maint · 8.0% mgmt
Financing live
Cash to close
- Down payment
- $32,375
- Closing costs
- $3,885
- Reserves months
- —
- Total cash needed
- —
Loan-product check · same deal, 3 products live
Conventional
25% down · 7.5% · 30yr
- Down + closing
- —
- Monthly P&I
- —
- Monthly cashflow
- —
- DSCR
- —
- Eligible?
- —
Personal DTI + credit; lowest rate.
DSCR
20% down · 8.5% · 30yr
- Down + closing
- —
- Monthly P&I
- —
- Monthly cashflow
- —
- DSCR
- —
- Eligible?
- —
No personal income docs; deal must DSCR.
Hard money
10% down · 12.0% · 12mo
- Down + closing
- —
- Monthly P&I
- —
- Monthly cashflow
- —
- DSCR
- —
- Eligible?
- —
Short-term bridge; refi at stabilization.
Listing history 19 events
-
2026-06-15status $129,500 Pending 31 DOM
-
2026-06-15days on market $129,500 Active 31 DOM
-
2026-06-13days on market $129,500 Active 29 DOM
-
2026-06-10days on market $129,500 Active 26 DOM
-
2026-06-09days on market $129,500 Active 25 DOM
-
2026-06-08days on market $129,500 Active 24 DOM
-
2026-06-07days on market $129,500 Active 23 DOM
-
2026-06-03days on market $129,500 Active 19 DOM
-
2026-06-03days on market $129,500 Active 18 DOM
-
2026-06-01days on market $129,500 Active 17 DOM
-
2026-06-01days on market $129,500 Active 16 DOM
-
2026-05-15$129,500 New 870-char remark
-
2026-05-15historical
-
2026-04-28$135,000 New
-
2026-04-28historical
-
2026-04-11historical
-
2026-04-10$140,000 New
-
2026-03-11$150,000 New
-
2024-12-16soldstatus $110,000
ⓘ Source: listings_history table (triggers on properties + properties_extension) + one-shot
backfill from property_details.listing_events for pre-trigger history.
Tax reassessment forecast NE · Resets to sale price
- Current annual tax
- $1,102 · $92/mo
- Projected year-2 tax
- $2,240 · $187/mo
- Expected delta
- +$1,138/yr (+$95/mo · 103.3%)
ⓘ Screening estimate from a state-policy table — verify with the county assessor before closing.
Climate risk First Street
- Flood 4/10 Moderate FEMA zone X · 22% chance over 30 yrs
- Wildfire 2/10 Low
- Heat 3/10 Moderate 7 d/yr ≥105°F today · 15 d/yr by 30 yrs out
- Wind 2/10 Low
- Air quality 2/10 Low 1 unhealthy d/yr today · 1 by 30 yrs out
Nearby sold comps map
Loading sold comps map…
Walkable amenities ~0.75 mi
Loading nearby amenities…
Taxation est. · year 1
- Rental income
- $16,298
- − Mortgage interest
- −$7,254
- − Property taxes
- −$1,102
- − Insurance
- −$648
- − Repairs & maintenance
- −$1,304
- − Management
- −$1,304
- − Depreciation
- −$3,767
- Taxable income
- $919
- Est. tax owed @ 24.0%
- −$221
- After-tax cash flow
- $2,756/yr
For passive investors: Depreciation is non-cash, so a rental often shows a tax loss while cash-flowing — sheltering income. Rental losses are passive: they offset passive income freely, and up to $25,000/yr can offset ordinary (W-2) income if you actively participate and your MAGI is under $100k (phasing out to $0 by $150k); unused losses carry forward. On sale, claimed depreciation is recaptured at up to 25%, and gains may owe capital-gains tax (a 1031 exchange can defer both). Figures are a year-1 estimate at your 24.0% rate — not tax advice; consult a CPA.
Schools (NCES district)
- District
- Omaha Public Schools
- NCES district ID
- 3174820
- Math proficiency
- 20% ▼ -10.00%
- Reading proficiency
- 28% ▼ -5.00%
- Median HH income
- $46,039
- Composite
- 20.83/100
- National rank
- #8502
- State rank
- #110 of 111 in NE
Livability — Omaha
- Score
- 84/100
- State rank
- #7
- US rank
- #663
Category grades
Schools grade is shown separately in the Schools card above.
Census & demographics
- Census place
- Omaha, NE
- City population
- 552,986
- Population (ZIP)
- 9,403
Population outlook (Douglas County) Hauer SSP2
- Today (2025)
- 625,245 people
- By 2030
- 661,613 · +5.8%
- By 2040
- 732,395 · +17.1%
- By 2050
- 801,988 · +28.3%
- By 2075
- 968,637 · +54.9%
- By 2100
- 1,101,871 · +76.2%
Race, ethnicity, and origin ACS 2023
- Neighborhood character
- Highly diverse neighborhood (Simpson 0.72)
- Race & ethnicity
- Black 40% White 29% Hispanic / Latino 17% Asian 9% Two or more races 8% Native American 2%
- Hispanic origin (detail)
- Mexican 15%
- Common ancestry
- Ukrainian 2% Romanian 1% Portuguese 1%
- Foreign-born
- 18% · Canada, India, Philippines
- Languages at home
- 73% English-only · Spanish 12% Other Indo-European 6% Other Asian/Pacific 3%
Political lean MEDSL · Douglas
- 2024 margin
- D (+10.2) · D 54.4% · R 44.2% · Other 1.4%
- 2008→2024 swing
- +5.5pp toward D · 2008: 4.6pp · 2024: 10.2pp
- All cycles
- 2024: D+10.2 2020: D+11.3 2016: D+1.4 2012: R+4.3 2008: D+4.6
Not yet ingested
- Civics
- —
Market trends
- HPI YoY
- ▼ -23.25%
- Current HPI
- 220.8647
- Rent YoY
- —
- Metro
- —
- State GDP YoY
- ▲ 0.68%
- F500 in state
- 2
Industry mix (Fortune 500 HQ in NE)
| Industry | F500 HQs | Revenue |
|---|---|---|
| Conglomerate | 1 | $371B |
|
||
Price history
+17.7% since first listed9 events — show timeline
- 2026-06-15 Pending — GPRMLS
- 2026-05-15 Listing Removed — GPRMLS
- 2026-05-15 Listed $129,500 GPRMLS
- 2026-04-28 Listing Removed — GPRMLS
- 2026-04-28 Listed $135,000 GPRMLS
- 2026-04-11 Listing Removed — GPRMLS
- 2026-04-10 Listed $140,000 GPRMLS
- 2026-03-11 Listed $150,000 GPRMLS
- 2024-12-16 Sold (Public Records) $110,000 Public Records
Property tax history
+5.1%/yrLatest (2025): $1,102 · +3.5% YoY. Source: county tax records.
Cash-flow waterfall
monthlySold comps — $/sqft
last 12 mo · ≤1 miLoading sold comps…