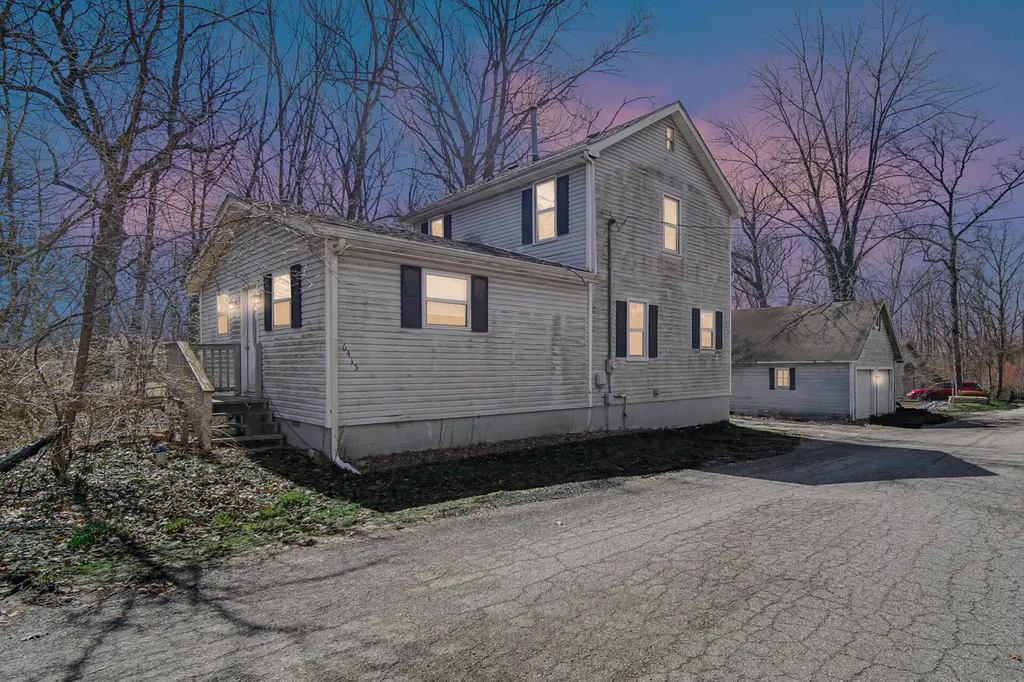
6415 W 146th Pl · Cedar Lake, IN
Flood risk 1/10 · Minimal
- FEMA flood zone
- X (unshaded)
- Chance of flooding over 30 yrs
- 0.0%
- Est. flood insurance / yr
- $507 – $1,088
Fire risk 1/10 · Minimal
- Est. fire insurance / yr
- $717 – $1,331
Heat risk 2/10 · Minimal
- Hot days now (above 101°F)
- 7 days/yr
- Hot days in 30 yrs
- 16 days/yr
Wind risk 2/10 · Minimal
- Chance of severe wind over 30 yrs
- 0.0%
Air-quality risk 2/10 · Minimal
- Unhealthy air days now
- 1 days/yr
- Unhealthy air days in 30 yrs
- 1 days/yr
Risk factors via First Street. Map © Google.
Why this score? — see what drove the C grade
The composite is a weighted blend of 9 inputs, each scored 0–100. Each bar is that input's sub-score; the figure is the points it added to the 100-point composite (weight × sub-score).
- Cash flow +19.3/30.0
- ARV discount +13.5/15.0
- DSCR +6.1/10.0
- Schools +5.0/10.0
- 1% rule +4.7/10.0
- Livability +3.2/5.0
- Rent growth +3.1/5.0
- Condition / age +2.5/5.0
- Appreciation +0.0/10.0
$199,000
🖨 Deal sheet 📄 Offer letter ✓ Due diligence
Listing remarks MLS
6 keys with this property: 1 - 45-15-35-433-021.000-043 - 014, 015, 016, 017, 022. Making lot size 150x100. This house needs a lot of TLC, but is price for quick CASH only sale.
Key facts
- 0.23 acre lot
- 2 garage spots
- Built 1991
Property features AI
Finance
- Other: Vacant occupant status
Exterior
- Parking: Detached oversized garage; Garage faces front; 2 garage spaces
- Utilities: Well water; Public sewer
- Home design: Two-story home; Built in 1991
- Construction: Has unfinished basement
- Exterior features: Neighborhood view
Interior
- Kitchen: Dishwasher; Microwave
- Bedrooms: Primary bedroom; Bedroom 2; Bedroom 3
- Flooring: Carpet; Tile
- Bathrooms: 1 full bathroom; 1 three-quarter bathroom
- Heating & cooling: Forced air heating (natural gas); Central air conditioning
- Interior features: Eat-in kitchen; Recessed lighting
Neighborhood map
What this means for you Summary
Snapshot
- This is a 3-bed/1.5-bath single-family listed at $199k.
Deal economics
- At list price, monthly cash flow is $219 ($3k/yr) — positive.
- The deal already cash-flows at list — no discount required.
- To meet the 1% rule (rent ≥ 1% of price), the offer needs to be $194k (2.6% below list).
- Recommended offer: $193k (3.0% below list) — sets the bar for market timing.
- Cap rate 7.6% vs local median 3.5% in Cedar Lake — top-decile yield for the area; either an underpriced asset or a hidden risk that comps aren't pricing in. Stress-test before assuming the spread holds.
Location & tenants
- Location reads 65/100 on livability (#354 in IN) — a middle-class / working-renter tenant base. Strengths: crime A+, cost of living A+, housing A+; Watch: amenities F, commute F, health & safety F.
- Crown Point Community School Corporation (suburban): math 51% / reading 61% proficiency, ranked #23 of 301 in IN (top 8%) — acceptable for families but not a draw, mixed tenant base, ~2y average lease; only 18% free/reduced lunch — higher-income household profile.
- Market conditions: Rents rising (+2.5%/yr); 739 active listings in the ZIP; 2 comparable units currently listed for rent nearby; solid renter incomes; 1,642 units permitted in Lake County in 2024 (14 in 5+ unit buildings).
Forward outlook
- Local home prices are declining (-3.0%/yr); year-one equity from $1k of loan paydown is wiped out by about $6k of value loss. Plan a longer hold.
- Lake County population projected to shrink 7% by 2050 — rents likely to lag national; underwrite the cash flow, not the appreciation.
Negotiation context
- It's been on market 40 days — a 3% lower offer ($193k) is reasonable based on typical stale-listing flexibility.
- 2 sale attempts since 10y ago; this cycle's ask is 14% above the opening price — seller raised mid-cycle; expect resistance to lowballs.
- Current owner paid $45k; list at $199k implies a 342% gain — meaningful room to come down on a strong offer.
Questions for the listing agent
- It's been on market 40 days. Have you received any prior offers? Is the seller open to a 3% concession, seller financing, or rate buy-down credit?
- Is there a deadline driving the sale (1031 exchange, divorce, estate, relocation)? That informs how much negotiation room exists.
- What's the average days-on-market for RENTAL listings here right now (not sales)? A rising rental-DOM trend means longer vacancies and softer asking-rent achievability than the comps imply.
- What's the recent tenant-quality profile in this submarket — average credit score on applications, eviction rate, late-payment / NSF rate, and stable-employment percentage? A property-management company in the area should have these aggregated.
- How much new for-sale + rental construction is in the pipeline within 1–3 miles? Heavy new supply typically softens prices + rents 12–24 months out; constrained supply supports both.
Investment metrics
- 1% rule
- 0.97% ✗
- Cap rate
- 7.61%
- Cash-on-cash
- 4.72%
- DSCR
- 1.21
- GRM
- 8.6
CMA / ARV
- ARV (on-the-fly)
- $229,680
- Comps found
- 12
Show comp detail 12 sales within ~0.75 mi
| Address | Dist | Beds/Ba | Sqft | Sold | Price | $/sf | Match |
|---|---|---|---|---|---|---|---|
| 6415 W 146th Pl | 0.00mi | 3/2.0 | 1,392 (0%) | 1mo | $175,000 | $126 | 97 |
| 14606 Colfax Pl | 0.05mi | 3/2.0 | 1,412 (+1%) | 12mo | $104,000 | $74 | 84 |
| 14429 Hobart St | 0.25mi | 3/2.0 | 1,400 (+1%) | 3mo | $280,000 | $200 | 83 |
| 14526 Colfax Pl | 0.10mi | 3/1.0 | 1,237 (-11%) | 11mo | $185,000 | $150 | 66 |
| 14603 Morse St | 0.44mi | 3/2.5 | 1,527 (+10%) | 2mo | $330,000 | $216 | 58 |
| 7307 W 143rd Pl | 0.65mi | 3/1.5 | 1,490 (+7%) | 1mo | $239,000 | $160 | 57 |
| 14335 Morse St | 0.55mi | 3/1.0 | 1,319 (-5%) | 10mo | $199,000 | $151 | 55 |
| 14309 Sherman St | 0.44mi | 3/1.0 | 1,488 (+7%) | 18mo | $245,000 | $165 | 51 |
| 6810 W 141st Ave | 0.72mi | 3/2.0 | 1,536 (+10%) | 13mo | $352,000 | $229 | 36 |
| 7200 W 143rd Pl | 0.63mi | 3/1.0 | 1,532 (+10%) | 20mo | $203,500 | $133 | 36 |
| 14315 Sherman St | 0.41mi | 3/2.0 | 1,188 (-15%) | 24mo | $265,000 | $223 | 35 |
| 7316 W 143rd Pl | 0.69mi | 2/1.0 (-1) | 1,196 (-14%) | 13mo | $260,000 | $217 | 26 |
Match score weights: distance 35% · size 25% · config 20% · recency 20%. Top-matched comps best support the ARV.
Projected returns pro-forma
-3.0% appreciation · 2.53% rent growth · sell at horizon
- IRR
- -9.5%
- Equity multiple
- 0.66×
- Total profit
- $-19,211
- Equity at exit
- $29,672
- IRR
- -0.7%
- Equity multiple
- 0.96×
- Total profit
- $-2,504
- Equity at exit
- $17,206
Cash invested: $55,720 (down + closing). Projections, not guarantees.
Landlord ↔ Tenant lean methodology
- Overall (STATE)
- 90 Strongly Landlord-Friendly
- State Indiana
- 90 Strongly Landlord-Friendly · R+11
- County
- — inherits STATE
- City
- — inherits STATE
ZIP-level market 46307
- Rents YoY
- 2.5%
- Active inventory
- 739
- Price-to-rent
- 8.6×
Monthly cashflow live
- Estimated rent
- $1,938 medium interval (Pro) →
- Mortgage (P&I)
- −$1,044
- Tax from tax record
- −$186 /mo · $2,229/yr
- Insurance
- −$83
- HOA
- −$0
- Vacancy / Maint / Mgmt
- −$407
- Net cashflow
- $219
Break-even live
UW: 25.0% down · 7.5% · 30yr · 1.5% tax · 5.0% vac · 8.0% maint · 8.0% mgmt
Financing live
Cash to close
- Down payment
- $49,750
- Closing costs
- $5,970
- Reserves months
- —
- Total cash needed
- —
Loan-product check · same deal, 3 products live
Conventional
25% down · 7.5% · 30yr
- Down + closing
- —
- Monthly P&I
- —
- Monthly cashflow
- —
- DSCR
- —
- Eligible?
- —
Personal DTI + credit; lowest rate.
DSCR
20% down · 8.5% · 30yr
- Down + closing
- —
- Monthly P&I
- —
- Monthly cashflow
- —
- DSCR
- —
- Eligible?
- —
No personal income docs; deal must DSCR.
Hard money
10% down · 12.0% · 12mo
- Down + closing
- —
- Monthly P&I
- —
- Monthly cashflow
- —
- DSCR
- —
- Eligible?
- —
Short-term bridge; refi at stabilization.
Rent comps 2 comps
| Address | Beds | Baths | Sqft | Rent | $/sqft | DOM | Units | Dist |
|---|---|---|---|---|---|---|---|---|
| 14508 Colfax St unit S Cedar Lake, IN | 3.0 | 2.0 | 1700 | $1,800 | $1.06 | 44d | 1 | 0.12mi |
| 14508 Colfax St Cedar Lake, IN | 2.0 | 1.0 | 1600 | $1,450 | $0.91 | 44d | 1 | 0.12mi |
Listing history 7 events
-
2026-05-11status Pending
-
2026-04-14historical Active Under Contract
-
2026-04-02price $199,000
-
2026-04-01$175,000 Active
-
2017-03-07soldstatus $45,000
-
2017-02-10soldstatus $45,000 180-char remark
Show marketing remark (180 chars)
6 keys with this property: 1 - 45-15-35-433-021.000-043 - 014, 015, 016, 017, 022. Making lot size 150x100. This house needs a lot of TLC, but is price for quick CASH only sale.
-
2016-12-06$46,530 180-char remark
Show marketing remark (180 chars)
6 keys with this property: 1 - 45-15-35-433-021.000-043 - 014, 015, 016, 017, 022. Making lot size 150x100. This house needs a lot of TLC, but is price for quick CASH only sale.
ⓘ Source: listings_history table (triggers on properties + properties_extension) + one-shot
backfill from property_details.listing_events for pre-trigger history.
Tax reassessment forecast IN · Partial reset (capped growth)
- Current annual tax
- $2,229 · $186/mo
- Projected year-2 tax
- $2,229 · $186/mo
- Expected delta
- $0/yr ($0/mo · 0.0%)
ⓘ Screening estimate from a state-policy table — verify with the county assessor before closing.
Climate risk First Street
- Flood 1/10 Low FEMA zone X (unshaded) · 0% chance over 30 yrs
- Wildfire 1/10 Low
- Heat 2/10 Low 7 d/yr ≥101°F today · 16 d/yr by 30 yrs out
- Wind 2/10 Low 0% chance of damaging wind over 30 yrs
- Air quality 2/10 Low 1 unhealthy d/yr today · 1 by 30 yrs out
Nearby sold comps map
Loading sold comps map…
Walkable amenities ~0.75 mi
Loading nearby amenities…
Taxation est. · year 1
- Rental income
- $23,261
- − Mortgage interest
- −$11,147
- − Property taxes
- −$2,229
- − Insurance
- −$995
- − Repairs & maintenance
- −$1,861
- − Management
- −$1,861
- − Depreciation
- −$5,789
- Taxable loss
- −$621
- Est. tax savings @ 24.0%
- +$149
- After-tax cash flow
- $2,779/yr
For passive investors: Depreciation is non-cash, so a rental often shows a tax loss while cash-flowing — sheltering income. Rental losses are passive: they offset passive income freely, and up to $25,000/yr can offset ordinary (W-2) income if you actively participate and your MAGI is under $100k (phasing out to $0 by $150k); unused losses carry forward. On sale, claimed depreciation is recaptured at up to 25%, and gains may owe capital-gains tax (a 1031 exchange can defer both). Figures are a year-1 estimate at your 24.0% rate — not tax advice; consult a CPA.
Schools (NCES district)
- District
- Crown Point Community School Corporation
- NCES district ID
- 1802490
- Math proficiency
- 51% ▼ -9.00%
- Reading proficiency
- 61% ▼ -8.00%
- Median HH income
- $69,148
- Composite
- 49.55/100
- National rank
- #1990
- State rank
- #23 of 301 in IN
Livability — Cedar Lake
- Score
- 65/100
- State rank
- #354
- US rank
- #13482
Category grades
Schools grade is shown separately in the Schools card above.
Census & demographics
- Census place
- Cedar Lake, IN
- County
- Lake County · 422,878 people
- City population
- 17,680
- Metro
- Chicago-Naperville-Elgin, IL-IN-WI
- Population (ZIP)
- 71,673
- Household income
- $107,800
- Rent vs Own
- Severe rent burden
- 705.0
Population outlook (Lake County) Hauer SSP2
- Today (2025)
- 484,026 people
- By 2030
- 478,091 · -1.2%
- By 2040
- 462,974 · -4.3%
- By 2050
- 449,894 · -7.1%
- By 2075
- 436,169 · -9.9%
- By 2100
- 426,607 · -11.9%
Race, ethnicity, and origin ACS 2023
- Neighborhood character
- Predominantly White (76%)
- Race & ethnicity
- White 76% Hispanic / Latino 12% Two or more races 10% Black 7% Asian 2%
- Hispanic origin (detail)
- Mexican 9% Puerto Rican 1%
- Common ancestry
- Romanian 12% Iranian 3% Lithuanian 2%
- Foreign-born
- 7% · Canada, Vietnam
- Languages at home
- 88% English-only · Spanish 5% Russian/Polish/Slavic 3% Other Indo-European 1%
Political lean MEDSL · Lake
- 2024 margin
- Lean D (+5.6) · D 52.1% · R 46.5% · Other 1.5%
- 2008→2024 swing
- -28.6pp toward R · 2008: 34.3pp · 2024: 5.6pp
- All cycles
- 2024: D+5.6 2020: D+15.1 2016: D+20.6 2012: D+31.0 2008: D+34.3
Not yet ingested
- Civics
- —
Market trends
- HPI YoY
- ▼ -164.91%
- Current HPI
- 226.0335
- Rent YoY
- ▲ 2.53%
- Metro
- Chicago-Naperville-Elgin, IL-IN-WI
- State GDP YoY
- ▲ 2.90%
- F500 in state
- 18
Industry mix (Fortune 500 HQ in IN)
| Industry | F500 HQs | Revenue |
|---|---|---|
| Industrial Machinery | 2 | $37B |
|
||
| Healthcare | 1 | $177B |
|
||
| Pharmaceuticals | 1 | $45B |
|
||
| Metals / Steel | 1 | $18B |
|
||
| Agriculture | 1 | $17B |
|
||
| Packaging | 1 | $12B |
|
||
Price history
+327.7% since first listed7 events — show timeline
- 2026-05-11 Pending — NIRA MLS as Distributed by MLS Grid
- 2026-04-14 Contingent — NIRA MLS as Distributed by MLS Grid
- 2026-04-02 Price Changed $199,000 NIRA MLS as Distributed by MLS Grid
- 2026-04-01 Listed $175,000 NIRA MLS as Distributed by MLS Grid
- 2017-03-07 Sold (Public Records) $45,000 Public Records
- 2017-02-10 Sold (MLS) $45,000 NIRA MLS as Distributed by MLS Grid
- 2016-12-06 Listed $46,530 NIRA MLS as Distributed by MLS Grid
Property tax history
+12.7%/yrLatest (2024): $2,229 · +6.9% YoY. Source: county tax records.
Cash-flow waterfall
monthlySold comps — $/sqft
last 12 mo · ≤1 miLoading sold comps…