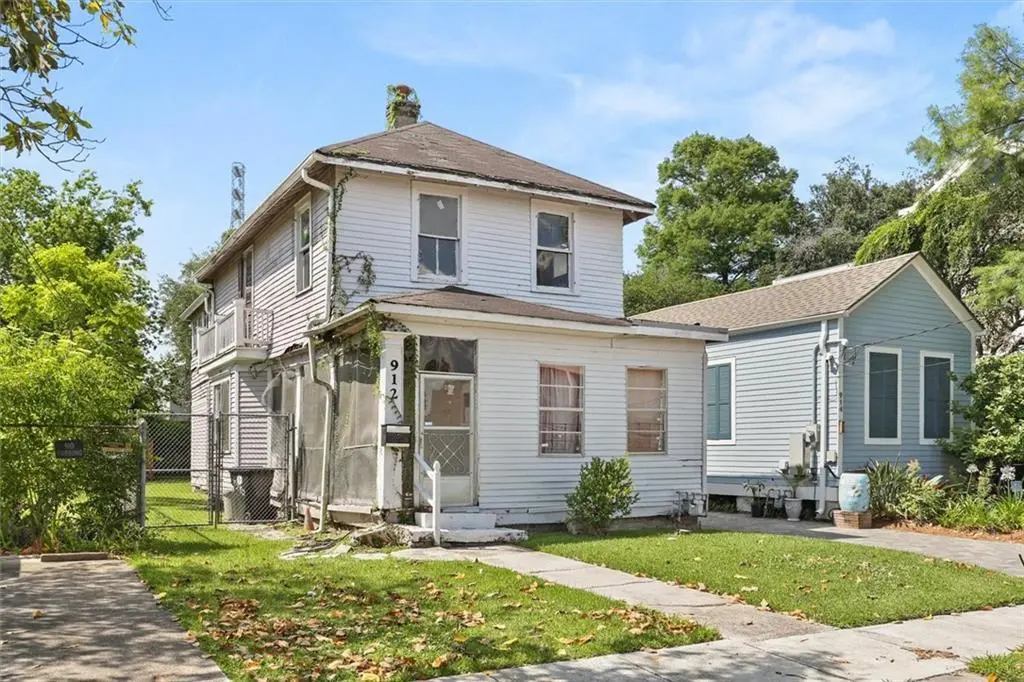
912 Cambronne St · New Orleans, LA
Flood risk 7/10 · Major
- FEMA flood zone
- X
- Chance of flooding over 30 yrs
- 0.59%
- Est. flood insurance / yr
- $507 – $1,088
Fire risk 1/10 · Minimal
- Est. fire insurance / yr
- $1,269 – $2,357
Heat risk 10/10 · Severe
- Hot days now (above 108°F)
- 7 days/yr
- Hot days in 30 yrs
- 21 days/yr
Wind risk 10/10 · Severe
- Chance of severe wind over 30 yrs
- 99.0%
Air-quality risk 3/10 · Minor
- Unhealthy air days now
- 3 days/yr
- Unhealthy air days in 30 yrs
- 4 days/yr
Risk factors via First Street. Map © Google.
Why this score? — see what drove the C- grade
The composite is a weighted blend of 9 inputs, each scored 0–100. Each bar is that input's sub-score; the figure is the points it added to the 100-point composite (weight × sub-score).
- Cash flow +21.9/30.0
- ARV discount +7.5/15.0
- DSCR +7.0/10.0
- 1% rule +5.7/10.0
- Livability +4.0/5.0
- Rent growth +2.7/5.0
- Condition / age +2.5/5.0
- Schools +1.6/10.0
- Appreciation +0.0/10.0
$249,000
🖨 Deal sheet 📄 Offer letter ✓ Due diligence
Listing remarks MLS
This propeety is located in the Carrollotoin neighborhood of New Orleans, which is known for its historic charm. The property has enormous potential, featuring classic architectural details, high ceilings and original wood floorsl. A complete renovation is needed to restore its charm and maximize its value.
Key facts
- Complete renovation
- Historic charm
- Original wood floors
Tags
Property features AI
Exterior
- Parking: Off-street parking for one vehicle
- Utilities: Public water; Public sewer
- Home design: 2-story property; Raised foundation
- Construction: Frame construction; Shingle roof; Built on a raised foundation
- Exterior features: City lot with rectangular shape; Lot dimensions approximately 30 x 120
Interior
- Bathrooms: 2 full bathrooms
- Interior features: Total of 12 rooms; Property described as in poor condition
Neighborhood map
What this means for you Summary
Snapshot
- This is a 3-bed/2.0-bath single-family listed at $249k.
Deal economics
- At list price, monthly cash flow is $324 ($4k/yr) — positive.
- The deal already cash-flows at list — no discount required.
- Meets the 1% rule at list price ($3k rent vs $249k).
- Recommended offer: $242k (3.0% below list) — sets the bar for market timing.
- Cap rate 8.2% vs local median 4.4% in New Orleans — top-decile yield for the area; either an underpriced asset or a hidden risk that comps aren't pricing in. Stress-test before assuming the spread holds.
Location & tenants
- Location reads 81/100 on livability (#3 in LA, #1,383 nationally) — a professional / high-income tenant draw. Strengths: amenities A+, commute A+, health & safety A+; Watch: crime C-, employment D.
- Orleans Parish (urban): math 11% / reading 27% proficiency, ranked #69 of 98 in LA (top 70%) — low school quality limits family demand, transient renter base, plan for 1-2y turnover; 68% free/reduced lunch — lower-income household profile, screen leases tightly.
- Market conditions: Rents flat; 279 active listings in the ZIP; 40 comparable units currently listed for rent nearby; rentals at typical pace (median 24d on market — plan ~3-4 weeks tenant-placement turnaround); 710 units permitted in Orleans Parish in 2024 (244 in 5+ unit buildings).
- At $2,673/mo this rent would consume 50% of the median local household income ($64k/yr) (locally 2237% of renters already pay >50% of income on rent) — very limited rent-growth headroom before tenants either downsize or default.
Forward outlook
- Local home prices are declining (-3.0%/yr); year-one equity from $2k of loan paydown is wiped out by about $7k of value loss. Plan a longer hold.
- Orleans County population projected at +61% by 2050 — long-run rental-demand tailwind backs the buy-and-hold thesis.
Negotiation context
- It's been on market 54 days — a 3% lower offer ($242k) is reasonable based on typical stale-listing flexibility.
- 4 sale attempts since 2y ago with the ask held roughly flat each time — persistent listings suggest the price (not the market) is what's stuck; bring a comps-based counter.
- Current owner paid $13k; list at $249k implies a 1815% gain — meaningful room to come down on a strong offer.
Risks & watch-outs
- Watch-outs: flood insurance adds $66/mo; built in 1940 — expect roof / HVAC / electrical / plumbing capex.
- Climate carrying-cost: major flood risk; severe wind risk, 99% chance of damaging wind over 30y; extreme-heat days projected 7→21/yr by 2055 (HVAC capex compounding) — expect insurance premiums to compound above CPI over the hold.
Questions for the listing agent
- It's been on market 54 days. Have you received any prior offers? Is the seller open to a 3% concession, seller financing, or rate buy-down credit?
- Built in 1940 — when were the roof, HVAC, electrical panel, plumbing, and water heater last replaced?
- What's the actual annual flood-insurance premium (NFIP or private), and is the property in a SFHA with mandatory coverage?
- Is there a deadline driving the sale (1031 exchange, divorce, estate, relocation)? That informs how much negotiation room exists.
- What's the average days-on-market for RENTAL listings here right now (not sales)? A rising rental-DOM trend means longer vacancies and softer asking-rent achievability than the comps imply.
- What's the recent tenant-quality profile in this submarket — average credit score on applications, eviction rate, late-payment / NSF rate, and stable-employment percentage? A property-management company in the area should have these aggregated.
- How much new for-sale + rental construction is in the pipeline within 1–3 miles? Heavy new supply typically softens prices + rents 12–24 months out; constrained supply supports both.
Investment metrics
- 1% rule
- 1.07% ✓
- Cap rate
- 8.18%
- Cash-on-cash
- 6.73%
- DSCR
- 1.30
- GRM
- 7.8
CMA / ARV
- ARV (median comp)
- $605,489
- List price
- $249,000
- Delta
- -58.88%
- Verdict
- UNDERPRICED
- Comps
- 20 within 1.0 mi
Show comp detail 12 sales within ~0.75 mi
| Address | Dist | Beds/Ba | Sqft | Sold | Price | $/sf | Match |
|---|---|---|---|---|---|---|---|
| 8221 Freret St | 0.13mi | 3/2.5 | 2,047 (+0%) | 1mo | $638,000 | $312 | 90 |
| 8227 Burthe St | 0.11mi | 2/2.0 (-1) | 1,778 (-13%) | 0mo | $569,000 | $320 | 68 |
| 8534 Jeannette St | 0.37mi | 3/2.5 | 1,870 (-8%) | 3mo | $538,000 | $288 | 64 |
| 8723 Willow St | 0.39mi | 3/2.5 | 1,823 (-10%) | 1mo | $75,000 | $41 | 61 |
| 816 Short St | 0.30mi | 4/2.0 (+1) | 1,807 (-11%) | 1mo | $600,000 | $332 | 61 |
| 7605 Hampson St | 0.56mi | 4/2.5 (+1) | 2,200 (+8%) | 1mo | $746,513 | $339 | 52 |
| 919 Hillary St | 0.57mi | 3/3.5 | 1,850 (-9%) | 1mo | $615,000 | $332 | 52 |
| 424 Fern St | 0.47mi | 4/3.0 (+1) | 1,834 (-10%) | 1mo | $395,000 | $215 | 51 |
| 7524 Burthe St | 0.58mi | 2/2.0 (-1) | 1,841 (-10%) | 1mo | $538,500 | $293 | 51 |
| 618 Cherokee St | 0.63mi | 3/2.5 | 1,823 (-10%) | 0mo | $675,000 | $370 | 51 |
| 1921 Cambronne St | 0.68mi | 3/2.5 | 1,846 (-9%) | 4mo | $482,500 | $261 | 48 |
| 321 Hillary St | 0.69mi | 3/2.0 | 2,236 (+10%) | 6mo | $920,000 | $411 | 46 |
Match score weights: distance 35% · size 25% · config 20% · recency 20%. Top-matched comps best support the ARV.
Projected returns pro-forma
-3.0% appreciation · 0.97% rent growth · sell at horizon
- IRR
- -10.0%
- Equity multiple
- 0.64×
- Total profit
- $-24,957
- Equity at exit
- $37,127
- IRR
- -3.8%
- Equity multiple
- 0.77×
- Total profit
- $-15,879
- Equity at exit
- $21,529
Cash invested: $69,720 (down + closing). Projections, not guarantees.
Landlord ↔ Tenant lean methodology
- Overall (STATE)
- 90 Strongly Landlord-Friendly
- State Louisiana
- 90 Strongly Landlord-Friendly · R+12
- County
- — inherits STATE
- City
- — inherits STATE
ZIP-level market 70118
- Rents YoY
- 1.0%
- Active inventory
- 279
- Price-to-rent
- 7.8×
Monthly cashflow live
- Estimated rent
- $2,673 high interval (Pro) →
- Mortgage (P&I)
- −$1,306
- Tax est. 1.5%
- −$311 /mo · $3,735/yr
- Insurance
- −$104
- Flood insurance flood zone
- −$66 /mo · $798/yr
- HOA
- −$0
- Vacancy / Maint / Mgmt
- −$561
- Net cashflow
- $324
Break-even live
UW: 25.0% down · 7.5% · 30yr · 1.5% tax · 5.0% vac · 8.0% maint · 8.0% mgmt
Financing live
Cash to close
- Down payment
- $62,250
- Closing costs
- $7,470
- Reserves months
- —
- Total cash needed
- —
Loan-product check · same deal, 3 products live
Conventional
25% down · 7.5% · 30yr
- Down + closing
- —
- Monthly P&I
- —
- Monthly cashflow
- —
- DSCR
- —
- Eligible?
- —
Personal DTI + credit; lowest rate.
DSCR
20% down · 8.5% · 30yr
- Down + closing
- —
- Monthly P&I
- —
- Monthly cashflow
- —
- DSCR
- —
- Eligible?
- —
No personal income docs; deal must DSCR.
Hard money
10% down · 12.0% · 12mo
- Down + closing
- —
- Monthly P&I
- —
- Monthly cashflow
- —
- DSCR
- —
- Eligible?
- —
Short-term bridge; refi at stabilization.
Rent comps 40 comps
| Address | Beds | Baths | Sqft | Rent | $/sqft | DOM | Units | Dist |
|---|---|---|---|---|---|---|---|---|
| 1030 Short St Unit D New Orleans, LA | 3.0 | 1.0 | 2000 | $3,000 | $1.50 | 23d | 1 | 0.34mi |
| 8906 Plum St New Orleans, LA | 3.0 | 2.0 | 2000 | $2,800 | $1.40 | 43d | 1 | 0.38mi |
| 8728 Jeannette St New Orleans, LA | 3.0 | 2.0 | 1511 | $1,995 | $1.32 | 3d | 1 | 0.42mi |
| 1526 Dante St New Orleans, LA | 3.0 | 3.0 | 1446 | $3,000 | $2.07 | 17d | 1 | 0.43mi |
| 1517 Dante St New Orleans, LA | 3.0 | 1.0 | 1500 | $1,700 | $1.13 | 17d | 1 | 0.43mi |
| 7817 Maple St Unit upper New Orleans, LA | 2.0 | 1.0 | 1500 | $1,675 | $1.12 | 23d | 1 | 0.44mi |
| 1131 Fern St New Orleans, LA | 4.0 | 2.0 | 2427 | $3,600 | $1.48 | 17d | 1 | 0.45mi |
| 1539 Dante St New Orleans, LA | 3.0 | 2.0 | 2672 | $3,500 | $1.31 | 43d | 1 | 0.46mi |
| 7816 Saint Charles Ave New Orleans, LA | 3.0 | 2.0 | 2000 | $2,850 | $1.43 | 17d | 1 | 0.50mi |
| 7733 Hampson St New Orleans, LA | 3.0 | 2.5 | 1833 | $2,600 | $1.42 | 17d | 1 | 0.50mi |
| 7729 Hampson ST | 3.0 | 2.0 | 1800 | $2,300 | $1.28 | 3d | 1 | 0.50mi |
| 7800 Saint Charles Ave Unit B New Orleans, LA | 3.0 | 2.0 | 2000 | $2,700 | $1.35 | 3d | 1 | 0.51mi |
| 938 Adams St New Orleans, LA | 3.0 | 2.0 | 1600 | $3,000 | $1.88 | 17d | 1 | 0.52mi |
| 8626 Green St New Orleans, LA | 3.0 | 1.5 | 1450 | $1,500 | $1.03 | 17d | 1 | 0.52mi |
| 7824 Dominican St New Orleans, LA | 3.0 | 3.0 | 1509 | $4,000 | $2.65 | 43d | 1 | 0.57mi |
| 7625 Oak St New Orleans, LA | 3.0 | 1.0 | 1400 | $1,900 | $1.36 | 23d | 1 | 0.58mi |
| 7701 Jeannette St Unit D New Orleans, LA | 3.0 | 3.0 | 1710 | $2,800 | $1.64 | 43d | 1 | 0.66mi |
| 8927 Hickory St New Orleans, LA | 2.0 | 1.0 | 1440 | $1,500 | $1.04 | 23d | 1 | 0.68mi |
| 8426 Spruce St New Orleans, LA | 3.0 | 2.0 | 1700 | $3,000 | $1.76 | 43d | 1 | 0.70mi |
| 810 Pine St New Orleans, LA | 4.0 | 1.5 | 2000 | $3,200 | $1.60 | 43d | 1 | 0.77mi |
| 808 Pine St New Orleans, LA | 4.0 | 1.5 | 2000 | $3,200 | $1.60 | 43d | 1 | 0.77mi |
| 629 Lowerline St New Orleans, LA | 3.0 | 2.0 | 1500 | $3,500 | $2.33 | 23d | 1 | 0.77mi |
| 1003 Pine St New Orleans, LA | 4.0 | 2.0 | 1538 | $3,500 | $2.28 | 43d | 1 | 0.78mi |
| 931 Pine St New Orleans, LA | 4.0 | 2.0 | 1450 | $6,600 | $4.55 | 43d | 1 | 0.78mi |
| 544 Lowerline St New Orleans, LA | 3.0 | 2.0 | 2500 | $3,500 | $1.40 | 23d | 1 | 0.80mi |
| 7329 Birch St New Orleans, LA | 3.0 | 2.0 | 1538 | $2,350 | $1.53 | 21d | 1 | 0.80mi |
| 1300 Broadway St New Orleans, LA | 3.0 | 2.5 | 1747 | $3,000 | $1.72 | 43d | 1 | 0.82mi |
| 2102 S Carrollton Ave New Orleans, LA | 3.0 | 2.0 | 1800 | $2,250 | $1.25 | 11d | 1 | 0.83mi |
| 2102 S Carrollton Ave Unit NA New Orleans, LA | 3.0 | 2.0 | 1800 | $2,250 | $1.25 | 10d | 1 | 0.83mi |
| 1031 Broadway St New Orleans, LA | 4.0 | 2.0 | 1750 | $4,400 | $2.51 | 17d | 1 | 0.84mi |
| 2101 S Carrollton Ave New Orleans, LA | 4.0 | 2.0 | 1800 | $2,400 | $1.33 | 23d | 1 | 0.84mi |
| 7616 Cohn St Unit A New Orleans, LA | 3.0 | 2.5 | 1492 | $3,300 | $2.21 | 17d | 1 | 0.85mi |
| 1438 Broadway St Unit A New Orleans, LA | 3.0 | 1.0 | 1739 | $3,000 | $1.73 | 17d | 1 | 0.85mi |
| 1438 Broadway St Unit B New Orleans, LA | 3.0 | 1.0 | 1500 | $1,800 | $1.20 | 17d | 1 | 0.85mi |
| 624 Broadway St New Orleans, LA | 3.0 | 2.0 | 2000 | $1,800 | $0.90 | 23d | 1 | 0.85mi |
| 1530 Broadway St New Orleans, LA | 3.0 | 2.0 | 1475 | $3,900 | $2.64 | 10d | 2 | 0.88mi |
| 912 Monticello Ave New Orleans, LA | 3.0 | 2.0 | 1750 | $2,500 | $1.43 | 43d | 1 | 0.90mi |
| 427 Lowerline St Unit A New Orleans, LA | 3.0 | 2.0 | 2364 | $3,900 | $1.65 | 23d | 1 | 0.91mi |
| 1700 Broadway St New Orleans, LA | 4.0 | 2.0 | 1500 | $3,600 | $2.40 | 17d | 1 | 0.91mi |
| 2305 Joliet St New Orleans, LA | 3.0 | 2.0 | 1451 | $2,500 | $1.72 | 43d | 1 | 0.92mi |
Listing history 21 events
-
2026-06-18days on market $249,000 Active 54 DOM
-
2026-06-17days on market $249,000 Active 53 DOM
-
2026-06-16days on market $249,000 Active 52 DOM
-
2026-06-15days on market $249,000 Active 51 DOM
-
2026-06-13days on market $249,000 Active 49 DOM
-
2026-06-10days on market $249,000 Active 46 DOM
-
2026-06-09days on market $249,000 Active 45 DOM
-
2026-06-08days on market $249,000 Active 44 DOM
-
2026-06-07days on market $249,000 Active 43 DOM
-
2026-06-05days on market $249,000 Active 40 DOM
-
2026-06-03days on market $249,000 Active 39 DOM
-
2026-06-02days on market $249,000 Active 38 DOM
-
2026-06-01days on market $249,000 Active 37 DOM
-
2026-05-31days on market $249,000 Active 36 DOM
-
2026-04-25$249,000 Active 308-char remark
Show marketing remark (308 chars)
This propeety is located in the Carrollotoin neighborhood of New Orleans, which is known for its historic charm. The property has enormous potential, featuring classic architectural details, high ceilings and original wood floorsl. A complete renovation is needed to restore its charm and maximize its value.
-
2025-03-10$325,000 Active
-
2024-11-05price $330,000
-
2024-11-05price $330,000
-
2024-08-28$375,000 Active
-
1959-01-01soldstatus $13,000
ⓘ Source: listings_history table (triggers on properties + properties_extension) + one-shot
backfill from property_details.listing_events for pre-trigger history.
Climate risk First Street
- Flood 7/10 Severe FEMA zone X · 59% chance over 30 yrs
- Wildfire 1/10 Low
- Heat 10/10 Extreme 7 d/yr ≥108°F today · 21 d/yr by 30 yrs out
- Wind 10/10 Extreme 99% chance of damaging wind over 30 yrs
- Air quality 3/10 Moderate 3 unhealthy d/yr today · 4 by 30 yrs out
Nearby sold comps map
Loading sold comps map…
Walkable amenities ~0.75 mi
Loading nearby amenities…
Taxation est. · year 1
- Rental income
- $32,076
- − Mortgage interest
- −$13,948
- − Property taxes
- −$3,735
- − Insurance
- −$2,042
- − Repairs & maintenance
- −$2,566
- − Management
- −$2,566
- − Depreciation
- −$7,244
- Taxable loss
- −$25
- Est. tax savings @ 24.0%
- +$6
- After-tax cash flow
- $3,899/yr
For passive investors: Depreciation is non-cash, so a rental often shows a tax loss while cash-flowing — sheltering income. Rental losses are passive: they offset passive income freely, and up to $25,000/yr can offset ordinary (W-2) income if you actively participate and your MAGI is under $100k (phasing out to $0 by $150k); unused losses carry forward. On sale, claimed depreciation is recaptured at up to 25%, and gains may owe capital-gains tax (a 1031 exchange can defer both). Figures are a year-1 estimate at your 24.0% rate — not tax advice; consult a CPA.
Schools (NCES district)
- District
- Orleans Parish
- NCES district ID
- 2201170
- Math proficiency
- 11% ▼ -52.00%
- Reading proficiency
- 27% ▼ -46.00%
- Median HH income
- $37,011
- Composite
- 15.78/100
- National rank
- #9271
- State rank
- #69 of 98 in LA
Livability — New Orleans
- Score
- 81/100
- State rank
- #3
- US rank
- #1383
Category grades
Schools grade is shown separately in the Schools card above.
Census & demographics
- Census place
- New Orleans, LA
- County
- Orleans Parish · 338,817 people
- City population
- 338,817
- Metro
- New Orleans-Metairie, LA
- Population (ZIP)
- 36,072
- Household income
- $63,750
- Rent vs Own
- Severe rent burden
- 2237.0
Population outlook (Orleans County) Hauer SSP2
- Today (2025)
- 513,025 people
- By 2030
- 575,781 · +12.2%
- By 2040
- 700,174 · +36.5%
- By 2050
- 826,541 · +61.1%
- By 2075
- 1,123,374 · +119.0%
- By 2100
- 1,355,609 · +164.2%
Race, ethnicity, and origin ACS 2023
- Neighborhood character
- Diverse neighborhood (Simpson 0.65)
- Race & ethnicity
- White 47% Black 34% Hispanic / Latino 11% Two or more races 11% Asian 4%
- Hispanic origin (detail)
- Mexican 2%
- Common ancestry
- Lithuanian 8% Italian 2% Romanian 2%
- Foreign-born
- 9% · Canada, China
- Languages at home
- 86% English-only · Spanish 7% French/Haitian/Cajun 2% Other Indo-European 2%
Political lean MEDSL · Orleans
- 2024 margin
- Solid D (+67.0) · D 82.2% · R 15.2% · Other 2.7%
- 2008→2024 swing
- +6.7pp toward D · 2008: 60.3pp · 2024: 67.0pp
- All cycles
- 2024: D+67.0 2020: D+68.2 2016: D+66.2 2012: D+62.5 2008: D+60.3
Not yet ingested
- Civics
- —
Market trends
- HPI YoY
- ▼ -210.46%
- Current HPI
- 282.9629
- Rent YoY
- ▲ 0.97%
- Metro
- New Orleans-Metairie, LA
- State GDP YoY
- ▲ 3.29%
- F500 in state
- 10
Industry mix (Fortune 500 HQ in LA)
| Industry | F500 HQs | Revenue |
|---|---|---|
| Telecommunications | 2 | $23B |
|
||
| Utilities | 1 | $12B |
|
||
| Wholesale / Distribution | 1 | $5B |
|
||
| Advertising | 1 | $2B |
|
||
Price history
+1815.4% since first listed7 events — show timeline
- 2026-04-25 Listed $249,000 GSREIN
- 2026-04-25 Listed $249,000 AcadianaMLS
- 2025-03-10 Listed $325,000 AcadianaMLS
- 2024-11-05 Price Changed $330,000 AcadianaMLS
- 2024-11-05 Price Changed $330,000 GSREIN
- 2024-08-28 Listed $375,000 AcadianaMLS
- 1959-01-01 Sold (Public Records) $13,000 Public Records
Property tax history
+0.8%/yrLatest (2026): $84 · +0.0% YoY. Source: county tax records.
Cash-flow waterfall
monthlySold comps — $/sqft
last 12 mo · ≤1 miLoading sold comps…