12900 Walden Rd #411 · Conroe, TX
Flood risk 1/10 · Minimal
- FEMA flood zone
- X (unshaded)
- Chance of flooding over 30 yrs
- 0.0%
- Est. flood insurance / yr
- $507 – $1,088
Fire risk 1/10 · Minimal
- Est. fire insurance / yr
- $1,222 – $2,270
Heat risk 8/10 · Major
- Hot days now (above 110°F)
- 7 days/yr
- Hot days in 30 yrs
- 24 days/yr
Wind risk 8/10 · Major
- Chance of severe wind over 30 yrs
- 99.0%
Air-quality risk 2/10 · Minimal
- Unhealthy air days now
- 1 days/yr
- Unhealthy air days in 30 yrs
- 1 days/yr
Risk factors via First Street. Map © Google.
Why this score? — see what drove the D+ grade
The composite is a weighted blend of 9 inputs, each scored 0–100. Each bar is that input's sub-score; the figure is the points it added to the 100-point composite (weight × sub-score).
- Cash flow +11.3/30.0
- ARV discount +10.6/15.0
- 1% rule +7.2/10.0
- Schools +5.4/10.0
- Condition / age +3.8/5.0
- Livability +3.7/5.0
- DSCR +3.3/10.0
- Rent growth +1.7/5.0
- Appreciation +0.0/10.0
$99,500
🖨 Deal sheet 📄 Offer letter ✓ Due diligence
Listing remarks MLS
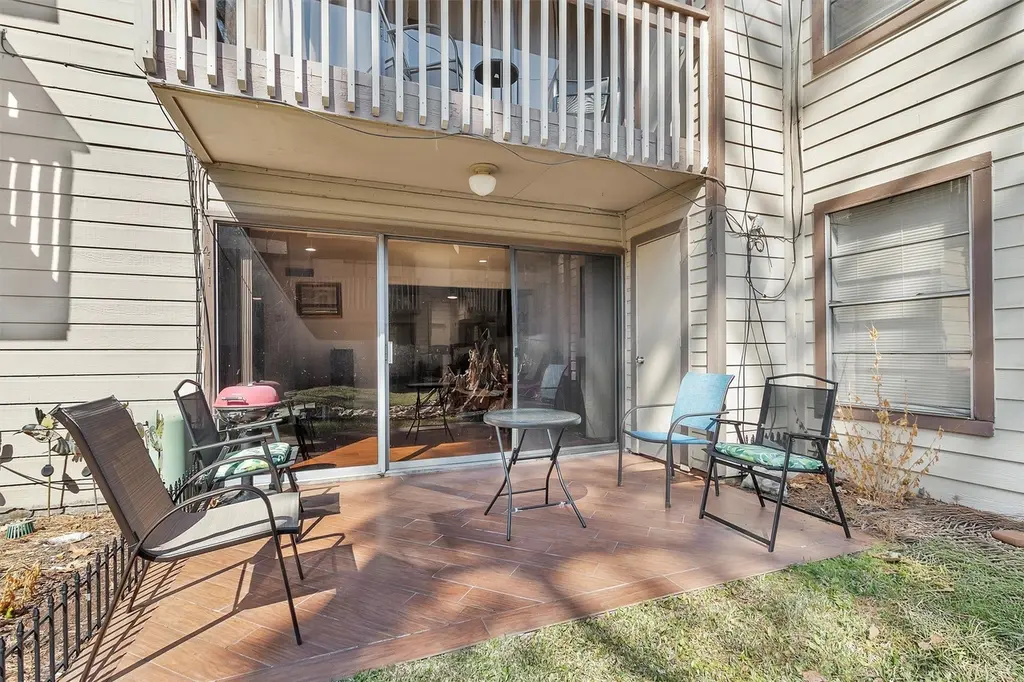
Ground level condo at Walden on Lake Conroe near the golf course. Easy access with no steps and close parking. Open layout with natural light, well-appointed kitchen, and peaceful golf course views from the private back patio. Community pool for resort-style living. Located near Walden's Golf Course, golf club/restaurant and driving range. Ideal for everyday living or weekend retreat. Perfect for family guest condo. BRING US A OFFER!
Key facts
- Easy access
- Ground level condo
- Community pool
Tags
Neighborhood map
What this means for you Summary
Snapshot
- This is a 1-bed/1.0-bath condo listed at $100k. Condition is rated good.
Deal economics
- At list price, monthly cash flow is $-36 ($-435/yr) — negative.
- To cash-flow at today's rent, offer at most $94k (5.3% below list).
- Meets the 1% rule at list price ($1k rent vs $100k).
- Recommended offer: $91k (9.0% below list) — sets the bar for market timing.
- Cap rate 5.9% vs local median 3.1% in Conroe — top-decile yield for the area; either an underpriced asset or a hidden risk that comps aren't pricing in. Stress-test before assuming the spread holds.
Location & tenants
- Location reads 74/100 on livability (#169 in TX, #4,447 nationally) — a middle-class / working-renter tenant base. Strengths: cost of living A+, housing A+, amenities B; Watch: schools D+, commute F, health & safety F.
- Montgomery ISD (rural): math 63% / reading 57% proficiency, ranked #49 of 826 in TX (top 6%) — acceptable for families but not a draw, mixed tenant base, ~2y average lease.
- Market conditions: Rents falling (-3.3%/yr); 1056 active listings in the ZIP; 1 comparable units currently listed for rent nearby; solid renter incomes; 13,259 units permitted in Montgomery County in 2024 (1,402 in 5+ unit buildings).
- This rent is only 14% of the median local income ($107k/yr) — well below the 30% rent-burden line; pricing power to push rent on renewal without tenant pushback.
Forward outlook
- Local home prices are declining (-3.0%/yr); year-one equity from $688 of loan paydown is wiped out by about $3k of value loss. Plan a longer hold.
- Montgomery County population projected at +65% by 2050 — long-run rental-demand tailwind backs the buy-and-hold thesis.
Negotiation context
- It's been on market 91 days — a 9% lower offer ($91k) is reasonable based on typical stale-listing flexibility.
Risks & watch-outs
- Watch-outs: HOA is 26% of rent.
- Climate carrying-cost: severe wind risk, 99% chance of damaging wind over 30y; extreme-heat days projected 7→24/yr by 2055 (HVAC capex compounding) — expect insurance premiums to compound above CPI over the hold.
Questions for the listing agent
- What do current leases actually rent for vs. the listed asking? Can we see a recent rent roll and the last 12 months of T-12 income?
- It's been on market 91 days. Have you received any prior offers? Is the seller open to a 9% concession, seller financing, or rate buy-down credit?
- Built in 1979 — when were the roof, HVAC, electrical panel, plumbing, and water heater last replaced?
- What does the HOA fee cover, when was the last increase, and are there any pending special assessments or reserve-fund shortfalls?
- Any open or pending special assessments — roof, HVAC, plumbing, elevator, façade? What's the per-unit balance and payoff schedule, and is the seller paying it off at close or rolling it to the buyer?
- Why hasn't it sold? Are there any deal-killer items the seller is aware of (foundation, flood, title, zoning, code violations)?
- Is there a deadline driving the sale (1031 exchange, divorce, estate, relocation)? That informs how much negotiation room exists.
- Schools are D-rated, which usually means shorter tenancies and higher turnover. Who's the typical renter profile here, and what's been the actual vacancy rate?
- The area grade is low — what's the realistic commute time and amenity access for the typical tenant pool here? Any planned neighborhood developments (good or bad) we should know about?
- What's the average days-on-market for RENTAL listings here right now (not sales)? A rising rental-DOM trend means longer vacancies and softer asking-rent achievability than the comps imply.
- What's the recent tenant-quality profile in this submarket — average credit score on applications, eviction rate, late-payment / NSF rate, and stable-employment percentage? A property-management company in the area should have these aggregated.
- How much new apartment / multifamily construction is in the pipeline within 1–3 miles? Heavy new supply (>2% of stock underway) typically softens rents 12–24 months out; light construction supports rent growth.
Investment metrics
- 1% rule
- 1.22% ✓
- Cap rate
- 5.86%
- Cash-on-cash
- -1.56%
- DSCR
- 0.93
- GRM
- 6.8
CMA / ARV
- ARV (median comp)
- $106,985
- List price
- $99,500
- Delta
- -7.00%
- Verdict
- FAIR
- Comps
- 20 within 1.0 mi
Projected returns pro-forma
-3.0% appreciation · 0.0% rent growth · sell at horizon
- IRR
- -23.7%
- Equity multiple
- 0.22×
- Total profit
- $-21,790
- Equity at exit
- $14,836
- IRR
- -39.8%
- Equity multiple
- -0.25×
- Total profit
- $-34,891
- Equity at exit
- $8,603
Cash invested: $27,860 (down + closing). Projections, not guarantees.
Landlord ↔ Tenant lean methodology
- Overall (STATE)
- 87 Strongly Landlord-Friendly
- State Texas
- 87 Strongly Landlord-Friendly · R+5
- County
- — inherits STATE
- City
- — inherits STATE
ZIP-level market 77356
- Home prices YoY
- -30.3%
- Rents YoY
- -3.3%
- Active inventory
- 1056
- Price-to-rent
- 6.8×
Monthly cashflow live
- Estimated rent
- $1,218 medium interval (Pro) →
- Mortgage (P&I)
- −$522
- Tax est. 1.5%
- −$124 /mo · $1,492/yr
- Insurance
- −$41
- HOA
- −$311
- Vacancy / Maint / Mgmt
- −$256
- Net cashflow
- $-36
Break-even live
UW: 25.0% down · 7.5% · 30yr · 1.5% tax · 5.0% vac · 8.0% maint · 8.0% mgmt
Financing live
Cash to close
- Down payment
- $24,875
- Closing costs
- $2,985
- Reserves months
- —
- Total cash needed
- —
Loan-product check · same deal, 3 products live
Conventional
25% down · 7.5% · 30yr
- Down + closing
- —
- Monthly P&I
- —
- Monthly cashflow
- —
- DSCR
- —
- Eligible?
- —
Personal DTI + credit; lowest rate.
DSCR
20% down · 8.5% · 30yr
- Down + closing
- —
- Monthly P&I
- —
- Monthly cashflow
- —
- DSCR
- —
- Eligible?
- —
No personal income docs; deal must DSCR.
Hard money
10% down · 12.0% · 12mo
- Down + closing
- —
- Monthly P&I
- —
- Monthly cashflow
- —
- DSCR
- —
- Eligible?
- —
Short-term bridge; refi at stabilization.
Rent comps 1 comps
| Address | Beds | Baths | Sqft | Rent | $/sqft | DOM | Units | Dist |
|---|---|---|---|---|---|---|---|---|
| 13151 Walden Rd Montgomery, TX | 1.0 | 1.0 | 521 | $959 | $1.84 | 2d | 1 | 0.40mi |
HOA detail condo
- Monthly dues
- $311 · $3,732/yr
- Likely covers
- pool
- Assessments
- None detected in remarks — confirm with the listing agent.
Listing history 15 events
-
2026-06-18days on market $99,500 Active 91 DOM
-
2026-06-17days on market $99,500 Active 90 DOM
-
2026-06-16days on market $99,500 Active 89 DOM
-
2026-06-15days on market $99,500 Active 88 DOM
-
2026-06-13days on market $99,500 Active 86 DOM
-
2026-06-13days on market $99,500 Active 85 DOM
-
2026-06-09days on market $99,500 Active 82 DOM
-
2026-06-08days on market $99,500 Active 81 DOM
-
2026-06-07days on market $99,500 Active 80 DOM
-
2026-06-04days on market $99,500 Active 77 DOM
-
2026-06-03days on market $99,500 Active 76 DOM
-
2026-06-02days on market $99,500 Active 75 DOM
-
2026-06-01days on market $99,500 Active 74 DOM
-
2026-05-31days on market $99,500 Active 73 DOM
-
2026-03-19$99,500 Active 437-char remark
Show marketing remark (437 chars)
Ground level condo at Walden on Lake Conroe near the golf course. Easy access with no steps and close parking. Open layout with natural light, well-appointed kitchen, and peaceful golf course views from the private back patio. Community pool for resort-style living. Located near Walden's Golf Course, golf club/restaurant and driving range. Ideal for everyday living or weekend retreat. Perfect for family guest condo. BRING US A OFFER!
ⓘ Source: listings_history table (triggers on properties + properties_extension) + one-shot
backfill from property_details.listing_events for pre-trigger history.
Climate risk First Street
- Flood 1/10 Low FEMA zone X (unshaded) · 0% chance over 30 yrs
- Wildfire 1/10 Low
- Heat 8/10 Severe 7 d/yr ≥110°F today · 24 d/yr by 30 yrs out
- Wind 8/10 Severe 99% chance of damaging wind over 30 yrs
- Air quality 2/10 Low 1 unhealthy d/yr today · 1 by 30 yrs out
Nearby sold comps map
Loading sold comps map…
Walkable amenities ~0.75 mi
Loading nearby amenities…
Taxation est. · year 1
- Rental income
- $14,619
- − Mortgage interest
- −$5,574
- − Property taxes
- −$1,492
- − Insurance
- −$498
- − Repairs & maintenance
- −$1,170
- − Management
- −$1,170
- − HOA
- −$3,732
- − Depreciation
- −$2,895
- Taxable loss
- −$1,910
- Est. tax savings @ 24.0%
- +$458
- After-tax cash flow
- $24/yr
For passive investors: Depreciation is non-cash, so a rental often shows a tax loss while cash-flowing — sheltering income. Rental losses are passive: they offset passive income freely, and up to $25,000/yr can offset ordinary (W-2) income if you actively participate and your MAGI is under $100k (phasing out to $0 by $150k); unused losses carry forward. On sale, claimed depreciation is recaptured at up to 25%, and gains may owe capital-gains tax (a 1031 exchange can defer both). Figures are a year-1 estimate at your 24.0% rate — not tax advice; consult a CPA.
Condition & rehab AI · 12 photos
This ground-level condo is in good condition with some minor repairs and maintenance needed. It offers a good layout and natural light, making it an ideal property for everyday living or weekend retreats.
Repairs flagged
- Minor kitchen countertops — Light wear and tear on countertops.
- Minor bathroom walls — Some discoloration on bathroom walls.
- Minor kitchen cabinets — Light wear and tear on kitchen cabinets.
- Minor landscaping — Overgrown areas and lack of curb appeal.
- Minor exterior paint — Some areas of exterior siding show signs of wear and tear.
Value-add opportunities
- Both Paint interior walls — Fresh paint can improve the overall appearance and value of the property.
- Both Replace countertops — New countertops can improve the functionality and aesthetic appeal of the kitchen.
- Both Landscaping improvements — A well-maintained and aesthetically pleasing landscape can significantly increase the property's curb appeal and value.
- Both HVAC maintenance — A well-maintained HVAC system can improve the comfort and energy efficiency of the property, which can positively impact both resale and rental value.
Renovation cost estimate screening
| Repair item | Severity | Est. cost |
|---|---|---|
| kitchen countertops · Light wear and tear on countertops. | Minor | $500–3,000 |
| bathroom walls · Some discoloration on bathroom walls. | Minor | $500–3,000 |
| kitchen cabinets · Light wear and tear on kitchen cabinets. | Minor | $500–3,000 |
| landscaping · Overgrown areas and lack of curb appeal. | Minor | $500–3,000 |
| exterior paint · Some areas of exterior siding show signs of wear and tear. | Minor | $500–3,000 |
| Total estimated repair cost · 5 items | $2,500–15,000 |
Value-add ROI direction
- Both Paint interior walls — Fresh paint can improve the overall appearance and value of the property. ↑
- Both Replace countertops — New countertops can improve the functionality and aesthetic appeal of the kitchen. ↑
- Both Landscaping improvements — A well-maintained and aesthetically pleasing landscape can significantly increase the property's curb appeal and value. ↑
- Both HVAC maintenance — A well-maintained HVAC system can improve the comfort and energy efficiency of the property, which can positively impact both resale and rental value. ↑
ⓘ Cost ranges are severity-bucket heuristics (US national rule-of-thumb). Get contractor quotes + a written scope before underwriting a rehab budget.
Schools (NCES district)
- District
- Montgomery ISD
- NCES district ID
- 4831260
- Math proficiency
- 63% ▼ -3.00%
- Reading proficiency
- 57% ▼ -3.00%
- Median HH income
- $75,596
- Composite
- 53.55/100
- National rank
- #1445
- State rank
- #49 of 826 in TX
Livability — Conroe
- Score
- 74/100
- State rank
- #169
- US rank
- #4447
Category grades
Schools grade is shown separately in the Schools card above.
Census & demographics
- County
- Montgomery County · 663,713 people
- City population
- 205,417
- Metro
- Houston-The Woodlands-Sugar Land, TX
- Population (ZIP)
- 32,583
- Household income
- $106,804
- Rent vs Own
- Severe rent burden
- 414.0
Population outlook (Montgomery County) Hauer SSP2
- Today (2025)
- 713,896 people
- By 2030
- 805,263 · +12.8%
- By 2040
- 992,708 · +39.1%
- By 2050
- 1,179,590 · +65.2%
- By 2075
- 1,628,084 · +128.1%
- By 2100
- 1,937,880 · +171.5%
Race, ethnicity, and origin ACS 2023
- Neighborhood character
- Predominantly White (87%)
- Race & ethnicity
- White 87% Two or more races 5% Hispanic / Latino 5% Black 4%
- Common ancestry
- Lithuanian 8% Slovak 2% Romanian 2%
- Foreign-born
- 3% · Canada, China
- Languages at home
- 96% English-only · Spanish 3%
Political lean MEDSL · Montgomery
- 2024 margin
- Solid R (+45.5) · D 26.8% · R 72.3%
- 2008→2024 swing
- +7.2pp toward D · 2008: -52.7pp · 2024: -45.5pp
- All cycles
- 2024: R+45.5 2020: R+43.8 2016: R+51.4 2012: R+60.7 2008: R+52.7
Not yet ingested
- Civics
- —
Market trends
- HPI YoY
- ▼ -101.28%
- Current HPI
- 233.0032
- Rent YoY
- ▼ -3.30%
- Metro
- Houston-The Woodlands-Sugar Land, TX
- State GDP YoY
- ▲ 3.95%
- F500 in state
- 110
Industry mix (Fortune 500 HQ in TX)
| Industry | F500 HQs | Revenue |
|---|---|---|
| Energy | 16 | $1,198B |
|
||
| Technology | 5 | $198B |
|
||
| Engineering / Construction | 4 | $72B |
|
||
| Energy Services | 3 | $60B |
|
||
| Utilities | 3 | $41B |
|
||
| Healthcare | 2 | $330B |
|
||
Price history
1 event — show timeline
- 2026-03-19 Listed $99,500 HARMLS
Cash-flow waterfall
monthlySold comps — $/sqft
last 12 mo · ≤1 miLoading sold comps…