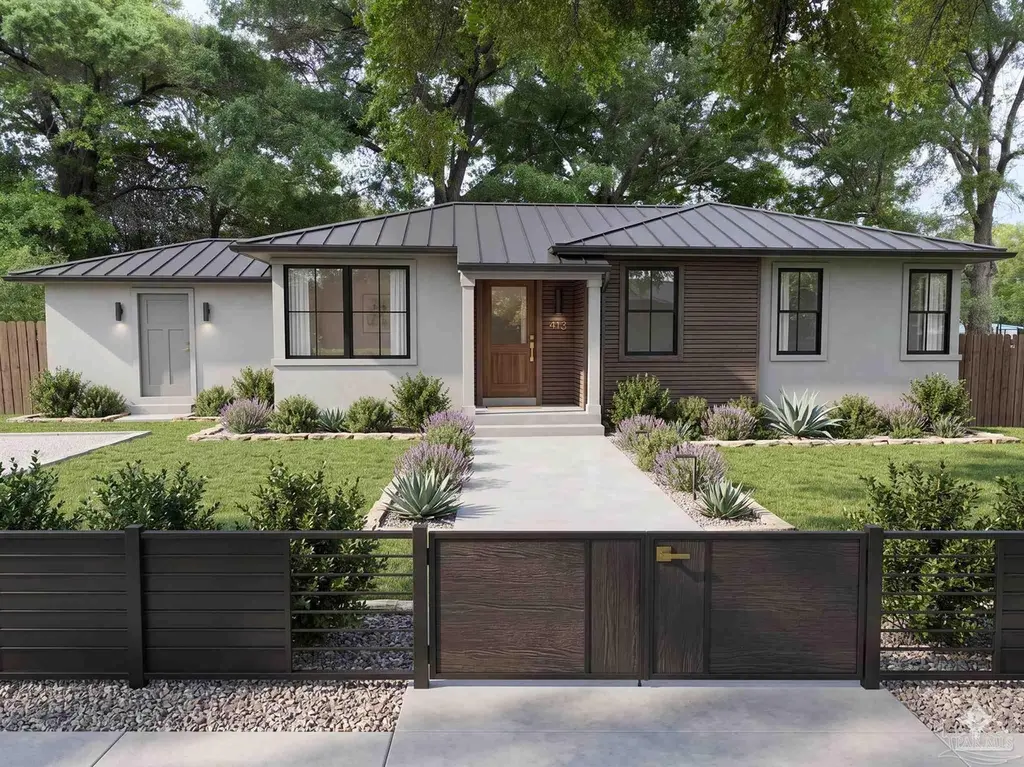
413 Frisco Rd · West Pensacola, FL
Flood risk 1/10 · Minimal
- FEMA flood zone
- X (unshaded)
- Chance of flooding over 30 yrs
- 0.0%
- Est. flood insurance / yr
- $507 – $1,088
Fire risk 2/10 · Minimal
- Est. fire insurance / yr
- $947 – $1,759
Heat risk 10/10 · Severe
- Hot days now (above 105°F)
- 7 days/yr
- Hot days in 30 yrs
- 23 days/yr
Wind risk 9/10 · Severe
- Chance of severe wind over 30 yrs
- 99.0%
Air-quality risk 1/10 · Minimal
- Unhealthy air days now
- 0 days/yr
- Unhealthy air days in 30 yrs
- 0 days/yr
Risk factors via First Street. Map © Google.
Why this score? — see what drove the B- grade
The composite is a weighted blend of 9 inputs, each scored 0–100. Each bar is that input's sub-score; the figure is the points it added to the 100-point composite (weight × sub-score).
- Cash flow +30.0/30.0
- 1% rule +10.0/10.0
- DSCR +10.0/10.0
- ARV discount +7.5/15.0
- Schools +3.6/10.0
- Livability +3.3/5.0
- Rent growth +2.8/5.0
- Condition / age +2.5/5.0
- Appreciation +0.0/10.0
$88,000
🖨 Deal sheet 📄 Offer letter ✓ Due diligence
Listing remarks
Endless Potential in the Heart of West Pensacola! Calling all investors, DIY enthusiasts, and visionaries—this property is a blank canvas ready for its next chapter. Situated on a manageable lot near NAS Pensacola and downtown, this home offers a prime opportunity to build sweat equity or create a custom residence from the ground up. The interior requires a full renovation, providing the perfect footprint to modernize the layout to your exact specifications. The exterior features a traditional frame and is located in an established neighborhood with quick access to local shopping, dining, and the white sand beaches of Perdido Key. Whether you are looking for your next "fix-and-fl
Key facts
- Traditional frame
- Full renovation
- 0.28 acre lot
Tags
Neighborhood map
What this means for you Summary
Snapshot
- This is a 4-bed/1.0-bath single-family listed at $88k.
Deal economics
- At list price, monthly cash flow is $846 ($10k/yr) — positive.
- The deal already cash-flows at list — no discount required.
- Meets the 1% rule at list price ($2k rent vs $88k).
- Cap rate 17.8% vs local median 7.7% in West Pensacola — top-decile yield for the area; either an underpriced asset or a hidden risk that comps aren't pricing in. Stress-test before assuming the spread holds.
Location & tenants
- Location reads 66/100 on livability (#629 in FL) — a middle-class / working-renter tenant base. Strengths: cost of living A+, housing A+, health & safety B+; Watch: crime D, schools F, amenities F.
- Escambia (suburban): math 40% / reading 45% proficiency, ranked #56 of 73 in FL (top 77%) — families likely to look elsewhere, expect single-tenant / working-renter base with shorter leases.
- Market conditions: Rents rising (+1.2%/yr); 702 active listings in the ZIP; 8 comparable units currently listed for rent nearby; rentals at typical pace (median 23d on market — plan ~3-4 weeks tenant-placement turnaround); 1,479 units permitted in Escambia County in 2024 (0 in 5+ unit buildings).
Forward outlook
- Local home prices are declining (-3.0%/yr); year-one equity from $608 of loan paydown is wiped out by about $3k of value loss. Plan a longer hold.
- Escambia County population projected at +13% by 2050 — modest demand growth; plan on rents tracking national, not racing it.
- At projected returns (-3.0% appreciation + 1.2% rent growth), your $25k cash investment doubles in ~3 years — after that, you're playing with house money.
Negotiation context
- Only 12 days on market — expect competitive offers; lowballing is unlikely to land.
- Current owner paid $74k; 19% above their basis — modest negotiation headroom, anchor on the comps not their cost.
Risks & watch-outs
- Climate carrying-cost: severe wind risk, 99% chance of damaging wind over 30y; extreme-heat days projected 7→23/yr by 2055 (HVAC capex compounding) — expect insurance premiums to compound above CPI over the hold.
Questions for the listing agent
- Built in 1965 — when were the roof, HVAC, electrical panel, plumbing, and water heater last replaced?
- Is there a deadline driving the sale (1031 exchange, divorce, estate, relocation)? That informs how much negotiation room exists.
- Schools are F-rated, which usually means shorter tenancies and higher turnover. Who's the typical renter profile here, and what's been the actual vacancy rate?
- Crime grade is D in this area — have there been break-ins, vandalism, or insurance claims at this property in the last 3 years? What carrier currently insures it and at what premium?
- What's the average days-on-market for RENTAL listings here right now (not sales)? A rising rental-DOM trend means longer vacancies and softer asking-rent achievability than the comps imply.
- What's the recent tenant-quality profile in this submarket — average credit score on applications, eviction rate, late-payment / NSF rate, and stable-employment percentage? A property-management company in the area should have these aggregated.
- How much new for-sale + rental construction is in the pipeline within 1–3 miles? Heavy new supply typically softens prices + rents 12–24 months out; constrained supply supports both.
Investment metrics
- 1% rule
- 2.01% ✓
- Cap rate
- 17.82%
- Cash-on-cash
- 41.19%
- DSCR
- 2.83
- GRM
- 4.2
CMA / ARV
- ARV (on-the-fly)
- $214,485
- Comps found
- 12
Show comp detail 12 sales within ~0.75 mi
| Address | Dist | Beds/Ba | Sqft | Sold | Price | $/sf | Match |
|---|---|---|---|---|---|---|---|
| 315 Frisco Ct | 0.15mi | 3/2.0 (-1) | 1,196 (+1%) | 2mo | $201,000 | $168 | 80 |
| 502 Chaseville St | 0.07mi | 3/2.0 (-1) | 1,196 (+1%) | 11mo | $140,000 | $117 | 77 |
| 130 Shadow Lawn Ln | 0.49mi | 3/2.0 (-1) | 1,215 (+2%) | 1mo | $125,000 | $103 | 63 |
| 207 Alton Rd | 0.44mi | 3/1.0 (-1) | 1,100 (-7%) | 3mo | $210,000 | $191 | 60 |
| 218 Alton Rd | 0.44mi | 3/2.0 (-1) | 1,264 (+7%) | 2mo | $255,000 | $202 | 58 |
| 105 Citrus St | 0.57mi | 3/2.0 (-1) | 1,200 (+1%) | 5mo | $170,000 | $142 | 58 |
| 805 Rue Max St | 0.54mi | 3/1.0 (-1) | 1,106 (-7%) | 1mo | $200,000 | $181 | 58 |
| 212 Ada Wilson Ave | 0.66mi | 3/2.0 (-1) | 1,132 (-4%) | 1mo | $217,000 | $192 | 52 |
| 629 Rue Max St | 0.43mi | 3/1.0 (-1) | 1,020 (-14%) | 1mo | $222,000 | $218 | 51 |
| 316 Ada Wilson Ave | 0.45mi | 4/2.0 | 1,306 (+10%) | 9mo | $162,500 | $124 | 51 |
| 204 Donald Dr | 0.40mi | 3/1.0 (-1) | 1,346 (+14%) | 9mo | $245,000 | $182 | 46 |
| 407 Rue Max St | 0.51mi | 3/1.0 (-1) | 1,029 (-13%) | 10mo | $185,000 | $180 | 41 |
Match score weights: distance 35% · size 25% · config 20% · recency 20%. Top-matched comps best support the ARV.
Projected returns pro-forma
-3.0% appreciation · 1.22% rent growth · sell at horizon
- IRR
- 35.8%
- Equity multiple
- 2.48×
- Total profit
- $36,485
- Equity at exit
- $13,121
- IRR
- 41.6%
- Equity multiple
- 4.60×
- Total profit
- $88,784
- Equity at exit
- $7,609
Cash invested: $24,640 (down + closing). Projections, not guarantees.
Landlord ↔ Tenant lean methodology
- Overall (STATE)
- 87 Strongly Landlord-Friendly
- State Florida
- 87 Strongly Landlord-Friendly · R+3
- County
- — inherits STATE
- City
- — inherits STATE
ZIP-level market 32507
- Home prices YoY
- -4.6%
- Rents YoY
- 1.2%
- Active inventory
- 702
- Price-to-rent
- 4.2×
Monthly cashflow live
- Estimated rent
- $1,766 high interval (Pro) →
- Mortgage (P&I)
- −$461
- Tax from tax record
- −$51 /mo · $616/yr
- Insurance
- −$37
- HOA
- −$0
- Vacancy / Maint / Mgmt
- −$371
- Net cashflow
- $846
Break-even live
UW: 25.0% down · 7.5% · 30yr · 1.5% tax · 5.0% vac · 8.0% maint · 8.0% mgmt
Financing live
Cash to close
- Down payment
- $22,000
- Closing costs
- $2,640
- Reserves months
- —
- Total cash needed
- —
Loan-product check · same deal, 3 products live
Conventional
25% down · 7.5% · 30yr
- Down + closing
- —
- Monthly P&I
- —
- Monthly cashflow
- —
- DSCR
- —
- Eligible?
- —
Personal DTI + credit; lowest rate.
DSCR
20% down · 8.5% · 30yr
- Down + closing
- —
- Monthly P&I
- —
- Monthly cashflow
- —
- DSCR
- —
- Eligible?
- —
No personal income docs; deal must DSCR.
Hard money
10% down · 12.0% · 12mo
- Down + closing
- —
- Monthly P&I
- —
- Monthly cashflow
- —
- DSCR
- —
- Eligible?
- —
Short-term bridge; refi at stabilization.
Rent comps 8 comps
| Address | Beds | Baths | Sqft | Rent | $/sqft | DOM | Units | Dist |
|---|---|---|---|---|---|---|---|---|
| 3740 Frontera Cir Pensacola, FL | 3.0 | 1.0 | 1024 | $1,295 | $1.26 | 23d | 1 | 0.92mi |
| 113 Rue Max St Pensacola, FL | 3.0 | 1.0 | 862 | $1,395 | $1.62 | 23d | 1 | 0.93mi |
| 1120 S Old Corry Field Rd Pensacola, FL | 3.0 | 1.0 | 1000 | $1,295 | $1.29 | 23d | 1 | 1.05mi |
| 7 Mindoro Cir Pensacola, FL | 3.0 | 1.0 | 924 | $1,395 | $1.51 | 23d | 1 | 1.23mi |
| 852 Garnet St Pensacola, FL | 3.0 | 1.5 | 1150 | $1,150 | $1.00 | 13d | 1 | 1.26mi |
| 5501 Mayfair Dr Pensacola, FL | 3.0 | 1.0 | 912 | $1,295 | $1.42 | 23d | 1 | 1.27mi |
| 45 W Carver Dr Pensacola, FL | 3.0 | 1.0 | 940 | $1,325 | $1.41 | 23d | 1 | 1.31mi |
| 4519 Martha Ave Pensacola, FL | 3.0 | 1.0 | 1104 | $1,600 | $1.45 | 23d | 1 | 1.33mi |
Listing history 8 events
-
2026-04-27status Pending
-
2026-04-23price $88,000
-
2026-04-20price $95,000
-
2026-04-14$99,000 Active
-
2005-09-29soldstatus $73,800
-
1990-06-01soldstatus $24,000
-
1990-02-01soldstatus $35,200
-
1986-10-01soldstatus $26,000
ⓘ Source: listings_history table (triggers on properties + properties_extension) + one-shot
backfill from property_details.listing_events for pre-trigger history.
Tax reassessment forecast FL · Resets to sale price
- Current annual tax
- $616 · $51/mo
- Projected year-2 tax
- $730 · $61/mo
- Expected delta
- +$115/yr (+$10/mo · 18.7%)
ⓘ Screening estimate from a state-policy table — verify with the county assessor before closing.
Climate risk First Street
- Flood 1/10 Low FEMA zone X (unshaded) · 0% chance over 30 yrs
- Wildfire 2/10 Low
- Heat 10/10 Extreme 7 d/yr ≥105°F today · 23 d/yr by 30 yrs out
- Wind 9/10 Extreme 99% chance of damaging wind over 30 yrs
- Air quality 1/10 Low 0 unhealthy d/yr today · 0 by 30 yrs out
Nearby sold comps map
Loading sold comps map…
Walkable amenities ~0.75 mi
Loading nearby amenities…
Taxation est. · year 1
- Rental income
- $21,192
- − Mortgage interest
- −$4,929
- − Property taxes
- −$616
- − Insurance
- −$440
- − Repairs & maintenance
- −$1,695
- − Management
- −$1,695
- − Depreciation
- −$2,560
- Taxable income
- $9,256
- Est. tax owed @ 24.0%
- −$2,221
- After-tax cash flow
- $7,927/yr
For passive investors: Depreciation is non-cash, so a rental often shows a tax loss while cash-flowing — sheltering income. Rental losses are passive: they offset passive income freely, and up to $25,000/yr can offset ordinary (W-2) income if you actively participate and your MAGI is under $100k (phasing out to $0 by $150k); unused losses carry forward. On sale, claimed depreciation is recaptured at up to 25%, and gains may owe capital-gains tax (a 1031 exchange can defer both). Figures are a year-1 estimate at your 24.0% rate — not tax advice; consult a CPA.
Schools (NCES district)
- District
- Escambia
- NCES district ID
- 1200510
- Math proficiency
- 40% ▼ -9.00%
- Reading proficiency
- 45% ▼ -4.00%
- Median HH income
- $44,649
- Composite
- 36.04/100
- National rank
- #4773
- State rank
- #56 of 73 in FL
Livability — West Pensacola
- Score
- 66/100
- State rank
- #629
- US rank
- #12275
Category grades
Schools grade is shown separately in the Schools card above.
Census & demographics
- Census place
- West Pensacola, FL
- County
- Escambia County · 301,722 people
- Metro
- Pensacola-Ferry Pass-Brent, FL
- Population (ZIP)
- 32,226
- Household income
- $73,540
- Rent vs Own
- Severe rent burden
- 1175.0
Population outlook (Escambia County) Hauer SSP2
- Today (2025)
- 334,637 people
- By 2030
- 345,779 · +3.3%
- By 2040
- 364,828 · +9.0%
- By 2050
- 378,514 · +13.1%
- By 2075
- 403,220 · +20.5%
- By 2100
- 386,125 · +15.4%
Race, ethnicity, and origin ACS 2023
- Neighborhood character
- Predominantly White (73%)
- Race & ethnicity
- White 73% Black 10% Two or more races 10% Hispanic / Latino 7% Asian 2%
- Hispanic origin (detail)
- Mexican 3% Puerto Rican 2%
- Common ancestry
- Slovak 3% Lithuanian 2% Romanian 2%
- Foreign-born
- 5% · Canada, Vietnam
- Languages at home
- 92% English-only · Spanish 4% Other Asian/Pacific 1% French/Haitian/Cajun 1%
Political lean MEDSL · Escambia
- 2024 margin
- R (+19.5) · D 39.7% · R 59.2% · Other 1.1%
- 2008→2024 swing
- -0.2pp no change · 2008: -19.3pp · 2024: -19.5pp
- All cycles
- 2024: R+19.5 2020: R+15.1 2016: R+20.6 2012: R+20.6 2008: R+19.3
Not yet ingested
- Civics
- —
Market trends
- HPI YoY
- ▼ -26.23%
- Current HPI
- 548.03
- Rent YoY
- ▲ 1.22%
- Metro
- Pensacola-Ferry Pass-Brent, FL
- State GDP YoY
- ▲ 3.28%
- F500 in state
- 36
Industry mix (Fortune 500 HQ in FL)
| Industry | F500 HQs | Revenue |
|---|---|---|
| Industrial Technology | 2 | $29B |
|
||
| Insurance | 2 | $17B |
|
||
| Retail | 1 | $60B |
|
||
| Technology Distribution | 1 | $58B |
|
||
| Homebuilding | 1 | $35B |
|
||
| Technology Manufacturing | 1 | $35B |
|
||
Price history
+238.5% since first listed8 events — show timeline
- 2026-04-27 Pending — PARMLS
- 2026-04-23 Price Changed $88,000 PARMLS
- 2026-04-20 Price Changed $95,000 PARMLS
- 2026-04-14 Listed $99,000 PARMLS
- 2005-09-29 Sold (Public Records) $73,800 Public Records
- 1990-06-01 Sold (Public Records) $24,000 Public Records
- 1990-02-01 Sold (Public Records) $35,200 Public Records
- 1986-10-01 Sold (Public Records) $26,000 Public Records
Property tax history
-2.6%/yrLatest (2025): $616 · +25.9% YoY. Source: county tax records.
Cash-flow waterfall
monthlySold comps — $/sqft
last 12 mo · ≤1 miLoading sold comps…