 🏗️ New Construction
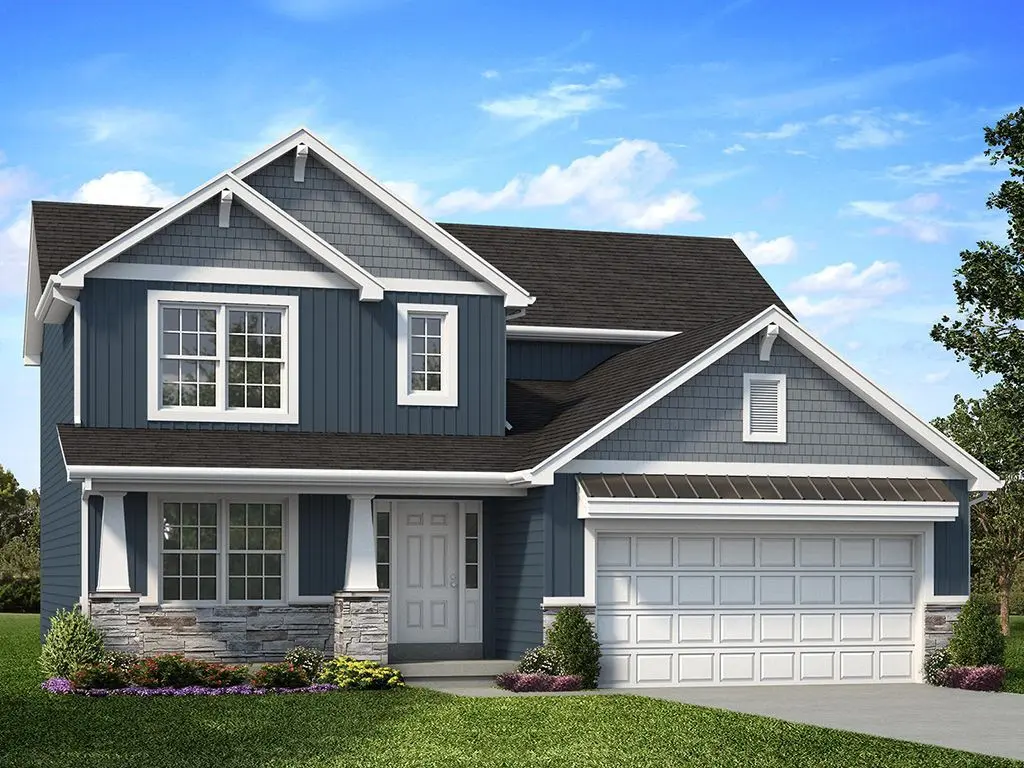
Royal II Plan · Wentzville, MO
Flood risk No data
- FEMA flood zone
- —
- Chance of flooding over 30 yrs
- —
- Est. flood insurance / yr
- —
Fire risk No data
- Est. fire insurance / yr
- —
Heat risk No data
- Hot days now (above threshold)
- —
- Hot days in 30 yrs
- —
Wind risk No data
- Chance of severe wind over 30 yrs
- —
Air-quality risk No data
- Unhealthy air days now
- —
- Unhealthy air days in 30 yrs
- —
Risk factors via First Street. Map © Google.
Why this score? — see what drove the F grade
The composite is a weighted blend of 9 inputs, each scored 0–100. Each bar is that input's sub-score; the figure is the points it added to the 100-point composite (weight × sub-score).
- ARV discount +7.5/15.0
- Cash flow +4.7/30.0
- Schools +4.3/10.0
- Livability +4.0/5.0
- Rent growth +3.5/5.0
- Condition / age +2.5/5.0
- 1% rule +0.6/10.0
- DSCR +0.0/10.0
- Appreciation +0.0/10.0
$340,900
🖨 Deal sheet (PDF) 📄 Offer letter ✓ Due diligence
Listing remarks MLS
This flexible two story home features 4 bedrooms and 2.5 baths with 7 different exterior elevation choices. The main floor is great for entertaining, with a kitchen that opens to the breakfast room and family room, plus a formal living room/dining room for additional space. Second floor features the master suite with private bath and 3 secondary bedrooms with hall bath. Additional choices include luxury kitchen floorplan, bay windows or window wall, fireplace, and luxury master bath.
Key facts
- Luxury master bath
- Bay windows
- Fireplace
Tags
Neighborhood map
What this means for you Summary
Snapshot
- This is a 4-bed/2.5-bath single-family listed at $341k.
Deal economics
- At list price, monthly cash flow is $-1k ($-13k/yr) — negative.
- To cash-flow at today's rent, offer at most $274k (19.5% below list).
- To meet the 1% rule (rent ≥ 1% of price), the offer needs to be $240k (29.6% below list).
- Recommended offer: $240k (29.6% below list) — sets the bar for 1% rule.
Location & tenants
- Location reads 81/100 on livability (#14 in MO, #1,402 nationally) — a professional / high-income tenant draw. Strengths: crime A+, employment A+, housing A+; Watch: commute F.
- Wentzville R-IV (suburban): math 44% / reading 52% proficiency, ranked #32 of 324 in MO (top 10%) — families likely to look elsewhere, expect single-tenant / working-renter base with shorter leases; only 18% free/reduced lunch — higher-income household profile.
- Market conditions: Rents rising (+4.0%/yr); 695 active listings in the ZIP; 2 comparable units currently listed for rent nearby; high-income renter base; 2,021 units permitted in St. Charles County in 2024 (568 in 5+ unit buildings).
Forward outlook
- Local home prices are declining (-3.0%/yr); year-one equity from $3k of loan paydown is wiped out by about $13k of value loss. Plan a longer hold.
- St. Charles County population projected at +22% by 2050 — long-run rental-demand tailwind backs the buy-and-hold thesis.
Negotiation context
- It's been on market 286 days — a 12% lower offer ($300k) is reasonable based on typical stale-listing flexibility.
- 2 sale attempts with the ask held roughly flat each time — persistent listings suggest the price (not the market) is what's stuck; bring a comps-based counter.
Questions for the listing agent
- What do current leases actually rent for vs. the listed asking? Can we see a recent rent roll and the last 12 months of T-12 income?
- It's been on market 286 days. Have you received any prior offers? Is the seller open to a 30% concession, seller financing, or rate buy-down credit?
- Why hasn't it sold? Are there any deal-killer items the seller is aware of (foundation, flood, title, zoning, code violations)?
- Is there a deadline driving the sale (1031 exchange, divorce, estate, relocation)? That informs how much negotiation room exists.
- Schools are B-rated — typically a magnet for longer-tenancy family renters. What's the average tenant stay here, and is there a school-zone premium baked into asking?
- The area grade is low — what's the realistic commute time and amenity access for the typical tenant pool here? Any planned neighborhood developments (good or bad) we should know about?
- What's the average days-on-market for RENTAL listings here right now (not sales)? A rising rental-DOM trend means longer vacancies and softer asking-rent achievability than the comps imply.
- What's the recent tenant-quality profile in this submarket — average credit score on applications, eviction rate, late-payment / NSF rate, and stable-employment percentage? A property-management company in the area should have these aggregated.
- How much new for-sale + rental construction is in the pipeline within 1–3 miles? Heavy new supply typically softens prices + rents 12–24 months out; constrained supply supports both.
Investment metrics
- 1% rule
- 0.56% ✗
- Cap rate
- 3.29%
- Cash-on-cash
- -10.74%
- DSCR
- 0.52
- GRM
- 14.9
CMA / ARV
- ARV (median comp)
- $430,517
- List price
- $340,900
- Delta
- -20.82%
- Verdict
- UNDERPRICED
- Comps
- 20 within 1.0 mi
Show comp detail 12 sales within ~0.75 mi
| Address | Dist | Beds/Ba | Sqft | Sold | Price | $/sf | Match |
|---|---|---|---|---|---|---|---|
| 548 Edison Way | 0.10mi | 4/2.5 | 1,902 (-5%) | 3mo | $394,900 | $208 | 85 |
| 567 Edison Way | 0.20mi | 4/2.5 | 1,902 (-5%) | 2mo | $393,781 | $207 | 81 |
| 104 Bell Blvd | 0.03mi | 3/2.5 (-1) | 1,842 (-8%) | 0mo | $422,900 | $230 | 80 |
| 411 Fleming Cir | 0.25mi | 4/2.5 | 2,081 (+4%) | 6mo | $389,900 | $187 | 76 |
| 533 Evening Primrose Dr | 0.69mi | 4/2.5 | 2,081 (+4%) | 2mo | $414,900 | $199 | 60 |
| 549 Evening Primrose Dr | 0.73mi | 3/2.0 (-1) | 1,989 (-1%) | 1mo | $449,900 | $226 | 57 |
| 25 Ramblewood Ct | 0.56mi | 4/3.0 | 1,815 (-9%) | 0mo | $324,900 | $179 | 56 |
| 144 Wilmer Valley Dr | 0.50mi | 3/2.5 (-1) | 2,255 (+13%) | 2mo | $459,000 | $204 | 49 |
| 420 Cedar Breaks Ct | 0.67mi | 3/2.0 (-1) | 1,865 (-7%) | 5mo | $497,278 | $267 | 46 |
| 424 Wilmer Meadow Dr | 0.55mi | 3/2.0 (-1) | 1,746 (-13%) | 2mo | $350,000 | $200 | 44 |
| 719 Myatt Dr | 0.62mi | 3/2.0 (-1) | 1,730 (-14%) | 6mo | $404,000 | $234 | 36 |
| 399 Butterfly Garden Dr | 0.72mi | 3/2.0 (-1) | 1,745 (-13%) | 6mo | $409,919 | $235 | 33 |
Match score weights: distance 35% · size 25% · config 20% · recency 20%. Top-matched comps best support the ARV.
Projected returns pro-forma
-3.0% appreciation · 3.96% rent growth · sell at horizon
- IRR
- -34.7%
- Equity multiple
- -0.13×
- Total profit
- $-136,077
- Equity at exit
- $64,191
- IRR
- -39.5%
- Equity multiple
- -0.63×
- Total profit
- $-197,002
- Equity at exit
- $37,223
Cash invested: $120,545 (down + closing). Projections, not guarantees.
Landlord ↔ Tenant lean methodology
- Overall (STATE)
- 81 Strongly Landlord-Friendly
- State Missouri
- 81 Strongly Landlord-Friendly · R+10
- County
- — inherits STATE
- City
- — inherits STATE
ZIP-level market 63385
- Home prices YoY
- -31.2%
- Rents YoY
- 4.0%
- Active inventory
- 695
- Price-to-rent
- 11.8×
Monthly cashflow live
- Estimated rent
- $2,401 medium interval (Pro) →
- Mortgage (P&I)
- −$2,258
- Tax est. 1.5%
- −$538 /mo · $6,458/yr
- Insurance
- −$179
- HOA
- −$0
- Vacancy / Maint / Mgmt
- −$504
- Net cashflow
- $-1,079
Break-even live
Sensitivity live
| Price | -10% $-781 | -5% $-930 | +0% $-1,079 | +5% $-1,227 | +10% $-1,376 |
|---|---|---|---|---|---|
| Rent | -10% $-1,268 | -5% $-1,173 | +0% $-1,079 | +5% $-984 | +10% $-889 |
| Rate | -1.0pp $-862 | -0.5pp $-969 | base $-1,079 | +0.5pp $-1,190 | +1.0pp $-1,304 |
UW: 25.0% down · 7.5% · 30yr · 1.5% tax · 5.0% vac · 8.0% maint · 8.0% mgmt
Financing live
Cash to close
- Down payment
- $107,629
- Closing costs
- $12,916
- Reserves months
- —
- Total cash needed
- —
Loan-product check · same deal, 3 products live
Conventional
25% down · 7.5% · 30yr
- Down + closing
- —
- Monthly P&I
- —
- Monthly cashflow
- —
- DSCR
- —
- Eligible?
- —
Personal DTI + credit; lowest rate.
DSCR
20% down · 8.5% · 30yr
- Down + closing
- —
- Monthly P&I
- —
- Monthly cashflow
- —
- DSCR
- —
- Eligible?
- —
No personal income docs; deal must DSCR.
Hard money
10% down · 12.0% · 12mo
- Down + closing
- —
- Monthly P&I
- —
- Monthly cashflow
- —
- DSCR
- —
- Eligible?
- —
Short-term bridge; refi at stabilization.
Rent comps 2 comps
| Address | Beds | Baths | Sqft | Rent | $/sqft | DOM | Units | Dist |
|---|---|---|---|---|---|---|---|---|
| 122 Peruque Estates Ln Wentzville, MO | 4.0 | 2.5 | 1852 | $2,200 | $1.19 | 44d | 1 | 0.97mi |
| 209 Pecan Bluffs Dr Wentzville, MO | 3.0 | 2.5 | 1728 | $2,295 | $1.33 | 44d | 1 | 0.99mi |
Listing history 18 events
-
2026-06-18days on market $340,900 Active 286 DOM
-
2026-06-17days on market $340,900 Active 285 DOM
-
2026-06-16days on market $340,900 Active 284 DOM
-
2026-06-15days on market $340,900 Active 283 DOM
-
2026-06-13days on market $340,900 Active 281 DOM
-
2026-06-13days on market $340,900 Active 280 DOM
-
2026-06-09days on market $340,900 Active 277 DOM
-
2026-06-08days on market $340,900 Active 276 DOM
-
2026-06-08days on market $340,900 Active 275 DOM
-
2026-06-05days on market $340,900 Active 272 DOM
-
2026-06-03days on market $340,900 Active 271 DOM
-
2026-06-02days on market $340,900 Active 270 DOM
-
2026-06-01days on market $340,900 Active 269 DOM
-
2026-05-31days on market $340,900 Active 268 DOM
-
2026-03-01price $340,900 488-char remark
Show marketing remark (488 chars)
This flexible two story home features 4 bedrooms and 2.5 baths with 7 different exterior elevation choices. The main floor is great for entertaining, with a kitchen that opens to the breakfast room and family room, plus a formal living room/dining room for additional space. Second floor features the master suite with private bath and 3 secondary bedrooms with hall bath. Additional choices include luxury kitchen floorplan, bay windows or window wall, fireplace, and luxury master bath.
-
2026-01-16status Active 488-char remark
Show marketing remark (488 chars)
This flexible two story home features 4 bedrooms and 2.5 baths with 7 different exterior elevation choices. The main floor is great for entertaining, with a kitchen that opens to the breakfast room and family room, plus a formal living room/dining room for additional space. Second floor features the master suite with private bath and 3 secondary bedrooms with hall bath. Additional choices include luxury kitchen floorplan, bay windows or window wall, fireplace, and luxury master bath.
-
2025-10-31historical 488-char remark
Show marketing remark (488 chars)
This flexible two story home features 4 bedrooms and 2.5 baths with 7 different exterior elevation choices. The main floor is great for entertaining, with a kitchen that opens to the breakfast room and family room, plus a formal living room/dining room for additional space. Second floor features the master suite with private bath and 3 secondary bedrooms with hall bath. Additional choices include luxury kitchen floorplan, bay windows or window wall, fireplace, and luxury master bath.
-
2025-06-20$337,900 Active 488-char remark
Show marketing remark (488 chars)
This flexible two story home features 4 bedrooms and 2.5 baths with 7 different exterior elevation choices. The main floor is great for entertaining, with a kitchen that opens to the breakfast room and family room, plus a formal living room/dining room for additional space. Second floor features the master suite with private bath and 3 secondary bedrooms with hall bath. Additional choices include luxury kitchen floorplan, bay windows or window wall, fireplace, and luxury master bath.
ⓘ Source: listings_history table (triggers on properties + properties_extension) + one-shot
backfill from property_details.listing_events for pre-trigger history.
Nearby sold comps map
Loading sold comps map…
Walkable amenities ~0.75 mi
Loading nearby amenities…
Taxation est. · year 1
- Rental income
- $28,810
- − Mortgage interest
- −$24,116
- − Property taxes
- −$6,458
- − Insurance
- −$2,153
- − Repairs & maintenance
- −$2,305
- − Management
- −$2,305
- − Depreciation
- −$12,524
- Taxable loss
- −$21,049
- Est. tax savings @ 24.0%
- +$5,052
- After-tax cash flow
- $-7,890/yr
For passive investors: Depreciation is non-cash, so a rental often shows a tax loss while cash-flowing — sheltering income. Rental losses are passive: they offset passive income freely, and up to $25,000/yr can offset ordinary (W-2) income if you actively participate and your MAGI is under $100k (phasing out to $0 by $150k); unused losses carry forward. On sale, claimed depreciation is recaptured at up to 25%, and gains may owe capital-gains tax (a 1031 exchange can defer both). Figures are a year-1 estimate at your 24.0% rate — not tax advice; consult a CPA.
Schools (NCES district)
- District
- Wentzville R-IV
- NCES district ID
- 2931650
- Math proficiency
- 44% ▼ -9.00%
- Reading proficiency
- 52% ▼ -7.00%
- Median HH income
- $74,961
- Composite
- 43.49/100
- National rank
- #2994
- State rank
- #32 of 324 in MO
Livability — Wentzville
- Score
- 81/100
- State rank
- #14
- US rank
- #1402
Category grades
Schools grade is shown separately in the Schools card above.
Census & demographics
- Census place
- Wentzville, MO
- County
- Saint Charles County · 399,703 people
- City population
- 51,330
- Metro
- St. Louis, MO-IL
- Population (ZIP)
- 51,330
- Household income
- $112,199
- Rent vs Own
- Severe rent burden
- 662.0
Population outlook (St. Charles County) Hauer SSP2
- Today (2025)
- 437,857 people
- By 2030
- 461,707 · +5.4%
- By 2040
- 503,222 · +14.9%
- By 2050
- 534,684 · +22.1%
- By 2075
- 597,047 · +36.4%
- By 2100
- 609,682 · +39.2%
Race, ethnicity, and origin ACS 2023
- Neighborhood character
- Predominantly White (86%)
- Race & ethnicity
- White 86% Black 5% Two or more races 5% Hispanic / Latino 3% Asian 2%
- Common ancestry
- Lithuanian 3% Romanian 3% Italian 2%
- Foreign-born
- 2% · Canada, China
- Languages at home
- 97% English-only · Spanish 2%
Political lean MEDSL · St. Charles
- 2024 margin
- R (+17.0) · D 40.8% · R 57.8% · Other 1.4%
- 2008→2024 swing
- -7.2pp toward R · 2008: -9.7pp · 2024: -17.0pp
- All cycles
- 2024: R+17.0 2020: R+17.5 2016: R+26.4 2012: R+21.0 2008: R+9.7
Not yet ingested
- Civics
- —
Market trends
- HPI YoY
- ▼ -97.98%
- Current HPI
- 216.4917
- Rent YoY
- ▲ 3.96%
- Metro
- St. Louis, MO-IL
- State GDP YoY
- ▲ 1.84%
- F500 in state
- 20
Industry mix (Fortune 500 HQ in MO)
| Industry | F500 HQs | Revenue |
|---|---|---|
| Healthcare | 1 | $163B |
|
||
| Insurance | 1 | $21B |
|
||
| Industrial Technology | 1 | $17B |
|
||
| Retail | 1 | $16B |
|
||
| Industrial Distribution | 1 | $10B |
|
||
| Utilities | 1 | $9B |
|
||
Price history
+0.9% since first listed4 events — show timeline
- 2026-03-01 Price Changed $340,900 Zillow
- 2026-01-16 Relisted — Zillow
- 2025-10-31 Delisted — Zillow
- 2025-06-20 Listed $337,900 Zillow
Cash-flow waterfall
monthlySold comps — $/sqft
last 12 mo · ≤1 miLoading sold comps…