210 E Woodlawn Ave · Jamestown, TN
Flood risk No data
- FEMA flood zone
- —
- Chance of flooding over 30 yrs
- —
- Est. flood insurance / yr
- —
Fire risk No data
- Est. fire insurance / yr
- —
Heat risk No data
- Hot days now (above threshold)
- —
- Hot days in 30 yrs
- —
Wind risk No data
- Chance of severe wind over 30 yrs
- —
Air-quality risk No data
- Unhealthy air days now
- —
- Unhealthy air days in 30 yrs
- —
Risk factors via First Street. Map © Google.
Why this score? — see what drove the A- grade
The composite is a weighted blend of 9 inputs, each scored 0–100. Each bar is that input's sub-score; the figure is the points it added to the 100-point composite (weight × sub-score).
- Cash flow +30.0/30.0
- ARV discount +15.0/15.0
- 1% rule +10.0/10.0
- DSCR +10.0/10.0
- Appreciation +10.0/10.0
- Livability +3.1/5.0
- Rent growth +2.5/5.0
- Schools +2.1/10.0
- Condition / age +1.0/5.0
$69,900
🖨 Deal sheet 📄 Offer letter ✓ Due diligence
Listing remarks MLS
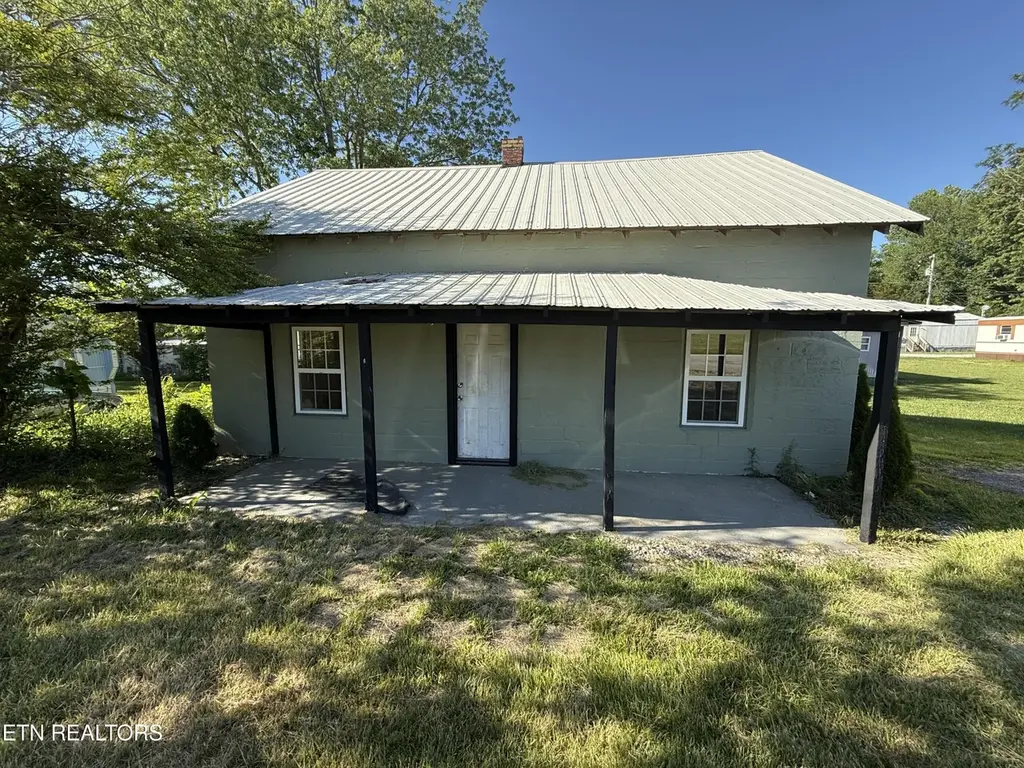
Handy with a hammer & saw, this one needs all your TLC. Great investment property or have a rental. You change the outcome of this home 1 bedroom 1 bath on level to rolling lot. Covered front porch & covered back porch. In the Jamestown city limits.
Key facts
- Covered front porch
- Rolling lot
- Investment property
Tags
Property features AI
Finance
- Other: Approx. 0.1 acre lot
Exterior
- Parking: No designated parking reported
- Utilities: Public water; Public sewer; Water available
- Home design: Single-family residence; Residential property; Three or more levels; Entry facing not specified
- Construction: Built (existing); Construction materials: Other
- Exterior features: Covered porch; Level lot
Interior
- Bedrooms: 1 bedroom
- Flooring: Laminate; Other
- Bathrooms: 1 full bathroom
- Heating & cooling: Heating present (type: Other); No central cooling
- Interior features: Laminate and other flooring; Crawl space basement
- Laundry & utility: Washer hookup; Electric dryer hookup
Neighborhood map
What this means for you Summary
Snapshot
- This is a 1-bed/1.0-bath single-family listed at $70k. Condition is rated poor.
Deal economics
- At list price, monthly cash flow is $623 ($7k/yr) — positive.
- The deal already cash-flows at list — no discount required.
- Meets the 1% rule at list price ($1k rent vs $70k).
- Recommended offer: $68k (3.0% below list) — sets the bar for market timing.
- Cap rate 17.0% vs local median 4.6% in Jamestown — top-decile yield for the area; either an underpriced asset or a hidden risk that comps aren't pricing in. Stress-test before assuming the spread holds.
Location & tenants
- Location reads 61/100 on livability (#250 in TN) — a middle-class / working-renter tenant base. Strengths: cost of living A+, health & safety A+; Watch: housing D, schools F, crime F.
- Fentress County (rural): math 24% / reading 27% proficiency, ranked #91 of 139 in TN (top 66%) — low school quality limits family demand, transient renter base, plan for 1-2y turnover; 65% free/reduced lunch — lower-income household profile, screen leases tightly.
- Market conditions: 325 active listings in the ZIP.
Forward outlook
- In year one you build about $7k of equity ($483 loan paydown + $7k appreciation (10.0% local appreciation)).
- Fentress County population projected at -19% by 2050 — secular population decline; favor cash flow + early exit over multi-decade hold.
- At projected returns (10.0% appreciation + 3.0% rent growth), your $20k cash investment doubles in ~2 years — after that, you're playing with house money.
- By year 5, paydown + projected appreciation supports a ~$35k cash-out refi (75% LTV) — recoverable capital for the next deal without selling this one.
Negotiation context
- It's been on market 36 days — a 3% lower offer ($68k) is reasonable based on typical stale-listing flexibility.
- 4 sale attempts with the ask held roughly flat each time — persistent listings suggest the price (not the market) is what's stuck; bring a comps-based counter.
- Current owner paid $40k; list at $70k implies a 75% gain — meaningful room to come down on a strong offer.
Risks & watch-outs
- Watch-outs: built in 1948 — expect roof / HVAC / electrical / plumbing capex.
Questions for the listing agent
- It's been on market 36 days. Have you received any prior offers? Is the seller open to a 3% concession, seller financing, or rate buy-down credit?
- Have any recent inspections been done? Can we get a copy of the seller's disclosures and any deferred-maintenance estimates?
- Built in 1948 — when were the roof, HVAC, electrical panel, plumbing, and water heater last replaced?
- Is there a deadline driving the sale (1031 exchange, divorce, estate, relocation)? That informs how much negotiation room exists.
- Schools are F-rated, which usually means shorter tenancies and higher turnover. Who's the typical renter profile here, and what's been the actual vacancy rate?
- Crime grade is F in this area — have there been break-ins, vandalism, or insurance claims at this property in the last 3 years? What carrier currently insures it and at what premium?
- What's the average days-on-market for RENTAL listings here right now (not sales)? A rising rental-DOM trend means longer vacancies and softer asking-rent achievability than the comps imply.
- What's the recent tenant-quality profile in this submarket — average credit score on applications, eviction rate, late-payment / NSF rate, and stable-employment percentage? A property-management company in the area should have these aggregated.
- How much new for-sale + rental construction is in the pipeline within 1–3 miles? Heavy new supply typically softens prices + rents 12–24 months out; constrained supply supports both.
Investment metrics
- 1% rule
- 1.87% ✓
- Cap rate
- 16.99%
- Cash-on-cash
- 38.21%
- DSCR
- 2.70
- GRM
- 4.5
CMA / ARV
- ARV (median comp)
- $120,742
- List price
- $69,900
- Delta
- -42.11%
- Verdict
- UNDERPRICED
- Comps
- 8 within 1.0 mi
Projected returns pro-forma
10.0% appreciation · 3.0% rent growth · sell at horizon
- IRR
- 53.7%
- Equity multiple
- 4.97×
- Total profit
- $77,731
- Equity at exit
- $62,971
- IRR
- 47.3%
- Equity multiple
- 11.10×
- Total profit
- $197,643
- Equity at exit
- $135,800
Cash invested: $19,572 (down + closing). Projections, not guarantees.
Landlord ↔ Tenant lean methodology
- Overall (STATE)
- 87 Strongly Landlord-Friendly
- State Tennessee
- 87 Strongly Landlord-Friendly · R+13
- County
- — inherits STATE
- City
- — inherits STATE
ZIP-level market 38556
- Home prices YoY
- 13.5%
- Active inventory
- 325
- Price-to-rent
- 4.5×
Monthly cashflow live
- Estimated rent
- $1,305 medium interval (Pro) →
- Mortgage (P&I)
- −$367
- Tax from tax record
- −$12 /mo · $148/yr
- Insurance
- −$29
- HOA
- −$0
- Vacancy / Maint / Mgmt
- −$274
- Net cashflow
- $623
Break-even live
UW: 25.0% down · 7.5% · 30yr · 1.5% tax · 5.0% vac · 8.0% maint · 8.0% mgmt
Financing live
Cash to close
- Down payment
- $17,475
- Closing costs
- $2,097
- Reserves months
- —
- Total cash needed
- —
Loan-product check · same deal, 3 products live
Conventional
25% down · 7.5% · 30yr
- Down + closing
- —
- Monthly P&I
- —
- Monthly cashflow
- —
- DSCR
- —
- Eligible?
- —
Personal DTI + credit; lowest rate.
DSCR
20% down · 8.5% · 30yr
- Down + closing
- —
- Monthly P&I
- —
- Monthly cashflow
- —
- DSCR
- —
- Eligible?
- —
No personal income docs; deal must DSCR.
Hard money
10% down · 12.0% · 12mo
- Down + closing
- —
- Monthly P&I
- —
- Monthly cashflow
- —
- DSCR
- —
- Eligible?
- —
Short-term bridge; refi at stabilization.
Listing history 20 events
-
2026-06-18days on market $69,900 Active 36 DOM
-
2026-06-17days on market $69,900 Active 35 DOM
-
2026-06-16days on market $69,900 Active 34 DOM
-
2026-06-15days on market $69,900 Active 33 DOM
-
2026-06-13days on market $69,900 Active 31 DOM
-
2026-06-12days on market $69,900 Active 30 DOM
-
2026-06-09days on market $69,900 Active 27 DOM
-
2026-06-08days on market $69,900 Active 26 DOM
-
2026-06-08days on market $69,900 Active 25 DOM
-
2026-06-07days on market $69,900 Active 24 DOM
-
2026-06-03days on market $69,900 Active 21 DOM
-
2026-06-02days on market $69,900 Active 20 DOM
-
2026-06-01days on market $69,900 Active 19 DOM
-
2026-05-31days on market $69,900 Active 18 DOM
-
2026-05-13$69,900 Active 261-char remark
Show marketing remark (259 chars)
Handy with a hammer & saw, this one needs all your TLC. Great investment property or have a rental. You change the outcome of this home 1 bedroom 1 bath on level to rolling lot. Covered front porch & covered back porch. In the Jamestown city limits.
-
2026-05-13$69,900 Active 257-char remark
Show marketing remark (259 chars)
Handy with a hammer & saw, this one needs all your TLC. Great investment property or have a rental. You change the outcome of this home 1 bedroom 1 bath on level to rolling lot. Covered front porch & covered back porch. In the Jamestown city limits.
-
2026-05-13$69,900 Active
Show marketing remark (259 chars)
Handy with a hammer & saw, this one needs all your TLC. Great investment property or have a rental. You change the outcome of this home 1 bedroom 1 bath on level to rolling lot. Covered front porch & covered back porch. In the Jamestown city limits.
-
2025-11-07soldstatus $40,000 Closed
-
2025-09-26historical Pending - Continue to Show
-
2025-09-22$49,000 Active
ⓘ Source: listings_history table (triggers on properties + properties_extension) + one-shot
backfill from property_details.listing_events for pre-trigger history.
Tax reassessment forecast TN · Resets to sale price
- Current annual tax
- $148 · $12/mo
- Projected year-2 tax
- $496 · $41/mo
- Expected delta
- +$348/yr (+$29/mo · 235.0%)
ⓘ Screening estimate from a state-policy table — verify with the county assessor before closing.
Nearby sold comps map
Loading sold comps map…
Walkable amenities ~0.75 mi
Loading nearby amenities…
Taxation est. · year 1
- Rental income
- $15,663
- − Mortgage interest
- −$3,915
- − Property taxes
- −$148
- − Insurance
- −$350
- − Repairs & maintenance
- −$1,253
- − Management
- −$1,253
- − Depreciation
- −$2,033
- Taxable income
- $6,711
- Est. tax owed @ 24.0%
- −$1,611
- After-tax cash flow
- $5,867/yr
For passive investors: Depreciation is non-cash, so a rental often shows a tax loss while cash-flowing — sheltering income. Rental losses are passive: they offset passive income freely, and up to $25,000/yr can offset ordinary (W-2) income if you actively participate and your MAGI is under $100k (phasing out to $0 by $150k); unused losses carry forward. On sale, claimed depreciation is recaptured at up to 25%, and gains may owe capital-gains tax (a 1031 exchange can defer both). Figures are a year-1 estimate at your 24.0% rate — not tax advice; consult a CPA.
Condition & rehab AI · 10 photos
This property requires extensive repairs and rebuilding to restore its structural integrity and enhance its value for resale or rental.
Repairs flagged
- Major Exterior siding — Significant damage
- Major Porch structure — Structural compromise
- Major Flooring — Exposed subfloor
- Major Interior walls — Paint peeling, walls damaged
- Major Windows — Missing or damaged
- Major Foundation — Exposed and compromised
- Major HVAC system — No visible system
Value-add opportunities
- Both Rebuild exterior siding — Enhances curb appeal and structural integrity
- Both Replace porch structure — Restores structural integrity and enhances curb appeal
- Both Rebuild flooring — Restores structural integrity and enhances living space
- Both Paint interior walls — Enhances appearance and value
- Both Replace windows — Enhances energy efficiency and appearance
- Both Rebuild foundation — Restores structural integrity and enhances living space
- Both Install HVAC system — Enhances comfort and energy efficiency
Renovation cost estimate screening
| Repair item | Severity | Est. cost |
|---|---|---|
| Exterior siding · Significant damage | Major | $15,000–50,000 |
| Porch structure · Structural compromise | Major | $15,000–50,000 |
| Flooring · Exposed subfloor | Major | $15,000–50,000 |
| Interior walls · Paint peeling, walls damaged | Major | $15,000–50,000 |
| Windows · Missing or damaged | Major | $15,000–50,000 |
| Foundation · Exposed and compromised | Major | $15,000–50,000 |
| HVAC system · No visible system | Major | $15,000–50,000 |
| Total estimated repair cost · 7 items | $105,000–350,000 |
Value-add ROI direction
- Both Rebuild exterior siding — Enhances curb appeal and structural integrity ↑
- Both Replace porch structure — Restores structural integrity and enhances curb appeal ↑
- Both Rebuild flooring — Restores structural integrity and enhances living space ↑
- Both Paint interior walls — Enhances appearance and value ↑
- Both Replace windows — Enhances energy efficiency and appearance ↑
- Both Rebuild foundation — Restores structural integrity and enhances living space ↑
- Both Install HVAC system — Enhances comfort and energy efficiency ↑
ⓘ Cost ranges are severity-bucket heuristics (US national rule-of-thumb). Get contractor quotes + a written scope before underwriting a rehab budget.
Schools (NCES district)
- District
- Fentress County
- NCES district ID
- 4701230
- Math proficiency
- 24% ▼ -13.00%
- Reading proficiency
- 27% ▼ -8.00%
- Median HH income
- $30,419
- Composite
- 20.6/100
- National rank
- #8552
- State rank
- #91 of 139 in TN
Livability — Jamestown
- Score
- 61/100
- State rank
- #250
- US rank
- #17976
Category grades
Schools grade is shown separately in the Schools card above.
Census & demographics
- Census place
- Jamestown, TN
- Population (ZIP)
- 12,531
Population outlook (Fentress County) Hauer SSP2
- Today (2025)
- 17,295 people
- By 2030
- 16,749 · -3.2%
- By 2040
- 15,443 · -10.7%
- By 2050
- 14,077 · -18.6%
- By 2075
- 11,482 · -33.6%
- By 2100
- 9,658 · -44.2%
Race, ethnicity, and origin ACS 2023
- Neighborhood character
- Predominantly White (96%)
- Race & ethnicity
- White 96% Two or more races 3% Hispanic / Latino 1%
- Common ancestry
- Serbian 3% Lithuanian 2% Iranian 1%
- Foreign-born
- 1% · Canada
- Languages at home
- 99% English-only · Spanish 1%
Political lean MEDSL · Fentress
- 2024 margin
- Solid R (+75.8) · D 11.8% · R 87.6%
- 2008→2024 swing
- -31.9pp toward R · 2008: -43.9pp · 2024: -75.8pp
- All cycles
- 2024: R+75.8 2020: R+71.3 2016: R+67.5 2012: R+53.4 2008: R+43.9
Not yet ingested
- Civics
- —
Market trends
- HPI YoY
- ▲ 44.31%
- Current HPI
- 372.5676
- Rent YoY
- —
- Metro
- —
- State GDP YoY
- ▲ 2.78%
- F500 in state
- 22
Industry mix (Fortune 500 HQ in TN)
| Industry | F500 HQs | Revenue |
|---|---|---|
| Healthcare | 3 | $91B |
|
||
| Retail | 3 | $72B |
|
||
| Transportation / Logistics | 1 | $88B |
|
||
| Paper / Packaging | 1 | $19B |
|
||
| Insurance | 1 | $13B |
|
||
| Energy | 1 | $12B |
|
||
Price history
+42.7% since first listed6 events — show timeline
- 2026-05-13 Listed $69,900 UCMLS
- 2026-05-13 Listed $69,900 REALTRACS as Distributed by MLS Grid
- 2026-05-13 Listed $69,900 Knoxville MLS
- 2025-11-07 Sold (MLS) $40,000 Knoxville MLS
- 2025-09-26 Contingent — Knoxville MLS
- 2025-09-22 Listed $49,000 Knoxville MLS
Property tax history
+37.2%/yrLatest (2025): $148 · +37.2% YoY. Source: county tax records.
Cash-flow waterfall
monthlySold comps — $/sqft
last 12 mo · ≤1 miLoading sold comps…