 Triplex
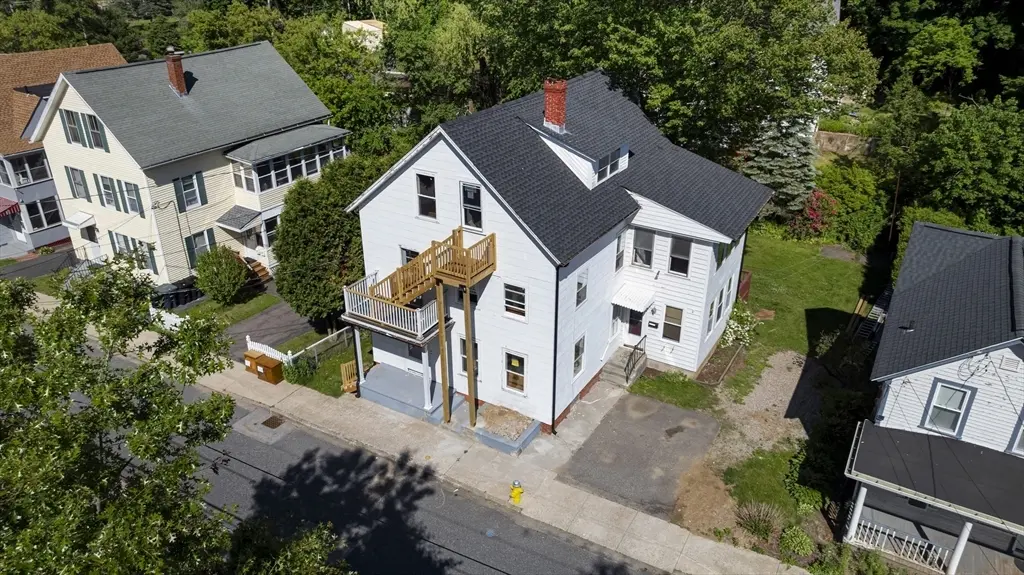
47 Morris St · Southbridge Town, MA
Flood risk 8/10 · Major
- FEMA flood zone
- X (unshaded)
- Chance of flooding over 30 yrs
- 0.99%
- Est. flood insurance / yr
- $473 – $860
Fire risk 3/10 · Minor
- Est. fire insurance / yr
- $915 – $1,699
Heat risk 4/10 · Minor
- Hot days now (above 94°F)
- 7 days/yr
- Hot days in 30 yrs
- 17 days/yr
Wind risk 6/10 · Moderate
- Chance of severe wind over 30 yrs
- 27.0%
Air-quality risk 2/10 · Minimal
- Unhealthy air days now
- 2 days/yr
- Unhealthy air days in 30 yrs
- 2 days/yr
Risk factors via First Street. Map © Google.
Why this score? — see what drove the D- grade
The composite is a weighted blend of 9 inputs, each scored 0–100. Each bar is that input's sub-score; the figure is the points it added to the 100-point composite (weight × sub-score).
- Cash flow +19.0/30.0
- DSCR +6.0/10.0
- 1% rule +4.1/10.0
- Livability +2.8/5.0
- Rent growth +2.5/5.0
- Condition / age +2.5/5.0
- Schools +1.0/10.0
- ARV discount +0.0/15.0
- Appreciation +0.0/10.0
$549,900
🖨 Deal sheet (PDF) 📄 Offer letter ✓ Due diligence
Multi-family units
County records classify this as Multi-Family (2-4 Unit). Listing-text estimate: 3 units. confirmed
Listing remarks MLS
ATTENTION INVESTORS/LANDLORDS - OPPORTUNITY KNOCKS! Desirable location - delivered empty! First time ever on the market! Public Record lists this home as a 3 family. The 3rd floor is set up as an apartment or could be an extension of the 2nd floor if desired. Property does need some work (roof & electrical) - WILL NOT qualify for all types of financing.
Key facts
- New panels
- New meters
- New roof
Tags
Property features AI
Finance
- Other: Approximately 2,074 above-grade finished square feet; Lot about 0.14 acres; Built year per public records (actual)
- HOA & community: Not a senior community
Exterior
- Parking: Off-street parking; 4 open parking spaces (total 4 spaces)
- Utilities: Public water; Public sewer; 100 amp electric service; Gas available for range and oven
- Home design: 3-family, up/down configuration; 3 stories
- Construction: Frame construction; Block and brick/mortar foundation; Shingle roof; White exterior
- Exterior features: Deck (wood); Balcony; Rain gutters; Level lot; Public road frontage
Interior
- Flooring: Wood flooring; Vinyl flooring
- Bathrooms: 3 full bathrooms
- Interior features: Insulated doors; Insulated windows; 12 total rooms
Neighborhood map
What this means for you Summary
Snapshot
- This is a 3 × 2-bed/1.0-bath units multifamily listed at $550k.
Deal economics
- At list price, monthly cash flow is $523 ($6k/yr) — positive. Per door: $174/mo.
- The deal already cash-flows at list — no discount required.
- To meet the 1% rule (rent ≥ 1% of price), the offer needs to be $502k (8.7% below list).
- Recommended offer: $502k (8.7% below list) — sets the bar for 1% rule.
- Cap rate 7.6% vs local median 3.7% in Southbridge Town — top-decile yield for the area; either an underpriced asset or a hidden risk that comps aren't pricing in. Stress-test before assuming the spread holds.
Location & tenants
- Location reads 56/100 on livability (#235 in MA) — a working-class tenant base; expect higher turnover. Strengths: housing A+; Watch: cost of living C-, employment D, amenities F.
- Southbridge (suburban): math 5% / reading 17% proficiency, ranked #301 of 302 in MA (top 100%) — low school quality limits family demand, transient renter base, plan for 1-2y turnover; 63% free/reduced lunch — lower-income household profile, screen leases tightly.
- Zoned schools: Southbridge Middle School (math 4% / reading 11%, grade F, #298 of 305 statewide, top 98%, 405 students, 0% FRL) — zoned schools average 0% FRL vs 63% district-wide (63 pts lower); this property's tenant base skews higher-income than the district average.
- Market conditions: 41 active listings in the ZIP; 2,293 units permitted in Worcester County in 2024 (1,205 in 5+ unit buildings).
- At $5,023/mo this rent would consume 91% of the median local household income ($66k/yr) (locally 1217% of renters already pay >50% of income on rent) — very limited rent-growth headroom before tenants either downsize or default.
Forward outlook
- Local home prices are declining (-3.0%/yr); year-one equity from $4k of loan paydown is wiped out by about $16k of value loss. Plan a longer hold.
Negotiation context
- It's been on market 16 days — a 2% lower offer ($542k) is reasonable based on typical stale-listing flexibility.
- 2 sale attempts with the ask held roughly flat each time — persistent listings suggest the price (not the market) is what's stuck; bring a comps-based counter.
- Current owner paid $325k; list at $550k implies a 69% gain — meaningful room to come down on a strong offer.
Risks & watch-outs
- Watch-outs: flood insurance adds $56/mo; built in 1890 — expect roof / HVAC / electrical / plumbing capex.
- Climate carrying-cost: severe flood risk; major wind risk, 27% chance of damaging wind over 30y — expect insurance premiums to compound above CPI over the hold.
Questions for the listing agent
- Can we see the unit-by-unit rent roll, current vacancy, and any below-market leases? What's the average tenancy length?
- What capital expenditures (roof, boiler, parking lot, exteriors) have been made in the last 5 years, and what's planned in the next 2?
- Built in 1890 — when were the roof, HVAC, electrical panel, plumbing, and water heater last replaced?
- What's the actual annual flood-insurance premium (NFIP or private), and is the property in a SFHA with mandatory coverage?
- Is there a deadline driving the sale (1031 exchange, divorce, estate, relocation)? That informs how much negotiation room exists.
- Schools are F-rated, which usually means shorter tenancies and higher turnover. Who's the typical renter profile here, and what's been the actual vacancy rate?
- The area grade is low — what's the realistic commute time and amenity access for the typical tenant pool here? Any planned neighborhood developments (good or bad) we should know about?
- What's the average days-on-market for RENTAL listings here right now (not sales)? A rising rental-DOM trend means longer vacancies and softer asking-rent achievability than the comps imply.
- What's the recent tenant-quality profile in this submarket — average credit score on applications, eviction rate, late-payment / NSF rate, and stable-employment percentage? A property-management company in the area should have these aggregated.
- How much new apartment / multifamily construction is in the pipeline within 1–3 miles? Heavy new supply (>2% of stock underway) typically softens rents 12–24 months out; light construction supports rent growth.
Investment metrics
- 1% rule
- 0.91% ✗
- Cap rate
- 7.56%
- Cash-on-cash
- 4.51%
- DSCR
- 1.20
- GRM
- 9.1
CMA / ARV
- ARV (on-the-fly)
- $385,764
- Comps found
- 12
Show comp detail 12 sales within ~0.75 mi
| Address | Dist | Beds/Ba | Sqft | Sold | Price | $/sf | Match |
|---|---|---|---|---|---|---|---|
| 51 Warren St | 0.22mi | 5/2.0 (-1) | 2,028 (-2%) | 5mo | $387,000 | $191 | 73 |
| 105 North St | 0.36mi | 6/2.0 | 2,099 (+1%) | 7mo | $447,000 | $213 | 72 |
| 32 Roger St | 0.23mi | 6/2.0 | 1,976 (-5%) | 9mo | $435,000 | $220 | 70 |
| 56 Main St | 0.19mi | 6/2.0 | 1,894 (-9%) | 16mo | $470,000 | $248 | 59 |
| 37 Crystal St | 0.21mi | 6/2.0 | 2,240 (+8%) | 18mo | $372,000 | $166 | 58 |
| 99 North St | 0.37mi | 6/2.0 | 1,826 (-12%) | 6mo | $315,000 | $173 | 54 |
| 20 Golf St | 0.53mi | 6/2.0 | 2,304 (+11%) | 1mo | $421,500 | $183 | 52 |
| 64-66 Worcester St | 0.61mi | 6/2.0 | 1,960 (-6%) | 13mo | $360,000 | $184 | 48 |
| 60 Taft St | 0.74mi | 5/2.0 (-1) | 2,039 (-2%) | 13mo | $415,000 | $204 | 43 |
| 236 Charlton St | 0.72mi | 6/2.0 | 2,296 (+11%) | 8mo | $412,000 | $179 | 38 |
| 65 Green Ave | 0.68mi | 6/2.0 | 2,352 (+13%) | 6mo | $420,000 | $179 | 37 |
| 89 Worcester St | 0.66mi | 5/2.0 (-1) | 2,364 (+14%) | 3mo | $440,000 | $186 | 34 |
Match score weights: distance 35% · size 25% · config 20% · recency 20%. Top-matched comps best support the ARV.
Projected returns pro-forma
-3.0% appreciation · 3.0% rent growth · sell at horizon
- IRR
- -10.0%
- Equity multiple
- 0.64×
- Total profit
- $-55,944
- Equity at exit
- $81,992
- IRR
- -0.6%
- Equity multiple
- 0.96×
- Total profit
- $-6,406
- Equity at exit
- $47,545
Cash invested: $153,972 (down + closing). Projections, not guarantees.
Landlord ↔ Tenant lean methodology
- Overall (STATE)
- 20 Strongly Tenant-Friendly
- State Massachusetts
- 20 Strongly Tenant-Friendly · D+15
- County
- — inherits STATE
- City
- — inherits STATE
ZIP-level market 01550
- Home prices YoY
- -7.8%
- Active inventory
- 41
- Price-to-rent
- 27.4×
Monthly cashflow live
- Estimated rent
- $5,023 medium interval (Pro) →
- Mortgage (P&I)
- −$2,884
- Tax from tax record
- −$277 /mo · $3,322/yr
- Insurance
- −$229
- Flood insurance flood zone
- −$56 /mo · $666/yr
- HOA
- −$0
- Vacancy / Maint / Mgmt
- −$1,055
- Net cashflow
- $523
Break-even live
Sensitivity live
| Price | -10% $834 | -5% $679 | +0% $523 | +5% $367 | +10% $212 |
|---|---|---|---|---|---|
| Rent | -10% $126 | -5% $325 | +0% $523 | +5% $721 | +10% $920 |
| Rate | -1.0pp $800 | -0.5pp $663 | base $523 | +0.5pp $380 | +1.0pp $235 |
3-unit breakdown (identical units grouped — click to expand)
| Units | Beds | Baths | Est. rent |
|---|---|---|---|
| 3× units | 2 | 1 | $5,022 |
| #1 | 2 | 1 | $1,674 |
| #2 | 2 | 1 | $1,674 |
| #3 | 2 | 1 | $1,674 |
| Total (3 units) | $5,023 | ||
UW: 25.0% down · 7.5% · 30yr · 1.5% tax · 5.0% vac · 8.0% maint · 8.0% mgmt
Financing live
Cash to close
- Down payment
- $137,475
- Closing costs
- $16,497
- Reserves months
- —
- Total cash needed
- —
Loan-product check · same deal, 3 products live
Conventional
25% down · 7.5% · 30yr
- Down + closing
- —
- Monthly P&I
- —
- Monthly cashflow
- —
- DSCR
- —
- Eligible?
- —
Personal DTI + credit; lowest rate.
DSCR
20% down · 8.5% · 30yr
- Down + closing
- —
- Monthly P&I
- —
- Monthly cashflow
- —
- DSCR
- —
- Eligible?
- —
No personal income docs; deal must DSCR.
Hard money
10% down · 12.0% · 12mo
- Down + closing
- —
- Monthly P&I
- —
- Monthly cashflow
- —
- DSCR
- —
- Eligible?
- —
Short-term bridge; refi at stabilization.
Listing history 11 events
-
2026-06-21days on market $549,900 Active 16 DOM
-
2026-06-18days on market $549,900 Active 13 DOM
-
2026-06-17days on market $549,900 Active 12 DOM
-
2026-06-16days on market $549,900 Active 11 DOM
-
2026-06-15days on market $549,900 Active 10 DOM
-
2026-06-14days on market $549,900 Active 8 DOM
-
2026-06-10days on market $549,900 Active 5 DOM
-
2026-06-09statusdays on market $549,900 Active 4 DOM
-
2026-06-08days on market $549,900 New 3 DOM
-
2026-06-07remarks 699-char remark
-
2026-06-07$549,900 New 2 DOM
ⓘ Source: listings_history table (triggers on properties + properties_extension) + one-shot
backfill from property_details.listing_events for pre-trigger history.
Tax reassessment forecast MA · Partial reset (capped growth)
- Current annual tax
- $3,322 · $277/mo
- Projected year-2 tax
- $5,043 · $420/mo
- Expected delta
- +$1,721/yr (+$143/mo · 51.8%)
ⓘ Screening estimate from a state-policy table — verify with the county assessor before closing.
Climate risk First Street
- Flood 8/10 Severe FEMA zone X (unshaded) · 99% chance over 30 yrs
- Wildfire 3/10 Moderate
- Heat 4/10 Moderate 7 d/yr ≥94°F today · 17 d/yr by 30 yrs out
- Wind 6/10 Major 27% chance of damaging wind over 30 yrs
- Air quality 2/10 Low 2 unhealthy d/yr today · 2 by 30 yrs out
Nearby sold comps map
Loading sold comps map…
Walkable amenities ~0.75 mi
Loading nearby amenities…
Taxation est. · year 1
- Rental income
- $60,276
- − Mortgage interest
- −$30,803
- − Property taxes
- −$3,322
- − Insurance
- −$3,416
- − Repairs & maintenance
- −$4,822
- − Management
- −$4,822
- − Depreciation
- −$15,997
- Taxable loss
- −$2,906
- Est. tax savings @ 24.0%
- +$697
- After-tax cash flow
- $6,973/yr
For passive investors: Depreciation is non-cash, so a rental often shows a tax loss while cash-flowing — sheltering income. Rental losses are passive: they offset passive income freely, and up to $25,000/yr can offset ordinary (W-2) income if you actively participate and your MAGI is under $100k (phasing out to $0 by $150k); unused losses carry forward. On sale, claimed depreciation is recaptured at up to 25%, and gains may owe capital-gains tax (a 1031 exchange can defer both). Figures are a year-1 estimate at your 24.0% rate — not tax advice; consult a CPA.
Schools (NCES district)
- District
- Southbridge
- NCES district ID
- 2511010
- Math proficiency
- 5% ▼ -5.00%
- Reading proficiency
- 17% ▼ -1.00%
- Median HH income
- $45,438
- Composite
- 9.97/100
- National rank
- #9814
- State rank
- #301 of 302 in MA
Livability — Southbridge Town
- Score
- 56/100
- State rank
- #235
- US rank
- #22429
Category grades
Schools grade is shown separately in the Schools card above.
Census & demographics
- Census place
- Southbridge Town, MA
- County
- Worcester County · 487,911 people
- City population
- 17,806
- Metro
- Worcester, MA-CT
- Population (ZIP)
- 17,928
- Household income
- $66,287
- Rent vs Own
- Severe rent burden
- 1217.0
Population outlook (Worcester County) Hauer SSP2
- Today (2025)
- 850,858 people
- By 2030
- 860,403 · +1.1%
- By 2040
- 869,902 · +2.2%
- By 2050
- 869,110 · +2.1%
- By 2075
- 870,120 · +2.3%
- By 2100
- 829,703 · -2.5%
Race, ethnicity, and origin ACS 2023
- Neighborhood character
- Majority White (54%)
- Race & ethnicity
- White 54% Hispanic / Latino 40% Two or more races 21% Black 3%
- Hispanic origin (detail)
- Puerto Rican 35% Dominican 2%
- Common ancestry
- Lithuanian 13% Romanian 4% German 1%
- Foreign-born
- 4% · Canada
- Languages at home
- 65% English-only · Spanish 31% French/Haitian/Cajun 1% Other Indo-European 1%
Political lean MEDSL · Worcester
- 2024 margin
- D (+10.0) · D 53.9% · R 43.9% · Other 2.2%
- 2008→2024 swing
- -3.8pp toward R · 2008: 13.8pp · 2024: 10.0pp
- All cycles
- 2024: D+10.0 2020: D+17.8 2016: D+10.5 2012: D+9.2 2008: D+13.8
Not yet ingested
- Civics
- —
Market trends
- HPI YoY
- ▼ -23.80%
- Current HPI
- 280.5379
- Rent YoY
- —
- Metro
- Worcester, MA-CT
- State GDP YoY
- ▲ 2.28%
- F500 in state
- 38
Industry mix (Fortune 500 HQ in MA)
| Industry | F500 HQs | Revenue |
|---|---|---|
| Technology | 3 | $17B |
|
||
| Insurance | 2 | $84B |
|
||
| Retail | 2 | $76B |
|
||
| Life Sciences | 1 | $43B |
|
||
| Energy Technology | 1 | $31B |
|
||
| Aerospace / Defense | 1 | $18B |
|
||
Price history
+37.5% since first listed5 events — show timeline
- 2026-06-05 Listed $549,900 MLS PIN
- 2025-11-18 Sold (MLS) $325,000 MLS PIN
- 2025-03-26 Pending — MLS PIN
- 2025-03-19 Contingent — MLS PIN
- 2025-03-11 Listed $399,900 MLS PIN
Property tax history
+3.4%/yrLatest (2023): $3,322 · +5.6% YoY. Source: county tax records.
Cash-flow waterfall
monthlySold comps — $/sqft
last 12 mo · ≤1 miLoading sold comps…