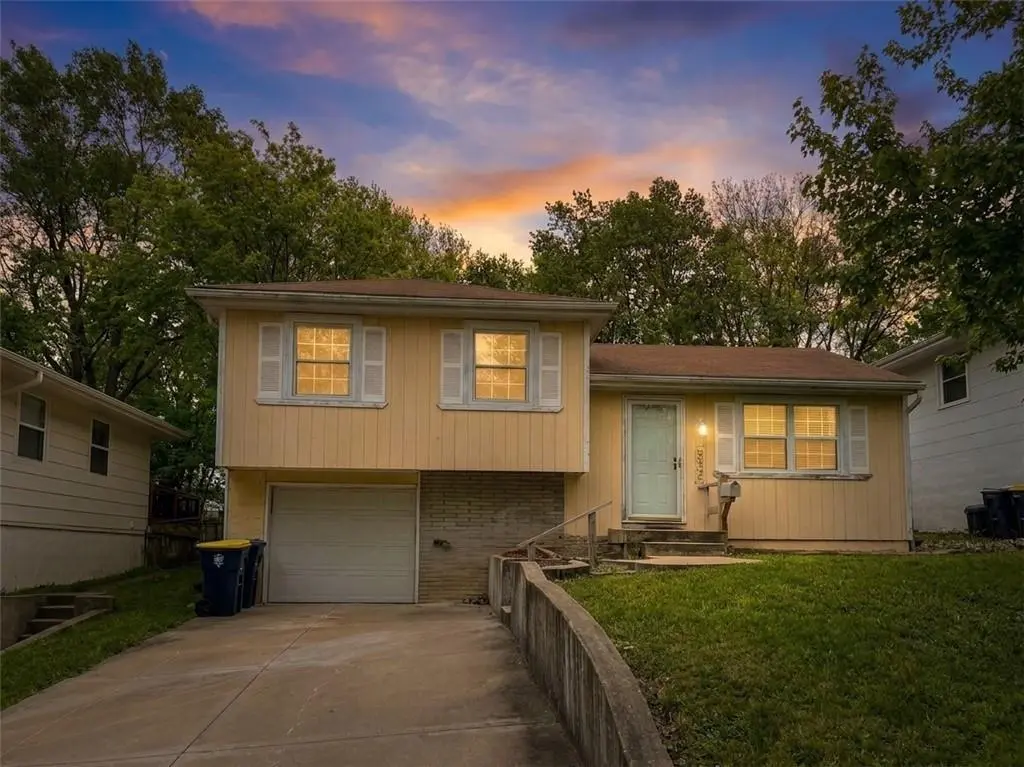
4831 N Manchester Ave · Kansas City, MO
Flood risk 1/10 · Minimal
- FEMA flood zone
- X (unshaded)
- Chance of flooding over 30 yrs
- 0.0%
- Est. flood insurance / yr
- $473 – $860
Fire risk 2/10 · Minimal
- Est. fire insurance / yr
- $1,054 – $1,958
Heat risk 4/10 · Minor
- Hot days now (above 107°F)
- 7 days/yr
- Hot days in 30 yrs
- 17 days/yr
Wind risk 2/10 · Minimal
- Chance of severe wind over 30 yrs
- —
Air-quality risk 3/10 · Minor
- Unhealthy air days now
- 2 days/yr
- Unhealthy air days in 30 yrs
- 3 days/yr
Risk factors via First Street. Map © Google.
Why this score? — see what drove the C grade
The composite is a weighted blend of 9 inputs, each scored 0–100. Each bar is that input's sub-score; the figure is the points it added to the 100-point composite (weight × sub-score).
- Cash flow +20.1/30.0
- ARV discount +12.6/15.0
- DSCR +6.4/10.0
- 1% rule +4.7/10.0
- Rent growth +4.0/5.0
- Livability +3.9/5.0
- Schools +3.8/10.0
- Condition / age +2.5/5.0
- Appreciation +0.0/10.0
$180,000
🖨 Deal sheet 📄 Offer letter ✓ Due diligence
Listing remarks MLS
So many updates! 1st-time buyers can qualify for the $8K tax credit if close B4 11-30-09! Hardwoods throughout main level and bedrooms. Ceramic Tile in Kitchen! BRAND NEW STAINLESS appliances, including Refrigerator! New Concrete driveway and adorable curb appeal! Outbuilding for extra storage & large back yard! No homes directly behind yard. Nothing to do but move in and add your special decorating touches. Large yard - doesn't directly back up to homes. Has an outbuilding/shed for additional storage and garage is oversized so the motorcycle or ATV, or workshop can fit inside with the car! Home Qualifies for KC DREAM while it lasts!
Key facts
- Spruced-up kitchen
- Updated full bath
- New hvac
Tags
Property features AI
Finance
- Other: Seller provides home warranty (HMS)
- HOA & community: No association fees
Exterior
- Parking: Attached garage with garage door opener (1 garage space)
- Utilities: Public water; Public sewer; Cable available and high-speed internet available
- Home design: Single family residence; Residential property; Side/side split, tri-level; Property not in a flood plain
- Construction: Brick trim and frame construction; Composition roof; Has basement with concrete and crawl space
- Exterior features: Deck; Metal fencing; Outbuilding
Interior
- Kitchen: Dishwasher; Disposal; Microwave; Refrigerator; Built-in oven; Electric range; Ceramic tile in kitchen
- Bedrooms: 3 bedrooms (all on second level)
- Flooring: Wood flooring; Ceramic tile in dining room and kitchen
- Bathrooms: 1 full bathroom with shower over tub (vinyl in bath)
- Heating & cooling: Forced air heat; Attic fan and electric cooling
- Interior features: Thermal windows; Formal living room; Side/side split, tri-level floor plan
- Laundry & utility: Laundry on lower level
Neighborhood map
What this means for you Summary
Snapshot
- This is a 3-bed/1.0-bath single-family listed at $180k.
Deal economics
- At list price, monthly cash flow is $225 ($3k/yr) — positive.
- The deal already cash-flows at list — no discount required.
- To meet the 1% rule (rent ≥ 1% of price), the offer needs to be $174k (3.1% below list).
- Recommended offer: $174k (3.1% below list) — sets the bar for 1% rule.
- Cap rate 7.8% vs local median 3.9% in Kansas City — top-decile yield for the area; either an underpriced asset or a hidden risk that comps aren't pricing in. Stress-test before assuming the spread holds.
Location & tenants
- Location reads 78/100 on livability (#28 in MO, #2,671 nationally) — a middle-class / working-renter tenant base. Strengths: amenities A+, commute A+, cost of living A+; Watch: crime F.
- North Kansas City 74 (urban): math 38% / reading 49% proficiency, ranked #98 of 324 in MO (top 30%) — families likely to look elsewhere, expect single-tenant / working-renter base with shorter leases.
- Zoned schools: Gracemor Elementary (math 23% / reading 35%, grade F, #842 of 1,115 statewide, top 76%, 630 students, 68% FRL); Winnetonka High (math 16% / reading 51%, grade F, #349 of 521 statewide, top 67%, 1,284 students, 60% FRL) — zoned schools average 64% FRL vs 37% district-wide (27 pts higher); higher-poverty schools than district average — tighter screening recommended.
- Zoned-school proficiency averages 31% at this address vs 44% district-wide (-12 pts) — the specific schools serving this property underperform the North Kansas City 74 average; the district grade overstates school quality for this exact location.
- Market conditions: Rents rising fast (+6.1%/yr); 183 active listings in the ZIP; 4 comparable units currently listed for rent nearby; rentals at typical pace (median 24d on market — plan ~3-4 weeks tenant-placement turnaround); solid renter incomes; 341 units permitted in Clay County in 2024 (40 in 5+ unit buildings).
Forward outlook
- Local home prices are declining (-3.0%/yr); year-one equity from $1k of loan paydown is wiped out by about $5k of value loss. Plan a longer hold.
- Clay County population projected at +24% by 2050 — long-run rental-demand tailwind backs the buy-and-hold thesis.
Negotiation context
- Only 8 days on market — expect competitive offers; lowballing is unlikely to land.
- 2 sale attempts since 17y ago with the ask held roughly flat each time — persistent listings suggest the price (not the market) is what's stuck; bring a comps-based counter.
Questions for the listing agent
- Built in 1963 — when were the roof, HVAC, electrical panel, plumbing, and water heater last replaced?
- Is there a deadline driving the sale (1031 exchange, divorce, estate, relocation)? That informs how much negotiation room exists.
- Crime grade is F in this area — have there been break-ins, vandalism, or insurance claims at this property in the last 3 years? What carrier currently insures it and at what premium?
- What's the average days-on-market for RENTAL listings here right now (not sales)? A rising rental-DOM trend means longer vacancies and softer asking-rent achievability than the comps imply.
- What's the recent tenant-quality profile in this submarket — average credit score on applications, eviction rate, late-payment / NSF rate, and stable-employment percentage? A property-management company in the area should have these aggregated.
- How much new for-sale + rental construction is in the pipeline within 1–3 miles? Heavy new supply typically softens prices + rents 12–24 months out; constrained supply supports both.
Investment metrics
- 1% rule
- 0.97% ✗
- Cap rate
- 7.80%
- Cash-on-cash
- 5.37%
- DSCR
- 1.24
- GRM
- 8.6
CMA / ARV
- ARV (median comp)
- $202,977
- List price
- $180,000
- Delta
- -11.32%
- Verdict
- UNDERPRICED
- Comps
- 20 within 1.0 mi
Show comp detail 12 sales within ~0.75 mi
| Address | Dist | Beds/Ba | Sqft | Sold | Price | $/sf | Match |
|---|---|---|---|---|---|---|---|
| 4831 N Manchester Ave | 0.00mi | 3/1.0 | 874 (0%) | 1mo | $180,000 | $206 | 99 |
| 7928 NE San Rafael Dr | 0.13mi | 3/1.0 | 872 (-0%) | 6mo | $190,000 | $218 | 89 |
| 4820 N Manchester Ave | 0.03mi | 3/1.0 | 932 (+7%) | 3mo | $199,000 | $214 | 85 |
| 8032 NE San Rafael Dr | 0.25mi | 3/1.0 | 874 (0%) | 5mo | $210,000 | $240 | 84 |
| 8017 NE 50th St | 0.26mi | 3/1.0 | 874 (0%) | 12mo | $165,000 | $189 | 78 |
| 5128 N Richmond Ave | 0.33mi | 3/1.0 | 833 (-5%) | 3mo | $199,000 | $239 | 74 |
| 7112 NE 46th St | 0.51mi | 3/1.0 | 874 (0%) | 9mo | $185,000 | $212 | 69 |
| 5174 N Corrington Ave | 0.49mi | 3/1.0 | 840 (-4%) | 8mo | $165,000 | $196 | 64 |
| 7821 NE 51st St | 0.24mi | 2/1.5 (-1) | 748 (-14%) | 2mo | $145,000 | $194 | 57 |
| 7208 NE 46th St | 0.47mi | 3/1.5 | 936 (+7%) | 12mo | $185,000 | $198 | 54 |
| 5142 N Corrington Ave | 0.54mi | 3/1.0 | 816 (-7%) | 13mo | $190,000 | $233 | 53 |
| 5115 N Winchester Ave | 0.60mi | 3/1.0 | 956 (+9%) | 13mo | $200,000 | $209 | 45 |
Match score weights: distance 35% · size 25% · config 20% · recency 20%. Top-matched comps best support the ARV.
Projected returns pro-forma
-3.0% appreciation · 6.09% rent growth · sell at horizon
- IRR
- -4.8%
- Equity multiple
- 0.82×
- Total profit
- $-9,255
- Equity at exit
- $26,839
- IRR
- 8.0%
- Equity multiple
- 1.69×
- Total profit
- $34,747
- Equity at exit
- $15,563
Cash invested: $50,400 (down + closing). Projections, not guarantees.
Landlord ↔ Tenant lean methodology
- Overall (STATE)
- 81 Strongly Landlord-Friendly
- State Missouri
- 81 Strongly Landlord-Friendly · R+10
- County
- — inherits STATE
- City
- — inherits STATE
ZIP-level market 64119
- Rents YoY
- 6.1%
- Active inventory
- 183
- Price-to-rent
- 8.6×
Monthly cashflow live
- Estimated rent
- $1,744 medium interval (Pro) →
- Mortgage (P&I)
- −$944
- Tax from tax record
- −$134 /mo · $1,605/yr
- Insurance
- −$75
- HOA
- −$0
- Vacancy / Maint / Mgmt
- −$366
- Net cashflow
- $225
Break-even live
UW: 25.0% down · 7.5% · 30yr · 1.5% tax · 5.0% vac · 8.0% maint · 8.0% mgmt
Financing live
Cash to close
- Down payment
- $45,000
- Closing costs
- $5,400
- Reserves months
- —
- Total cash needed
- —
Loan-product check · same deal, 3 products live
Conventional
25% down · 7.5% · 30yr
- Down + closing
- —
- Monthly P&I
- —
- Monthly cashflow
- —
- DSCR
- —
- Eligible?
- —
Personal DTI + credit; lowest rate.
DSCR
20% down · 8.5% · 30yr
- Down + closing
- —
- Monthly P&I
- —
- Monthly cashflow
- —
- DSCR
- —
- Eligible?
- —
No personal income docs; deal must DSCR.
Hard money
10% down · 12.0% · 12mo
- Down + closing
- —
- Monthly P&I
- —
- Monthly cashflow
- —
- DSCR
- —
- Eligible?
- —
Short-term bridge; refi at stabilization.
Rent comps 4 comps
| Address | Beds | Baths | Sqft | Rent | $/sqft | DOM | Units | Dist |
|---|---|---|---|---|---|---|---|---|
| 8030 NE 50th St Kansas City, MO | 3.0 | 1.5 | 1047 | $1,595 | $1.52 | 3d | 1 | 0.27mi |
| 5128 N Palmer Ave Kansas City, MO | 3.0 | 2.0 | 905 | $1,646 | $1.82 | 43d | 1 | 0.32mi |
| 5042 N Bellaire Ave Kansas City, MO | 2.0 | 1.0 | 900 | $1,391 | $1.55 | 23d | 1 | 1.27mi |
| 6130 NE Vivion Rd Kansas City, MO | 3.0 | 1.0 | 1056 | $1,675 | $1.59 | 10d | 1 | 1.40mi |
Listing history 5 events
-
2026-05-02status Pending 635-char remark
-
2026-04-24$180,000 Active 635-char remark
-
2010-01-22soldstatus
-
2010-01-15soldstatus 653-char remark
Show marketing remark (653 chars)
So many updates! 1st-time buyers can qualify for the $8K tax credit if close B4 11-30-09! Hardwoods throughout main level and bedrooms. Ceramic Tile in Kitchen! BRAND NEW STAINLESS appliances, including Refrigerator! New Concrete driveway and adorable curb appeal! Outbuilding for extra storage & large back yard! No homes directly behind yard. Nothing to do but move in and add your special decorating touches. Large yard - doesn't directly back up to homes. Has an outbuilding/shed for additional storage and garage is oversized so the motorcycle or ATV, or workshop can fit inside with the car! Home Qualifies for KC DREAM while it lasts!
-
2009-10-28$104,750 653-char remark
Show marketing remark (653 chars)
So many updates! 1st-time buyers can qualify for the $8K tax credit if close B4 11-30-09! Hardwoods throughout main level and bedrooms. Ceramic Tile in Kitchen! BRAND NEW STAINLESS appliances, including Refrigerator! New Concrete driveway and adorable curb appeal! Outbuilding for extra storage & large back yard! No homes directly behind yard. Nothing to do but move in and add your special decorating touches. Large yard - doesn't directly back up to homes. Has an outbuilding/shed for additional storage and garage is oversized so the motorcycle or ATV, or workshop can fit inside with the car! Home Qualifies for KC DREAM while it lasts!
ⓘ Source: listings_history table (triggers on properties + properties_extension) + one-shot
backfill from property_details.listing_events for pre-trigger history.
Tax reassessment forecast MO · Resets to sale price
- Current annual tax
- $1,605 · $134/mo
- Projected year-2 tax
- $1,746 · $146/mo
- Expected delta
- +$141/yr (+$12/mo · 8.8%)
ⓘ Screening estimate from a state-policy table — verify with the county assessor before closing.
Climate risk First Street
- Flood 1/10 Low FEMA zone X (unshaded) · 0% chance over 30 yrs
- Wildfire 2/10 Low
- Heat 4/10 Moderate 7 d/yr ≥107°F today · 17 d/yr by 30 yrs out
- Wind 2/10 Low
- Air quality 3/10 Moderate 2 unhealthy d/yr today · 3 by 30 yrs out
Nearby sold comps map
Loading sold comps map…
Walkable amenities ~0.75 mi
Loading nearby amenities…
Taxation est. · year 1
- Rental income
- $20,932
- − Mortgage interest
- −$10,083
- − Property taxes
- −$1,605
- − Insurance
- −$900
- − Repairs & maintenance
- −$1,675
- − Management
- −$1,675
- − Depreciation
- −$5,236
- Taxable loss
- −$241
- Est. tax savings @ 24.0%
- +$58
- After-tax cash flow
- $2,762/yr
For passive investors: Depreciation is non-cash, so a rental often shows a tax loss while cash-flowing — sheltering income. Rental losses are passive: they offset passive income freely, and up to $25,000/yr can offset ordinary (W-2) income if you actively participate and your MAGI is under $100k (phasing out to $0 by $150k); unused losses carry forward. On sale, claimed depreciation is recaptured at up to 25%, and gains may owe capital-gains tax (a 1031 exchange can defer both). Figures are a year-1 estimate at your 24.0% rate — not tax advice; consult a CPA.
Schools (NCES district)
- District
- North Kansas City 74
- NCES district ID
- 2922800
- Math proficiency
- 38% ▼ -11.00%
- Reading proficiency
- 49% ▼ -3.00%
- Median HH income
- $55,444
- Composite
- 37.88/100
- National rank
- #4321
- State rank
- #98 of 324 in MO
Livability — Kansas City
- Score
- 78/100
- State rank
- #28
- US rank
- #2671
Category grades
Schools grade is shown separately in the Schools card above.
Census & demographics
- Census place
- Kansas City, MO
- County
- Clay County · 220,651 people
- City population
- 439,467
- Metro
- Kansas City, MO-KS
- Population (ZIP)
- 33,199
- Household income
- $83,929
- Rent vs Own
- Severe rent burden
- 603.0
Population outlook (Clay County) Hauer SSP2
- Today (2025)
- 266,022 people
- By 2030
- 280,057 · +5.3%
- By 2040
- 306,153 · +15.1%
- By 2050
- 328,630 · +23.5%
- By 2075
- 375,182 · +41.0%
- By 2100
- 392,861 · +47.7%
Race, ethnicity, and origin ACS 2023
- Neighborhood character
- Predominantly White (75%)
- Race & ethnicity
- White 75% Hispanic / Latino 8% Two or more races 8% Black 7% Asian 3% Pacific Islander 1%
- Hispanic origin (detail)
- Mexican 6%
- Common ancestry
- Romanian 2% Italian 2% Slovak 2%
- Foreign-born
- 7% · Canada, Vietnam, Jamaica
- Languages at home
- 90% English-only · Spanish 5% Other Asian/Pacific 1% Other Indo-European 1%
Political lean MEDSL · Clay
- 2024 margin
- Lean R (+5.6) · D 46.4% · R 52.0% · Other 1.6%
- 2008→2024 swing
- -4.9pp toward R · 2008: -0.7pp · 2024: -5.6pp
- All cycles
- 2024: R+5.6 2020: R+4.1 2016: R+11.1 2012: R+8.4 2008: R+0.7
Not yet ingested
- Civics
- —
Market trends
- HPI YoY
- ▼ -253.39%
- Current HPI
- 215.8366
- Rent YoY
- ▲ 6.09%
- Metro
- Kansas City, MO-KS
- State GDP YoY
- ▲ 1.84%
- F500 in state
- 20
Industry mix (Fortune 500 HQ in MO)
| Industry | F500 HQs | Revenue |
|---|---|---|
| Healthcare | 1 | $163B |
|
||
| Insurance | 1 | $21B |
|
||
| Industrial Technology | 1 | $17B |
|
||
| Retail | 1 | $16B |
|
||
| Industrial Distribution | 1 | $10B |
|
||
| Utilities | 1 | $9B |
|
||
Price history
+71.8% since first listed7 events — show timeline
- 2026-05-29 Sold (Public Records) — Public Records
- 2026-05-28 Sold (MLS) — Heartland MLS as Distributed by MLS Grid
- 2026-05-02 Pending — Heartland MLS as Distributed by MLS Grid
- 2026-04-24 Listed $180,000 Heartland MLS as Distributed by MLS Grid
- 2010-01-22 Sold (Public Records) — Public Records
- 2010-01-15 Sold (MLS) — Heartland MLS as Distributed by MLS Grid
- 2009-10-28 Listed $104,750 Heartland MLS as Distributed by MLS Grid
Property tax history
+3.7%/yrLatest (2025): $1,605 · +10.0% YoY. Source: county tax records.
Cash-flow waterfall
monthlySold comps — $/sqft
last 12 mo · ≤1 miLoading sold comps…