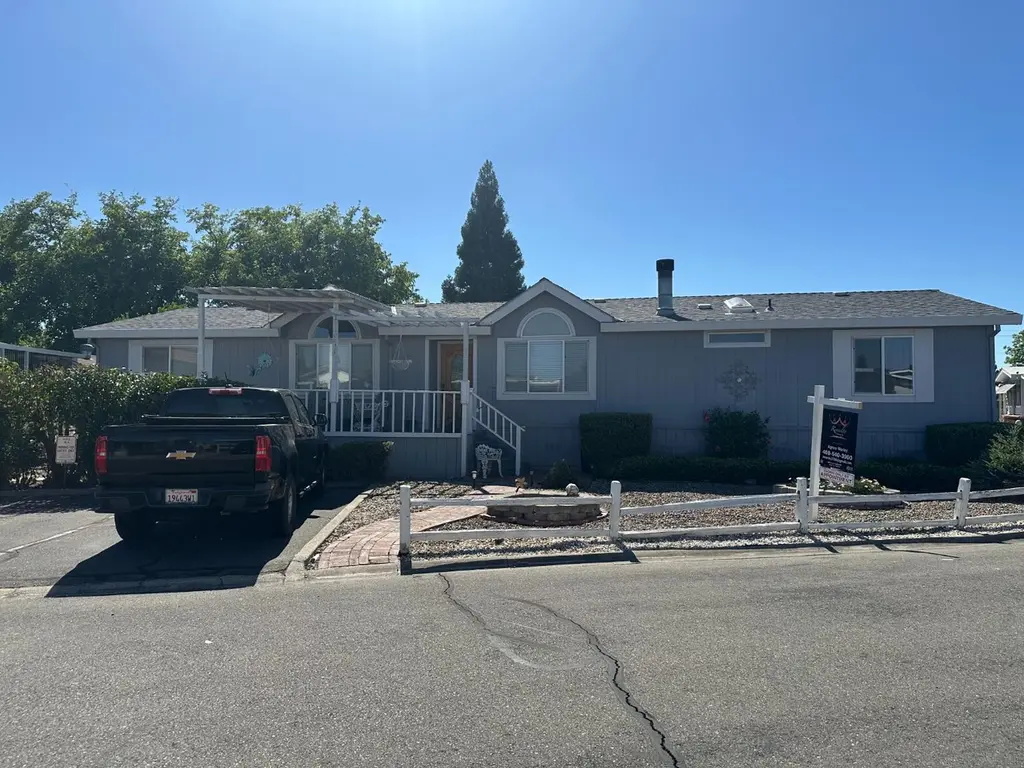
7508 Pintail Cir · Citrus Heights, CA
Flood risk 1/10 · Minimal
- FEMA flood zone
- X (unshaded)
- Chance of flooding over 30 yrs
- 0.0%
- Est. flood insurance / yr
- $507 – $1,088
Fire risk 2/10 · Minimal
- Est. fire insurance / yr
- $659 – $1,223
Heat risk 7/10 · Major
- Hot days now (above 103°F)
- 7 days/yr
- Hot days in 30 yrs
- 15 days/yr
Wind risk 1/10 · Minimal
- Chance of severe wind over 30 yrs
- —
Air-quality risk 10/10 · Severe
- Unhealthy air days now
- 34 days/yr
- Unhealthy air days in 30 yrs
- 36 days/yr
Risk factors via First Street. Map © Google.
Why this score? — see what drove the B grade
The composite is a weighted blend of 9 inputs, each scored 0–100. Each bar is that input's sub-score; the figure is the points it added to the 100-point composite (weight × sub-score).
- Cash flow +30.0/30.0
- DSCR +10.0/10.0
- 1% rule +9.1/10.0
- ARV discount +8.3/15.0
- Schools +4.4/10.0
- Rent growth +3.0/5.0
- Livability +3.0/5.0
- Condition / age +2.5/5.0
- Appreciation +0.0/10.0
$185,000
🖨 Deal sheet 📄 Offer letter ✓ Due diligence
Listing remarks
Welcome to this beautiful 3-bedroom mobile home, nestled on a spacious corner lot in a serene 55+ gated community. This warm and inviting home features a big spacious kitchen with a central island, large living room with vaulted ceilings, Fireplace, 3 sky lights one in each bathroom and kitchen, garden bathtub for ultimate relaxation, and a large master bedroom the second and third bedrooms are also spacious. This home is perfect for family and guests enjoy the beautiful living room ideal for gatherings. Outside, the front porch and back patio are perfect for relaxing in the summer sun, with a large shed and tool room. The community offers a clubhouse with pool tables, shuffleboard, horsesh
Key facts
- Corner lot
- 2 parking spots
- Listed 13 days
Tags
Property features AI
Finance
- Financial info: Land lease: No (listed land lease amount present in source but excluded per instructions)
- HOA & community: No homeowners association; Senior community
Exterior
- Parking: Off-street covered parking for 2 vehicles
- Utilities: Public water; Public sewer; Natural gas connected with individual gas meter; Cable connected; 220 volts in laundry
- Home design: Manufactured home (double wide) located in a park; Original condition; Fleetwood make
- Construction: Composition roof; Skirting: aluminum and wood
- Exterior features: Fenced yard; Backyard and front yard; Corner lot; Close to clubhouse; Garden; Patio awning, carport awning and porch awning; Storage area; Workshop and shed(s)
Interior
- Kitchen: Free-standing gas range; Free-standing gas oven; Free-standing refrigerator; Self-cleaning oven; Microwave; Dishwasher; Disposal; Hood over range; Island; Pantry closet; Laminate counters; Plumbed for ice maker; Ice maker
- Bedrooms: 3 bedrooms
- Flooring: Carpet; Laminate
- Bathrooms: 2 full bathrooms; Double sinks; Sunken tub; Tub with shower over; Outside access to bathroom
- Heating & cooling: Gas heating (natural gas); Ceiling fan(s)
- Interior features: Cathedral ceiling; Formal entry; Skylights / solar tubes; Dual-pane full windows; Porch steps; Covered deck and covered patio; Porch
- Laundry & utility: Inside laundry area with stacked washer and dryer included; Washer included; Dryer included; Gas hook-up; Laundry sink; 220V outlet in laundry
Neighborhood map
What this means for you Summary
Snapshot
- This is a 3-bed/2.0-bath manufactured listed at $185k.
Deal economics
- At list price, monthly cash flow is $958 ($12k/yr) — positive.
- The deal already cash-flows at list — no discount required.
- Meets the 1% rule at list price ($3k rent vs $185k).
- Cap rate 12.5% vs local median 3.4% in Citrus Heights — top-decile yield for the area; either an underpriced asset or a hidden risk that comps aren't pricing in. Stress-test before assuming the spread holds.
Location & tenants
- Location reads 60/100 on livability (#614 in CA) — a middle-class / working-renter tenant base. Strengths: housing A+; Watch: schools D, crime D-, amenities F.
- San Juan Unified (suburban): math 40% / reading 62% proficiency, ranked #138 of 517 in CA (top 27%) — acceptable for families but not a draw, mixed tenant base, ~2y average lease.
- Market conditions: Rents rising (+1.9%/yr); 210 active listings in the ZIP; 14 comparable units currently listed for rent nearby; rentals at typical pace (median 18d on market — plan ~3-4 weeks tenant-placement turnaround); solid renter incomes; 6,825 units permitted in Sacramento County in 2024 (1,752 in 5+ unit buildings).
- This rent runs 39% of the median local income ($81k/yr) — at the standard rent-burdened threshold; future hikes will face affordability resistance.
Forward outlook
- Local home prices are declining (-3.0%/yr); year-one equity from $1k of loan paydown is wiped out by about $6k of value loss. Plan a longer hold.
- Sacramento County population projected at +17% by 2050 — long-run rental-demand tailwind backs the buy-and-hold thesis.
- At projected returns (-3.0% appreciation + 1.9% rent growth), your $52k cash investment doubles in ~6 years — after that, you're playing with house money.
Negotiation context
- Only 13 days on market — expect competitive offers; lowballing is unlikely to land.
Risks & watch-outs
- Climate carrying-cost: extreme-heat days projected 7→15/yr by 2055 (HVAC capex compounding) — expect insurance premiums to compound above CPI over the hold.
Questions for the listing agent
- Is there a deadline driving the sale (1031 exchange, divorce, estate, relocation)? That informs how much negotiation room exists.
- Schools are D-rated, which usually means shorter tenancies and higher turnover. Who's the typical renter profile here, and what's been the actual vacancy rate?
- Crime grade is D in this area — have there been break-ins, vandalism, or insurance claims at this property in the last 3 years? What carrier currently insures it and at what premium?
- What's the average days-on-market for RENTAL listings here right now (not sales)? A rising rental-DOM trend means longer vacancies and softer asking-rent achievability than the comps imply.
- What's the recent tenant-quality profile in this submarket — average credit score on applications, eviction rate, late-payment / NSF rate, and stable-employment percentage? A property-management company in the area should have these aggregated.
- How much new for-sale + rental construction is in the pipeline within 1–3 miles? Heavy new supply typically softens prices + rents 12–24 months out; constrained supply supports both.
Investment metrics
- 1% rule
- 1.41% ✓
- Cap rate
- 12.51%
- Cash-on-cash
- 22.20%
- DSCR
- 1.99
- GRM
- 5.9
CMA / ARV
- ARV (on-the-fly)
- $188,136
- Comps found
- 8
Show comp detail 8 sales within ~0.75 mi
| Address | Dist | Beds/Ba | Sqft | Sold | Price | $/sf | Match |
|---|---|---|---|---|---|---|---|
| 7533 Pintail Cir | 0.07mi | 3/2.0 | 1,620 (-10%) | 1mo | $232,500 | $144 | 78 |
| 7535 Golden Eye Ln #126 | 0.15mi | 3/2.0 | 1,608 (-11%) | 2mo | $199,800 | $124 | 73 |
| 7508 Bufflehead Ln | 0.09mi | 3/2.0 | 1,560 (-14%) | 1mo | $165,000 | $106 | 72 |
| 7625 Pintail Cir | 0.12mi | 3/2.0 | 1,550 (-14%) | 9mo | $114,500 | $74 | 63 |
| 7420 White River Ln #173 | 0.14mi | 3/2.0 | 1,600 (-12%) | 15mo | $161,700 | $101 | 62 |
| 7425 Topanga Ln #263 | 0.15mi | 2/2.0 (-1) | 1,638 (-10%) | 15mo | $170,000 | $104 | 59 |
| 6032 Canvasback Ln | 0.18mi | 2/2.0 (-1) | 1,582 (-12%) | 10mo | $119,000 | $75 | 57 |
| 7429 Azimuth Ln #232 | 0.16mi | 3/2.0 | 1,560 (-14%) | 17mo | $149,000 | $96 | 55 |
Match score weights: distance 35% · size 25% · config 20% · recency 20%. Top-matched comps best support the ARV.
Projected returns pro-forma
-3.0% appreciation · 1.9% rent growth · sell at horizon
- IRR
- 13.8%
- Equity multiple
- 1.54×
- Total profit
- $28,134
- Equity at exit
- $27,584
- IRR
- 21.8%
- Equity multiple
- 2.76×
- Total profit
- $91,350
- Equity at exit
- $15,995
Cash invested: $51,800 (down + closing). Projections, not guarantees.
Landlord ↔ Tenant lean methodology
- Overall (STATE)
- 18 Strongly Tenant-Friendly
- State California
- 18 Strongly Tenant-Friendly · D+13
- County
- — inherits STATE
- City
- — inherits STATE
ZIP-level market 95621
- Rents YoY
- 1.9%
- Active inventory
- 210
- Price-to-rent
- 5.9×
Monthly cashflow live
- Estimated rent
- $2,609 high interval (Pro) →
- Mortgage (P&I)
- −$970
- Tax from tax record
- −$55 /mo · $665/yr
- Insurance
- −$77
- HOA
- −$0
- Vacancy / Maint / Mgmt
- −$548
- Net cashflow
- $958
Break-even live
UW: 25.0% down · 7.5% · 30yr · 1.5% tax · 5.0% vac · 8.0% maint · 8.0% mgmt
Financing live
Cash to close
- Down payment
- $46,250
- Closing costs
- $5,550
- Reserves months
- —
- Total cash needed
- —
Loan-product check · same deal, 3 products live
Conventional
25% down · 7.5% · 30yr
- Down + closing
- —
- Monthly P&I
- —
- Monthly cashflow
- —
- DSCR
- —
- Eligible?
- —
Personal DTI + credit; lowest rate.
DSCR
20% down · 8.5% · 30yr
- Down + closing
- —
- Monthly P&I
- —
- Monthly cashflow
- —
- DSCR
- —
- Eligible?
- —
No personal income docs; deal must DSCR.
Hard money
10% down · 12.0% · 12mo
- Down + closing
- —
- Monthly P&I
- —
- Monthly cashflow
- —
- DSCR
- —
- Eligible?
- —
Short-term bridge; refi at stabilization.
Rent comps 14 comps
| Address | Beds | Baths | Sqft | Rent | $/sqft | DOM | Units | Dist |
|---|---|---|---|---|---|---|---|---|
| 6948 Sunburst Way Citrus Heights, CA | 4.0 | 2.5 | 1673 | $3,000 | $1.79 | 43d | 1 | 0.81mi |
| 6319 Misty Wood Way Citrus Heights, CA | 3.0 | 2.0 | 1454 | $2,500 | $1.72 | 43d | 1 | 0.81mi |
| 7632 Van Maren Ln Unit 1 Citrus Heights, CA | 4.0 | 2.0 | 1300 | $2,495 | $1.92 | 14d | 1 | 0.90mi |
| 7613 Luzern Way Antelope, CA | 3.0 | 2.0 | 1401 | $2,500 | $1.78 | 11d | 1 | 0.97mi |
| 8077 Cornerstone Way Citrus Heights, CA | 4.0 | 2.0 | 1380 | $2,795 | $2.03 | 43d | 1 | 0.99mi |
| 7120 Van Maren Ln Citrus Heights, CA | 3.0 | 2.0 | 1292 | $2,495 | $1.93 | 17d | 1 | 1.03mi |
| 7862 Gazelle Trail Way Antelope, CA | 4.0 | 2.5 | 2300 | $2,950 | $1.28 | 10d | 1 | 1.10mi |
| 6948 Trailride Way Citrus Heights, CA | 4.0 | 3.0 | 1980 | $2,850 | $1.44 | 17d | 1 | 1.14mi |
| 6913 Gold Run Ave Sacramento, CA | 4.0 | 2.0 | 1474 | $2,800 | $1.90 | 20d | 1 | 1.15mi |
| 6940 Trailride Way Citrus Heights, CA | 3.0 | 2.0 | 1527 | $2,695 | $1.76 | 43d | 1 | 1.16mi |
| 7137 Reyn Oaks Way Sacramento, CA | 3.0 | 2.0 | 1279 | $2,455 | $1.92 | 12d | 1 | 1.26mi |
| 7137 Reyn Oaks Way Sacramento, CA | 3.0 | 2.0 | 1279 | $2,450 | $1.92 | 1d | 1 | 1.26mi |
| 4901 Adorn Ct Sacramento, CA | 3.0 | 2.0 | 1361 | $2,450 | $1.80 | 1d | 1 | 1.45mi |
| 7330 Stratford Pl #706 Sacramento, CA | 3.0 | 2.0 | 1322 | $2,600 | $1.97 | 1d | 1 | 1.48mi |
Listing history 10 events
-
2026-06-18days on market $185,000 Active 13 DOM
-
2026-06-17days on market $185,000 Active 12 DOM
-
2026-06-16days on market $185,000 Active 11 DOM
-
2026-06-15days on market $185,000 Active 10 DOM
-
2026-06-13days on market $185,000 Active 8 DOM
-
2026-06-13days on market $185,000 Active 7 DOM
-
2026-06-09days on market $185,000 Active 4 DOM
-
2026-06-08days on market $185,000 Active 3 DOM
-
2026-06-07remarks 699-char remark
-
2026-06-07$185,000 Active 2 DOM
ⓘ Source: listings_history table (triggers on properties + properties_extension) + one-shot
backfill from property_details.listing_events for pre-trigger history.
Tax reassessment forecast CA · Resets to sale price
- Current annual tax
- $665 · $55/mo
- Projected year-2 tax
- $1,406 · $117/mo
- Expected delta
- +$741/yr (+$62/mo · 111.5%)
ⓘ Screening estimate from a state-policy table — verify with the county assessor before closing.
Climate risk First Street
- Flood 1/10 Low FEMA zone X (unshaded) · 0% chance over 30 yrs
- Wildfire 2/10 Low
- Heat 7/10 Severe 7 d/yr ≥103°F today · 15 d/yr by 30 yrs out
- Wind 1/10 Low
- Air quality 10/10 Extreme 34 unhealthy d/yr today · 36 by 30 yrs out
Nearby sold comps map
Loading sold comps map…
Walkable amenities ~0.75 mi
Loading nearby amenities…
Taxation est. · year 1
- Rental income
- $31,306
- − Mortgage interest
- −$10,363
- − Property taxes
- −$665
- − Insurance
- −$925
- − Repairs & maintenance
- −$2,504
- − Management
- −$2,504
- − Depreciation
- −$5,382
- Taxable income
- $8,962
- Est. tax owed @ 24.0%
- −$2,151
- After-tax cash flow
- $9,349/yr
For passive investors: Depreciation is non-cash, so a rental often shows a tax loss while cash-flowing — sheltering income. Rental losses are passive: they offset passive income freely, and up to $25,000/yr can offset ordinary (W-2) income if you actively participate and your MAGI is under $100k (phasing out to $0 by $150k); unused losses carry forward. On sale, claimed depreciation is recaptured at up to 25%, and gains may owe capital-gains tax (a 1031 exchange can defer both). Figures are a year-1 estimate at your 24.0% rate — not tax advice; consult a CPA.
Schools (NCES district)
- District
- San Juan Unified
- NCES district ID
- 0634620
- Math proficiency
- 40% ▲ 3.00%
- Reading proficiency
- 62% ▲ 16.00%
- Median HH income
- $55,655
- Composite
- 44.07/100
- National rank
- #2878
- State rank
- #138 of 517 in CA
Livability — Citrus Heights
- Score
- 60/100
- State rank
- #614
- US rank
- #19580
Category grades
Schools grade is shown separately in the Schools card above.
Census & demographics
- Census place
- Citrus Heights, CA
- County
- Sacramento County · 1,539,646 people
- City population
- 89,370
- Metro
- Sacramento-Roseville-Folsom, CA
- Population (ZIP)
- 42,442
- Household income
- $80,901
- Rent vs Own
- Severe rent burden
- 1854.0
Population outlook (Sacramento County) Hauer SSP2
- Today (2025)
- 1,660,763 people
- By 2030
- 1,732,990 · +4.3%
- By 2040
- 1,855,755 · +11.7%
- By 2050
- 1,941,335 · +16.9%
- By 2075
- 2,046,162 · +23.2%
- By 2100
- 1,961,444 · +18.1%
Race, ethnicity, and origin ACS 2023
- Neighborhood character
- Predominantly White (66%)
- Race & ethnicity
- White 66% Hispanic / Latino 19% Two or more races 11% Asian 6% Black 2%
- Hispanic origin (detail)
- Mexican 16%
- Common ancestry
- Subsaharan African 3% Lithuanian 3% Scotch-Irish 2%
- Foreign-born
- 15% · Canada, Vietnam
- Languages at home
- 78% English-only · Spanish 10% Russian/Polish/Slavic 6% Other Indo-European 3%
Political lean MEDSL · Sacramento
- 2024 margin
- D (+19.7) · D 58.1% · R 38.4% · Other 3.5%
- 2008→2024 swing
- +0.7pp no change · 2008: 19.0pp · 2024: 19.7pp
- All cycles
- 2024: D+19.7 2020: D+25.3 2016: D+23.7 2012: D+16.3 2008: D+19.0
Not yet ingested
- Civics
- —
Market trends
- HPI YoY
- ▼ -408.14%
- Current HPI
- 351.9333
- Rent YoY
- ▲ 1.90%
- Metro
- Sacramento-Roseville-Folsom, CA
- State GDP YoY
- ▲ 3.21%
- F500 in state
- 116
Industry mix (Fortune 500 HQ in CA)
| Industry | F500 HQs | Revenue |
|---|---|---|
| Technology | 27 | $1,492B |
|
||
| Financial Services | 3 | $174B |
|
||
| Retail | 3 | $44B |
|
||
| Insurance | 3 | $26B |
|
||
| Media / Entertainment | 2 | $115B |
|
||
| Pharmaceuticals / Biotech | 2 | $62B |
|
||
Property tax history
+1.6%/yrLatest (2025): $665 · -2.7% YoY. Source: county tax records.
Cash-flow waterfall
monthlySold comps — $/sqft
last 12 mo · ≤1 miLoading sold comps…