 🏷️ Likely Rental
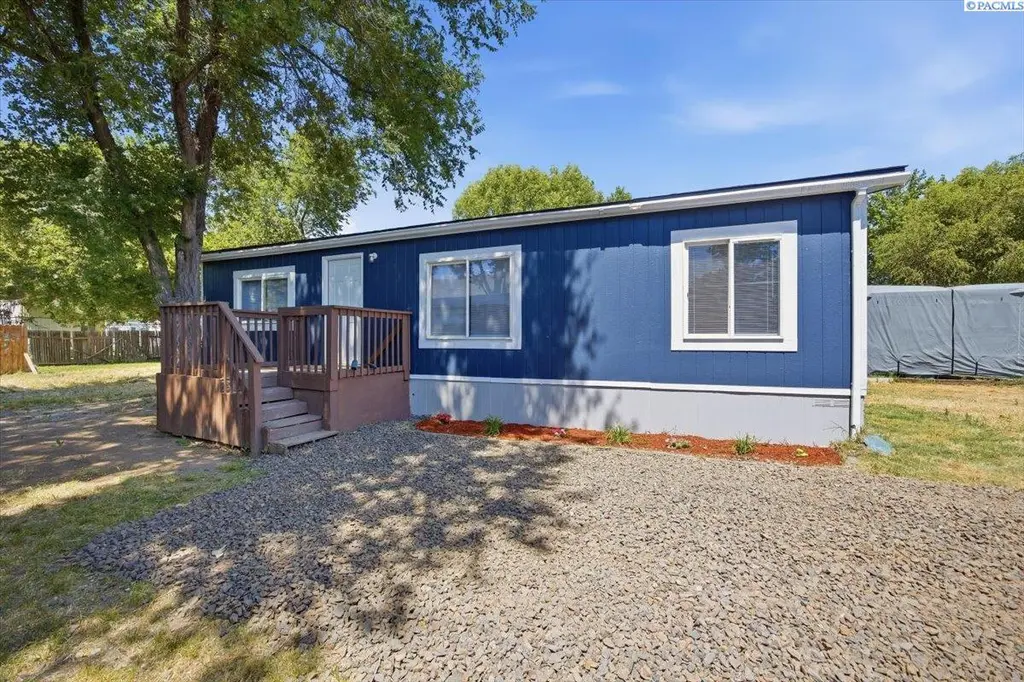
400 14th St Unit 20 St #20 · Benton City, WA
Flood risk 5/10 · Moderate
- FEMA flood zone
- X
- Chance of flooding over 30 yrs
- 0.4%
- Est. flood insurance / yr
- $473 – $860
Fire risk 7/10 · Major
- Est. fire insurance / yr
- $604 – $1,122
Heat risk 4/10 · Minor
- Hot days now (above 98°F)
- 7 days/yr
- Hot days in 30 yrs
- 14 days/yr
Wind risk 1/10 · Minimal
- Chance of severe wind over 30 yrs
- —
Air-quality risk 9/10 · Severe
- Unhealthy air days now
- 13 days/yr
- Unhealthy air days in 30 yrs
- 13 days/yr
Risk factors via First Street. Map © Google.
Why this score? — see what drove the B- grade
The composite is a weighted blend of 9 inputs, each scored 0–100. Each bar is that input's sub-score; the figure is the points it added to the 100-point composite (weight × sub-score).
- Cash flow +30.0/30.0
- 1% rule +10.0/10.0
- DSCR +10.0/10.0
- ARV discount +7.5/15.0
- Livability +3.5/5.0
- Schools +3.0/10.0
- Rent growth +2.5/5.0
- Condition / age +2.5/5.0
- Appreciation +0.0/10.0
$89,950
🖨 Deal sheet 📄 Offer letter ✓ Due diligence
Listing remarks MLS
Nice manufactured 3 bedroom, 2 bath home with very clean interior and exterior. It has a fenced backyard with a nice shed. Lot rent is $360.00 per month and includes water, sewer and irrigation. Buyer must submit a $35.00 non refundable fee for credit application and sign a lease agreement to park rules per park manager.
Key facts
- Bike walking path
- Fenced backyard
- Open kitchen
Tags
Property features AI
Finance
- Other: New construction; Manufactured home on a rented lot; Irrigation connected
Exterior
- Parking: No garage; Off-street parking
- Utilities: Public water; Electric on property; Electricity connected; Sewer connected
- Home design: Manufactured home (double wide); One story; Wood siding construction
- Construction: Composition roof
- Exterior features: Partial fencing; Paved road access; Irregular lot shape
Interior
- Kitchen: Dishwasher; Range; Oven; Pantry
- Flooring: Carpet; Laminate
- Bathrooms: 2 full bathrooms
- Heating & cooling: Heat pump heating; Heat pump cooling
- Interior features: Soaking tub; Walk-in closet(s); Pantry; Laminate countertops; Vaulted ceilings; Master bedroom on main level; Double pane windows
- Laundry & utility: Dedicated laundry room
Neighborhood map
What this means for you Summary
Snapshot
- This is a 3-bed/2.0-bath manufactured listed at $90k.
Deal economics
- At list price, monthly cash flow is $899 ($11k/yr) — positive.
- The deal already cash-flows at list — no discount required.
- Meets the 1% rule at list price ($2k rent vs $90k).
- Recommended offer: $89k (1.5% below list) — sets the bar for market timing.
- Cap rate 18.3% vs local median 2.8% in Benton City — top-decile yield for the area; either an underpriced asset or a hidden risk that comps aren't pricing in. Stress-test before assuming the spread holds.
Location & tenants
- Location reads 69/100 on livability (#258 in WA) — a middle-class / working-renter tenant base. Strengths: cost of living A+, housing A+, health & safety A+; Watch: employment D+, schools F, amenities F.
- Kiona-Benton City School District (town): math 25% / reading 35% proficiency, ranked #263 of 291 in WA (top 90%) — families likely to look elsewhere, expect single-tenant / working-renter base with shorter leases.
- Market conditions: 131 active listings in the ZIP; 3 comparable units currently listed for rent nearby; rentals at typical pace (median 21d on market — plan ~3-4 weeks tenant-placement turnaround); 1,532 units permitted in Benton County in 2024 (389 in 5+ unit buildings).
Forward outlook
- Local home prices are declining (-3.0%/yr); year-one equity from $622 of loan paydown is wiped out by about $3k of value loss. Plan a longer hold.
- Benton County population projected at +32% by 2050 — long-run rental-demand tailwind backs the buy-and-hold thesis.
- At projected returns (-3.0% appreciation + 3.0% rent growth), your $25k cash investment doubles in ~3 years — after that, you're playing with house money.
Negotiation context
- It's been on market 26 days — a 2% lower offer ($89k) is reasonable based on typical stale-listing flexibility.
- 3 sale attempts since 7y ago with the ask held roughly flat each time — persistent listings suggest the price (not the market) is what's stuck; bring a comps-based counter.
- Current owner paid $38k; list at $90k implies a 139% gain — meaningful room to come down on a strong offer.
Risks & watch-outs
- Climate carrying-cost: moderate flood risk; major wildfire risk — expect insurance premiums to compound above CPI over the hold.
Questions for the listing agent
- Is there a deadline driving the sale (1031 exchange, divorce, estate, relocation)? That informs how much negotiation room exists.
- Schools are F-rated, which usually means shorter tenancies and higher turnover. Who's the typical renter profile here, and what's been the actual vacancy rate?
- What's the average days-on-market for RENTAL listings here right now (not sales)? A rising rental-DOM trend means longer vacancies and softer asking-rent achievability than the comps imply.
- What's the recent tenant-quality profile in this submarket — average credit score on applications, eviction rate, late-payment / NSF rate, and stable-employment percentage? A property-management company in the area should have these aggregated.
- How much new for-sale + rental construction is in the pipeline within 1–3 miles? Heavy new supply typically softens prices + rents 12–24 months out; constrained supply supports both.
Investment metrics
- 1% rule
- 2.00% ✓
- Cap rate
- 18.28%
- Cash-on-cash
- 42.82%
- DSCR
- 2.91
- GRM
- 4.2
CMA / ARV
- ARV (on-the-fly)
- $238,680
- Comps found
- 3
Show comp detail 3 sales within ~0.75 mi
| Address | Dist | Beds/Ba | Sqft | Sold | Price | $/sf | Match |
|---|---|---|---|---|---|---|---|
| 410 Aspen Ct | 0.28mi | 3/2.0 | 1,045 (-3%) | 1mo | $340,000 | $325 | 81 |
| 400 14th St #43 | 0.00mi | 2/2.0 (-1) | 996 (-8%) | 12mo | $79,900 | $80 | 72 |
| 902 Sun Valley Way | 0.28mi | 3/2.0 | 1,040 (-4%) | 22mo | $230,000 | $221 | 63 |
Match score weights: distance 35% · size 25% · config 20% · recency 20%. Top-matched comps best support the ARV.
Projected returns pro-forma
-3.0% appreciation · 3.0% rent growth · sell at horizon
- IRR
- 39.6%
- Equity multiple
- 2.69×
- Total profit
- $42,632
- Equity at exit
- $13,412
- IRR
- 45.9%
- Equity multiple
- 5.40×
- Total profit
- $110,699
- Equity at exit
- $7,777
Cash invested: $25,186 (down + closing). Projections, not guarantees.
Landlord ↔ Tenant lean methodology
- Overall (STATE)
- 28 Tenant-Leaning
- State Washington
- 28 Tenant-Leaning · D+8
- County
- — inherits STATE
- City
- — inherits STATE
ZIP-level market 99320
- Home prices YoY
- -23.1%
- Active inventory
- 131
- Price-to-rent
- 4.2×
Monthly cashflow live
- Estimated rent
- $1,802 medium interval (Pro) →
- Mortgage (P&I)
- −$472
- Tax from tax record
- −$16 /mo · $189/yr
- Insurance
- −$37
- HOA
- −$0
- Vacancy / Maint / Mgmt
- −$378
- Net cashflow
- $899
Break-even live
UW: 25.0% down · 7.5% · 30yr · 1.5% tax · 5.0% vac · 8.0% maint · 8.0% mgmt
Financing live
Cash to close
- Down payment
- $22,488
- Closing costs
- $2,698
- Reserves months
- —
- Total cash needed
- —
Loan-product check · same deal, 3 products live
Conventional
25% down · 7.5% · 30yr
- Down + closing
- —
- Monthly P&I
- —
- Monthly cashflow
- —
- DSCR
- —
- Eligible?
- —
Personal DTI + credit; lowest rate.
DSCR
20% down · 8.5% · 30yr
- Down + closing
- —
- Monthly P&I
- —
- Monthly cashflow
- —
- DSCR
- —
- Eligible?
- —
No personal income docs; deal must DSCR.
Hard money
10% down · 12.0% · 12mo
- Down + closing
- —
- Monthly P&I
- —
- Monthly cashflow
- —
- DSCR
- —
- Eligible?
- —
Short-term bridge; refi at stabilization.
Rent comps 3 comps
| Address | Beds | Baths | Sqft | Rent | $/sqft | DOM | Units | Dist |
|---|---|---|---|---|---|---|---|---|
| 714 W 13th St Unit A Benton City, WA | 3.0 | 2.0 | 1174 | $1,995 | $1.70 | 13d | 1 | 0.45mi |
| 404 Belle Ave Apt 2 Benton City, WA | 3.0 | 1.5 | 1128 | $1,695 | $1.50 | 21d | 1 | 0.57mi |
| 41904 N River Rd Unit C Benton City, WA | 2.0 | 1.0 | 791 | $1,500 | $1.90 | 21d | 1 | 1.04mi |
Listing history 19 events
-
2026-06-16status $89,950 Pending 26 DOM
-
2026-06-16days on market $89,950 Active 26 DOM
-
2026-06-15days on market $89,950 Active 25 DOM
-
2026-06-14days on market $89,950 Active 23 DOM
-
2026-06-13days on market $89,950 Active 22 DOM
-
2026-06-10days on market $89,950 Active 20 DOM
-
2026-06-09days on market $89,950 Active 19 DOM
-
2026-06-08days on market $89,950 Active 18 DOM
-
2026-06-07days on market $89,950 Active 17 DOM
-
2026-06-03days on market $89,950 Active 13 DOM
-
2026-06-02days on market $89,950 Active 12 DOM
-
2026-06-01days on market $89,950 Active 11 DOM
-
2026-05-31days on market $89,950 Active 10 DOM
-
2026-05-30days on market $89,950 Active 9 DOM
-
2026-05-21$89,950 Active
-
2019-12-17soldstatus $37,700 322-char remark
Show marketing remark (322 chars)
Nice manufactured 3 bedroom, 2 bath home with very clean interior and exterior. It has a fenced backyard with a nice shed. Lot rent is $360.00 per month and includes water, sewer and irrigation. Buyer must submit a $35.00 non refundable fee for credit application and sign a lease agreement to park rules per park manager.
-
2019-09-03$40,000 322-char remark
Show marketing remark (322 chars)
Nice manufactured 3 bedroom, 2 bath home with very clean interior and exterior. It has a fenced backyard with a nice shed. Lot rent is $360.00 per month and includes water, sewer and irrigation. Buyer must submit a $35.00 non refundable fee for credit application and sign a lease agreement to park rules per park manager.
-
2019-04-24soldstatus $37,900 354-char remark
Show marketing remark (354 chars)
Nice manufactured 3 bedroom, 2 bath home with very clean interior and exterior. It has a fenced backyard with a nice shed. Lot rent is $360.00 a month and includes water, sewer and irrigation. Buyer must submit a $35.00 non refundable fee for credit application and sign a lease agreement to park rules per park manager. I am vacant, come see me anytime!
-
2019-04-03$37,900 354-char remark
Show marketing remark (354 chars)
Nice manufactured 3 bedroom, 2 bath home with very clean interior and exterior. It has a fenced backyard with a nice shed. Lot rent is $360.00 a month and includes water, sewer and irrigation. Buyer must submit a $35.00 non refundable fee for credit application and sign a lease agreement to park rules per park manager. I am vacant, come see me anytime!
ⓘ Source: listings_history table (triggers on properties + properties_extension) + one-shot
backfill from property_details.listing_events for pre-trigger history.
Tax reassessment forecast WA · Resets to sale price
- Current annual tax
- $189 · $16/mo
- Projected year-2 tax
- $882 · $73/mo
- Expected delta
- +$692/yr (+$58/mo · 366.0%)
ⓘ Screening estimate from a state-policy table — verify with the county assessor before closing.
Climate risk First Street
- Flood 5/10 Major FEMA zone X · 40% chance over 30 yrs
- Wildfire 7/10 Severe
- Heat 4/10 Moderate 7 d/yr ≥98°F today · 14 d/yr by 30 yrs out
- Wind 1/10 Low
- Air quality 9/10 Extreme 13 unhealthy d/yr today · 13 by 30 yrs out
Nearby sold comps map
Loading sold comps map…
Walkable amenities ~0.75 mi
Loading nearby amenities…
Taxation est. · year 1
- Rental income
- $21,625
- − Mortgage interest
- −$5,039
- − Property taxes
- −$189
- − Insurance
- −$450
- − Repairs & maintenance
- −$1,730
- − Management
- −$1,730
- − Depreciation
- −$2,617
- Taxable income
- $9,871
- Est. tax owed @ 24.0%
- −$2,369
- After-tax cash flow
- $8,416/yr
For passive investors: Depreciation is non-cash, so a rental often shows a tax loss while cash-flowing — sheltering income. Rental losses are passive: they offset passive income freely, and up to $25,000/yr can offset ordinary (W-2) income if you actively participate and your MAGI is under $100k (phasing out to $0 by $150k); unused losses carry forward. On sale, claimed depreciation is recaptured at up to 25%, and gains may owe capital-gains tax (a 1031 exchange can defer both). Figures are a year-1 estimate at your 24.0% rate — not tax advice; consult a CPA.
Schools (NCES district)
- District
- Kiona-Benton City School District
- NCES district ID
- 5304020
- Math proficiency
- 25% ▼ -1.00%
- Reading proficiency
- 35% ▲ 2.00%
- Median HH income
- $57,757
- Composite
- 29.76/100
- National rank
- #11722
- State rank
- #263 of 291 in WA
Livability — Benton City
- Score
- 69/100
- State rank
- #258
- US rank
- #8516
Category grades
Schools grade is shown separately in the Schools card above.
Census & demographics
- Census place
- Benton City, WA
- Population (ZIP)
- 10,157
Population outlook (Benton County) Hauer SSP2
- Today (2025)
- 219,421 people
- By 2030
- 233,813 · +6.6%
- By 2040
- 262,134 · +19.5%
- By 2050
- 290,100 · +32.2%
- By 2075
- 363,525 · +65.7%
- By 2100
- 418,667 · +90.8%
Race, ethnicity, and origin ACS 2023
- Neighborhood character
- Predominantly White (66%)
- Race & ethnicity
- White 66% Hispanic / Latino 28% Two or more races 14% Native American 2%
- Hispanic origin (detail)
- Mexican 24%
- Common ancestry
- Iranian 4% Portuguese 2% Slovak 2%
- Foreign-born
- 11% · Canada
- Languages at home
- 83% English-only · Spanish 16%
Political lean MEDSL · Benton
- 2024 margin
- Strong R (+21.9) · D 37.7% · R 59.6% · Other 2.7%
- 2008→2024 swing
- +4.2pp toward D · 2008: -26.1pp · 2024: -21.9pp
- All cycles
- 2024: R+21.9 2020: R+21.0 2016: R+26.6 2012: R+27.0 2008: R+26.1
Not yet ingested
- Civics
- —
Market trends
- HPI YoY
- ▼ -82.66%
- Current HPI
- 275.7841
- Rent YoY
- —
- Metro
- —
- State GDP YoY
- ▲ 4.65%
- F500 in state
- 22
Industry mix (Fortune 500 HQ in WA)
| Industry | F500 HQs | Revenue |
|---|---|---|
| Retail | 2 | $269B |
|
||
| Technology / Retail | 1 | $638B |
|
||
| Technology | 1 | $245B |
|
||
| Telecommunications | 1 | $38B |
|
||
| Food / Beverage | 1 | $36B |
|
||
| Automotive / Trucks | 1 | $34B |
|
||
Price history
+137.3% since first listed5 events — show timeline
- 2026-05-21 Listed $89,950 PACMLS
- 2019-12-17 Sold (MLS) $37,700 PACMLS
- 2019-09-03 Listed $40,000 PACMLS
- 2019-04-24 Sold (MLS) $37,900 PACMLS
- 2019-04-03 Listed $37,900 PACMLS
Property tax history
-3.2%/yrLatest (2026): $189 · -19.4% YoY. Source: county tax records.
Cash-flow waterfall
monthlySold comps — $/sqft
last 12 mo · ≤1 miLoading sold comps…