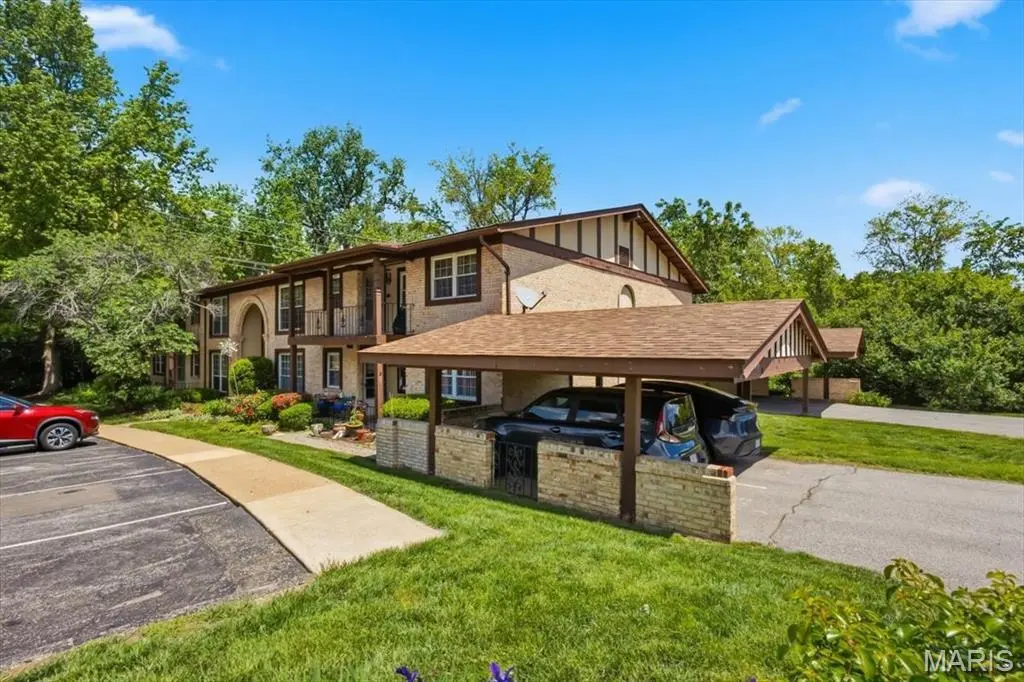
11709 Casa Grande Dr Unit G · Maryland Heights, MO
Flood risk 1/10 · Minimal
- FEMA flood zone
- X (unshaded)
- Chance of flooding over 30 yrs
- 0.0%
- Est. flood insurance / yr
- $473 – $860
Fire risk 1/10 · Minimal
- Est. fire insurance / yr
- $1,054 – $1,958
Heat risk 5/10 · Moderate
- Hot days now (above 106°F)
- 7 days/yr
- Hot days in 30 yrs
- 21 days/yr
Wind risk 2/10 · Minimal
- Chance of severe wind over 30 yrs
- 1.0%
Air-quality risk 2/10 · Minimal
- Unhealthy air days now
- 1 days/yr
- Unhealthy air days in 30 yrs
- 3 days/yr
Risk factors via First Street. Map © Google.
Why this score? — see what drove the B- grade
The composite is a weighted blend of 9 inputs, each scored 0–100. Each bar is that input's sub-score; the figure is the points it added to the 100-point composite (weight × sub-score).
- Cash flow +22.3/30.0
- Appreciation +10.0/10.0
- 1% rule +9.7/10.0
- ARV discount +7.5/15.0
- DSCR +7.1/10.0
- Schools +5.1/10.0
- Livability +3.6/5.0
- Condition / age +2.5/5.0
- Rent growth +1.8/5.0
$112,900
🖨 Deal sheet 📄 Offer letter ✓ Due diligence
Listing remarks MLS
This Remodeled Charmer Is Just Minutes From Westport & Ready For New Owners TODAY! LOW Monthly Condo Fees ($276), Private Yard Backing To Trees, Walk To Pool/Clubhouse/Tennis, Communal Laundry On First Floor In Building, EZ Access To Second Floor Storage, 2 Assigned Parking Spaces (1 Covered To The Right Of Building #G). KITCHEN Has White Subway Tile Backsplash, Espresso Wood Cabinets, SS Appliances, Breakfast Bar With Seating For 2, Window Overlooking Private Yard. Both The Kitchen & Main Bedroom Feature Doors To The Covered Balcony. BATHROOM Recently Remodeled (2021) With Adult Height Vanity, Shower/Tub Combo +Subway Tile Surround & Tile Flooring. Stainless Kitchen Appliances, Window Treatments & Furnishings Stay. *The TV & Mount To Be REMOVED Before Closing. ADDTIONAL WOW FEATURES: 2015 HVAC, Main Bedroom Ceiling Fan & WIC With Closet System Installed, Hallway Lined With Floor To Ceiling Closets, Award Winning Parkway Schools (Walk To Craig Elem) & EZ Access To HWY 270 & HWY 364.
Key facts
- $382 HOA
- Parking
- Community pool
Property features AI
Finance
- Other: Property type: Residential condominium; Above-grade finished area reported as 870 (source: assessor/appraiser)
- HOA & community: Villa Dorado community association; Annual HOA fee of $450; HOA covers clubhouse, grounds maintenance, parking/road maintenance, common area maintenance, exterior maintenance, pool maintenance, roof, sewer, snow removal, trash and water; Association management provided
Exterior
- Parking: Carport with 1 space; Additional parking available
- Utilities: Public water; Public sewer; Single phase electric; Cable available; Electricity available
- Home design: Condominium (attached); One level
- Construction: Brick and frame construction; Asbestos shingle roof
- Exterior features: Pool (community); Adjoins common ground; Adjoins wooded area
Interior
- Kitchen: Dishwasher; Range; Refrigerator; Free‑standing refrigerator
- Bedrooms: 2 bedrooms on the main level
- Bathrooms: 1 full bathroom (main level)
- Heating & cooling: Forced air heating (natural gas); Electric cooling
- Interior features: No basement; No fireplace; Adjoins common ground; Adjoins wooded area
- Laundry & utility: Washer/Dryer included
Neighborhood map
What this means for you Summary
Snapshot
- This is a 2-bed/1.0-bath condo listed at $113k.
Deal economics
- At list price, monthly cash flow is $186 ($2k/yr) — positive.
- The deal already cash-flows at list — no discount required.
- Meets the 1% rule at list price ($2k rent vs $113k).
- Cap rate 8.3% vs local median 4.3% in Maryland Heights — top-decile yield for the area; either an underpriced asset or a hidden risk that comps aren't pricing in. Stress-test before assuming the spread holds.
Location & tenants
- Location reads 71/100 on livability (#101 in MO) — a middle-class / working-renter tenant base. Strengths: cost of living A+, housing A+, crime A-; Watch: health & safety C-, amenities F, commute F.
- Parkway C-2 (suburban): math 49% / reading 62% proficiency, ranked #18 of 324 in MO (top 6%) — acceptable for families but not a draw, mixed tenant base, ~2y average lease; only 14% free/reduced lunch — higher-income household profile.
- Zoned schools: Craig Elem. (math 42% / reading 57%, grade D, #284 of 1,115 statewide, top 30%, 389 students, 17% FRL); North High (math 35% / reading 70%, grade C-, #89 of 521 statewide, top 17%, 1,074 students, 34% FRL).
- Market conditions: Rents soft (-3.0%/yr); 170 active listings in the ZIP; 7 comparable units currently listed for rent nearby; rentals leasing fast (median 4d on market — plan ~1-2 weeks tenant-placement turnaround); solid renter incomes; 920 units permitted in St. Louis County in 2024 (250 in 5+ unit buildings).
Forward outlook
- In year one you build about $12k of equity ($781 loan paydown + $11k appreciation (10.0% local appreciation)).
- At projected returns (10.0% appreciation + 0.0% rent growth), your $32k cash investment doubles in ~3 years — after that, you're playing with house money.
- By year 3, paydown + projected appreciation supports a ~$31k cash-out refi (75% LTV) — recoverable capital for the next deal without selling this one.
Negotiation context
- Only 12 days on market — expect competitive offers; lowballing is unlikely to land.
- 3 sale attempts since 11y ago with the ask held roughly flat each time — persistent listings suggest the price (not the market) is what's stuck; bring a comps-based counter.
Risks & watch-outs
- Watch-outs: HOA is 23% of rent.
- Climate carrying-cost: extreme-heat days projected 7→21/yr by 2055 (HVAC capex compounding) — expect insurance premiums to compound above CPI over the hold.
Questions for the listing agent
- Built in 1968 — when were the roof, HVAC, electrical panel, plumbing, and water heater last replaced?
- What does the HOA fee cover, when was the last increase, and are there any pending special assessments or reserve-fund shortfalls?
- Any open or pending special assessments — roof, HVAC, plumbing, elevator, façade? What's the per-unit balance and payoff schedule, and is the seller paying it off at close or rolling it to the buyer?
- Is there a deadline driving the sale (1031 exchange, divorce, estate, relocation)? That informs how much negotiation room exists.
- Schools are B-rated — typically a magnet for longer-tenancy family renters. What's the average tenant stay here, and is there a school-zone premium baked into asking?
- What's the average days-on-market for RENTAL listings here right now (not sales)? A rising rental-DOM trend means longer vacancies and softer asking-rent achievability than the comps imply.
- What's the recent tenant-quality profile in this submarket — average credit score on applications, eviction rate, late-payment / NSF rate, and stable-employment percentage? A property-management company in the area should have these aggregated.
- How much new apartment / multifamily construction is in the pipeline within 1–3 miles? Heavy new supply (>2% of stock underway) typically softens rents 12–24 months out; light construction supports rent growth.
Investment metrics
- 1% rule
- 1.47% ✓
- Cap rate
- 8.27%
- Cash-on-cash
- 7.05%
- DSCR
- 1.31
- GRM
- 5.7
CMA / ARV
No comps found within radius.
Projected returns pro-forma
10.0% appreciation · 0.0% rent growth · sell at horizon
- IRR
- 27.8%
- Equity multiple
- 3.17×
- Total profit
- $68,696
- Equity at exit
- $101,709
- IRR
- 23.2%
- Equity multiple
- 6.85×
- Total profit
- $184,780
- Equity at exit
- $219,340
Cash invested: $31,612 (down + closing). Projections, not guarantees.
Landlord ↔ Tenant lean methodology
- Overall (STATE)
- 81 Strongly Landlord-Friendly
- State Missouri
- 81 Strongly Landlord-Friendly · R+10
- County
- — inherits STATE
- City
- — inherits STATE
ZIP-level market 63146
- Home prices YoY
- 4.9%
- Rents YoY
- -3.0%
- Active inventory
- 170
- Price-to-rent
- 5.7×
Monthly cashflow live
- Estimated rent
- $1,656 high interval (Pro) →
- Mortgage (P&I)
- −$592
- Tax from tax record
- −$101 /mo · $1,213/yr
- Insurance
- −$47
- HOA
- −$382
- Vacancy / Maint / Mgmt
- −$348
- Net cashflow
- $186
Break-even live
UW: 25.0% down · 7.5% · 30yr · 1.5% tax · 5.0% vac · 8.0% maint · 8.0% mgmt
Financing live
Cash to close
- Down payment
- $28,225
- Closing costs
- $3,387
- Reserves months
- —
- Total cash needed
- —
Loan-product check · same deal, 3 products live
Conventional
25% down · 7.5% · 30yr
- Down + closing
- —
- Monthly P&I
- —
- Monthly cashflow
- —
- DSCR
- —
- Eligible?
- —
Personal DTI + credit; lowest rate.
DSCR
20% down · 8.5% · 30yr
- Down + closing
- —
- Monthly P&I
- —
- Monthly cashflow
- —
- DSCR
- —
- Eligible?
- —
No personal income docs; deal must DSCR.
Hard money
10% down · 12.0% · 12mo
- Down + closing
- —
- Monthly P&I
- —
- Monthly cashflow
- —
- DSCR
- —
- Eligible?
- —
Short-term bridge; refi at stabilization.
Rent comps 7 comps
| Address | Beds | Baths | Sqft | Rent | $/sqft | DOM | Units | Dist |
|---|---|---|---|---|---|---|---|---|
| 12401 Boulder Springs Pkwy St. Louis, MO | 1.0–3.0 | 1.0–2.0 | 1006 | $2,294 | $2.28 | 1d | 10 | 1.05mi |
| 1895 Boulder Springs Dr St. Louis, MO | 1.0–3.0 | 1.0–2.5 | 1083 | $2,258 | $2.09 | 1d | 6 | 1.13mi |
| 1380 Willow Brook Cove Ct St. Louis, MO | 2.0 | 1.5 | 910 | $1,550 | $1.70 | 14d | 1 | 1.15mi |
| 1434 Willow Brook Cove Ct St. Louis, MO | 2.0 | 1.5 | 910 | $1,395 | $1.53 | 43d | 1 | 1.21mi |
| 10900 Oak Forest Pkwy Dr St. Louis, MO | 1.0–2.0 | 1.0 | 800 | $1,600 | $2.00 | 3d | 6 | 1.33mi |
| 1007 E Rue De La Banque Creve Coeur, MO | 1.0–2.0 | 1.0 | 812 | $1,425 | $1.75 | 2d | 4 | 1.40mi |
| 1432 Glenmeade Dr Maryland Heights, MO | 3.0 | 2.0 | 1090 | $2,176 | $2.00 | 10d | 1 | 1.41mi |
HOA detail condo
- Monthly dues
- $382 · $4,584/yr
- Likely covers
- poolparking
- Assessments
- None detected in remarks — confirm with the listing agent.
Listing history 9 events
-
2026-06-18days on market $112,900 Active 12 DOM
-
2026-06-17days on market $112,900 Active 11 DOM
-
2026-06-16days on market $112,900 Active 10 DOM
-
2026-06-15days on market $112,900 Active 9 DOM
-
2026-06-13days on market $112,900 Active 7 DOM
-
2026-06-13days on market $112,900 Active 6 DOM
-
2026-06-09days on market $112,900 Active 3 DOM
-
2026-06-08days on market $112,900 Active 2 DOM
-
2026-06-07$112,900 Active 1 DOM
ⓘ Source: listings_history table (triggers on properties + properties_extension) + one-shot
backfill from property_details.listing_events for pre-trigger history.
Tax reassessment forecast MO · Resets to sale price
- Current annual tax
- $1,213 · $101/mo
- Projected year-2 tax
- $1,213 · $101/mo
- Expected delta
- $0/yr ($0/mo · 0.0%)
ⓘ Screening estimate from a state-policy table — verify with the county assessor before closing.
Climate risk First Street
- Flood 1/10 Low FEMA zone X (unshaded) · 0% chance over 30 yrs
- Wildfire 1/10 Low
- Heat 5/10 Major 7 d/yr ≥106°F today · 21 d/yr by 30 yrs out
- Wind 2/10 Low 100% chance of damaging wind over 30 yrs
- Air quality 2/10 Low 1 unhealthy d/yr today · 3 by 30 yrs out
Nearby sold comps map
Loading sold comps map…
Walkable amenities ~0.75 mi
Loading nearby amenities…
Taxation est. · year 1
- Rental income
- $19,866
- − Mortgage interest
- −$6,324
- − Property taxes
- −$1,213
- − Insurance
- −$564
- − Repairs & maintenance
- −$1,589
- − Management
- −$1,589
- − HOA
- −$4,584
- − Depreciation
- −$3,284
- Taxable income
- $717
- Est. tax owed @ 24.0%
- −$172
- After-tax cash flow
- $2,056/yr
For passive investors: Depreciation is non-cash, so a rental often shows a tax loss while cash-flowing — sheltering income. Rental losses are passive: they offset passive income freely, and up to $25,000/yr can offset ordinary (W-2) income if you actively participate and your MAGI is under $100k (phasing out to $0 by $150k); unused losses carry forward. On sale, claimed depreciation is recaptured at up to 25%, and gains may owe capital-gains tax (a 1031 exchange can defer both). Figures are a year-1 estimate at your 24.0% rate — not tax advice; consult a CPA.
Schools (NCES district)
- District
- Parkway C-2
- NCES district ID
- 2923580
- Math proficiency
- 49% ▼ -11.00%
- Reading proficiency
- 62% ▼ -2.00%
- Median HH income
- $83,551
- Composite
- 50.5/100
- National rank
- #1851
- State rank
- #18 of 324 in MO
Livability — Maryland Heights
- Score
- 71/100
- State rank
- #101
- US rank
- #6808
Category grades
Schools grade is shown separately in the Schools card above.
Census & demographics
- County
- Saint Louis County · 888,823 people
- City population
- 21,924
- Metro
- St. Louis, MO-IL
- Population (ZIP)
- 30,678
- Household income
- $84,756
- Rent vs Own
- Severe rent burden
- 1156.0
Population outlook (St. Louis County) Hauer SSP2
- Today (2025)
- 1,025,227 people
- By 2030
- 1,028,023 · +0.3%
- By 2040
- 1,020,940 · -0.4%
- By 2050
- 1,007,280 · -1.8%
- By 2075
- 987,277 · -3.7%
- By 2100
- 921,984 · -10.1%
Race, ethnicity, and origin ACS 2023
- Neighborhood character
- Diverse neighborhood (Simpson 0.56)
- Race & ethnicity
- White 63% Asian 17% Black 13% Two or more races 4% Hispanic / Latino 3%
- Common ancestry
- Scotch-Irish 3% Romanian 3% Italian 2%
- Foreign-born
- 19% · China, South Korea, Canada
- Languages at home
- 79% English-only · Other Asian/Pacific 7% Other Indo-European 4% Chinese 3%
Political lean MEDSL · St. Louis
- 2024 margin
- Strong D (+23.4) · D 60.8% · R 37.4% · Other 1.7%
- 2008→2024 swing
- +3.5pp toward D · 2008: 19.9pp · 2024: 23.4pp
- All cycles
- 2024: D+23.4 2020: D+24.0 2016: D+16.2 2012: D+13.7 2008: D+19.9
Not yet ingested
- Civics
- —
Market trends
- HPI YoY
- ▲ 33.10%
- Current HPI
- 711.49
- Rent YoY
- ▼ -2.96%
- Metro
- St. Louis, MO-IL
- State GDP YoY
- ▲ 1.84%
- F500 in state
- 20
Industry mix (Fortune 500 HQ in MO)
| Industry | F500 HQs | Revenue |
|---|---|---|
| Healthcare | 1 | $163B |
|
||
| Insurance | 1 | $21B |
|
||
| Industrial Technology | 1 | $17B |
|
||
| Retail | 1 | $16B |
|
||
| Industrial Distribution | 1 | $10B |
|
||
| Utilities | 1 | $9B |
|
||
Price history
+306.1% since first listed13 events — show timeline
- 2026-06-06 Listed $112,900 MARIS as Distributed by MLS Grid
- 2022-08-30 Sold (Public Records) $115,000 Public Records
- 2022-08-24 Sold (MLS) — MARIS as Distributed by MLS Grid
- 2022-07-18 Pending — MARIS as Distributed by MLS Grid
- 2022-07-14 Listed $105,000 MARIS as Distributed by MLS Grid
- 2015-04-01 Sold (Public Records) $73,000 Public Records
- 2015-03-31 Sold (MLS) — MARIS as Distributed by MLS Grid
- 2015-02-23 Delisted — MARIS as Distributed by MLS Grid
- 2015-02-05 Price Changed $76,000 MARIS as Distributed by MLS Grid
- 2015-02-04 Price Changed $78,500 MARIS as Distributed by MLS Grid
- 2015-02-02 Listed $76,000 MARIS as Distributed by MLS Grid
- 2014-01-24 Sold (Public Records) $27,800 Public Records
- 2014-01-24 Sold (Public Records) $27,800 Public Records
Property tax history
+2.6%/yrLatest (2022): $1,213 · +0.7% YoY. Source: county tax records.
Cash-flow waterfall
monthlySold comps — $/sqft
last 12 mo · ≤1 miLoading sold comps…