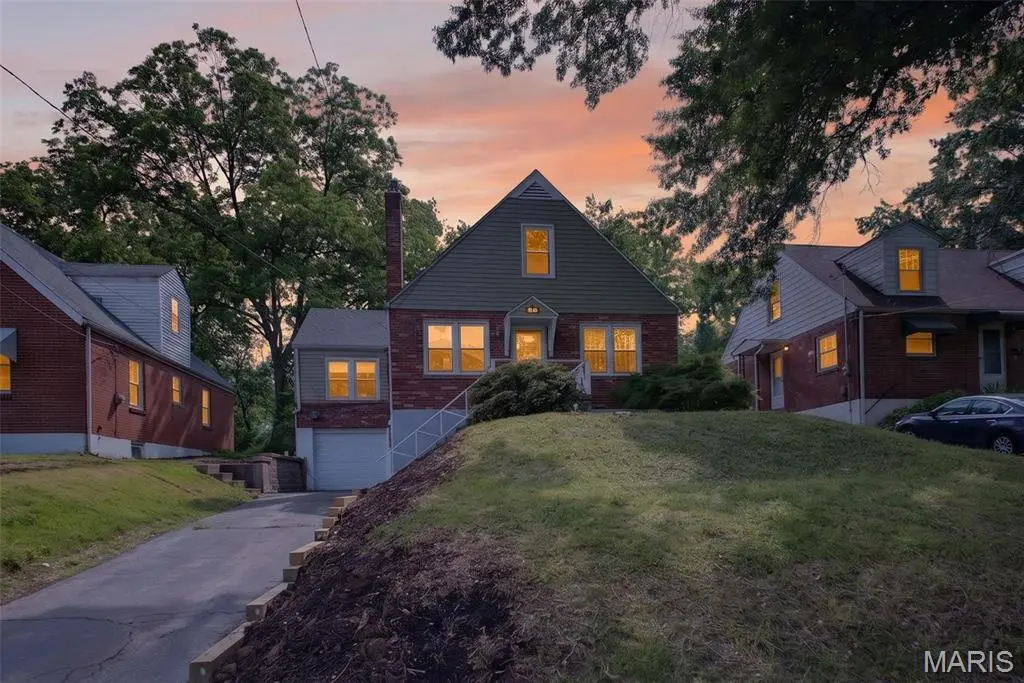
130 S Barat Ave · Ferguson, MO
Flood risk 1/10 · Minimal
- FEMA flood zone
- X (unshaded)
- Chance of flooding over 30 yrs
- 0.0%
- Est. flood insurance / yr
- $473 – $860
Fire risk 1/10 · Minimal
- Est. fire insurance / yr
- $1,054 – $1,958
Heat risk 4/10 · Minor
- Hot days now (above 106°F)
- 7 days/yr
- Hot days in 30 yrs
- 20 days/yr
Wind risk 2/10 · Minimal
- Chance of severe wind over 30 yrs
- 1.0%
Air-quality risk 4/10 · Minor
- Unhealthy air days now
- 4 days/yr
- Unhealthy air days in 30 yrs
- 5 days/yr
Risk factors via First Street. Map © Google.
Why this score? — see what drove the D- grade
The composite is a weighted blend of 9 inputs, each scored 0–100. Each bar is that input's sub-score; the figure is the points it added to the 100-point composite (weight × sub-score).
- Cash flow +16.1/30.0
- DSCR +5.0/10.0
- Rent growth +4.8/5.0
- 1% rule +4.0/10.0
- ARV discount +3.5/15.0
- Livability +2.9/5.0
- Condition / age +2.5/5.0
- Schools +1.2/10.0
- Appreciation +0.0/10.0
$159,900
🖨 Deal sheet (PDF) 📄 Offer letter ✓ Due diligence
Listing remarks
Beautifully renovated all-brick home in the heart of Ferguson! This move-in ready property blends classic charm with modern updates throughout. Step inside to find refinished hardwood floors, fresh paint, updated lighting, and a spacious living room featuring a cozy fireplace and built-in shelving. The fully updated kitchen offers modern cabinetry, sleek finishes, and plenty of space for everyday living and entertaining. Updated bathrooms on multiple levels add convenience and style, while the versatile upper-level bedroom provides the perfect private retreat, office, or flex space. The full basement offers tons of storage and additional potential. Outside, enjoy a large fenced backyard, en
Key facts
- Cozy fireplace
- Updated lighting
- Built-in shelving
Tags
Property features AI
Exterior
- Parking: Attached garage with 1 car space
- Utilities: Public water; Public sewer; 220-volt electric; Natural gas connected
- Home design: Single family residence; Residential property; Two levels; Entry and living area above grade per assessor
- Construction: Brick construction
- Exterior features: Back yard
Interior
- Bedrooms: Three bedrooms total; Two bedrooms on the main level; One bedroom on the upper level
- Bathrooms: One full bathroom; Two half bathrooms; Main level has one full bathroom; Upper level has one half bathroom; Lower level has one half bathroom
- Heating & cooling: Natural gas heating; Central air conditioning
- Interior features: Basement with block construction; Fireplace in the family room; Six total rooms
Neighborhood map
What this means for you Summary
Snapshot
- This is a 2-bed/1.0-bath single-family listed at $160k.
Deal economics
- At list price, monthly cash flow is $83 ($998/yr) — positive.
- The deal already cash-flows at list — no discount required.
- To meet the 1% rule (rent ≥ 1% of price), the offer needs to be $143k (10.4% below list).
- Recommended offer: $143k (10.4% below list) — sets the bar for 1% rule.
- Cap rate 6.9% vs local median 8.9% in Ferguson — below-typical yield; the buyer is paying a premium for something (appreciation thesis, condition, location) that the cap rate doesn't capture.
Location & tenants
- Location reads 58/100 on livability (#586 in MO) — a working-class tenant base; expect higher turnover. Strengths: cost of living A+, housing B+; Watch: health & safety C-, crime F, amenities F.
- Ferguson-Florissant R-II (suburban): math 7% / reading 20% proficiency, ranked #311 of 324 in MO (top 96%) — low school quality limits family demand, transient renter base, plan for 1-2y turnover; 70% free/reduced lunch — lower-income household profile, screen leases tightly.
- Zoned schools: Griffith Elementary (math 3% / reading 9%, grade F, #1,069 of 1,115 statewide, top 96%, 282 students, 99% FRL); Ferguson Middle (math 3% / reading 14%, grade F, #376 of 391 statewide, top 96%, 615 students, 100% FRL); Mccluer High (math 0% / reading 17%, grade F, #511 of 521 statewide, top 98%, 1,181 students, 100% FRL) — zoned schools average 99% FRL vs 70% district-wide (30 pts higher); higher-poverty schools than district average — tighter screening recommended.
- Market conditions: Rents rising fast (+9.0%/yr); 165 active listings in the ZIP; 14 comparable units currently listed for rent nearby; rentals lingering (median 46d on market — plan ~5-8 weeks vacancy on turnover, expect pricing pressure); 50% of comp listings sitting > 30 days — soft ceiling on asking rent; 920 units permitted in St. Louis County in 2024 (250 in 5+ unit buildings).
- This rent runs 33% of the median local income ($52k/yr) — at the standard rent-burdened threshold; future hikes will face affordability resistance.
Forward outlook
- Local home prices are declining (-3.0%/yr); year-one equity from $1k of loan paydown is wiped out by about $5k of value loss. Plan a longer hold.
Negotiation context
- It's been on market 23 days — a 2% lower offer ($158k) is reasonable based on typical stale-listing flexibility.
- Current owner paid $25k; list at $160k implies a 540% gain — meaningful room to come down on a strong offer.
Risks & watch-outs
- Watch-outs: built in 1951 — expect roof / HVAC / electrical / plumbing capex.
Questions for the listing agent
- Built in 1951 — when were the roof, HVAC, electrical panel, plumbing, and water heater last replaced?
- Is there a deadline driving the sale (1031 exchange, divorce, estate, relocation)? That informs how much negotiation room exists.
- Schools are F-rated, which usually means shorter tenancies and higher turnover. Who's the typical renter profile here, and what's been the actual vacancy rate?
- Crime grade is F in this area — have there been break-ins, vandalism, or insurance claims at this property in the last 3 years? What carrier currently insures it and at what premium?
- The area grade is low — what's the realistic commute time and amenity access for the typical tenant pool here? Any planned neighborhood developments (good or bad) we should know about?
- What's the average days-on-market for RENTAL listings here right now (not sales)? A rising rental-DOM trend means longer vacancies and softer asking-rent achievability than the comps imply.
- What's the recent tenant-quality profile in this submarket — average credit score on applications, eviction rate, late-payment / NSF rate, and stable-employment percentage? A property-management company in the area should have these aggregated.
- How much new for-sale + rental construction is in the pipeline within 1–3 miles? Heavy new supply typically softens prices + rents 12–24 months out; constrained supply supports both.
Investment metrics
- 1% rule
- 0.90% ✗
- Cap rate
- 6.92%
- Cash-on-cash
- 2.23%
- DSCR
- 1.10
- GRM
- 9.3
CMA / ARV
- ARV (on-the-fly)
- $146,880
- Comps found
- 12
Show comp detail 12 sales within ~0.75 mi
| Address | Dist | Beds/Ba | Sqft | Sold | Price | $/sf | Match |
|---|---|---|---|---|---|---|---|
| 135 S Barat Ave | 0.04mi | 2/1.0 | 1,440 (-6%) | 6mo | $96,900 | $67 | 83 |
| 38 Bayview Ct | 0.30mi | 3/1.0 (+1) | 1,472 (-4%) | 4mo | $124,900 | $85 | 71 |
| 274 Dashwood Dr | 0.34mi | 3/1.0 (+1) | 1,454 (-5%) | 5mo | $139,900 | $96 | 67 |
| 332 Argent Ave | 0.69mi | 2/1.5 | 1,558 (+2%) | 0mo | $185,000 | $119 | 63 |
| 237 S Barat Ave | 0.14mi | 2/2.0 | 1,310 (-14%) | 4mo | $85,000 | $65 | 62 |
| 1325 Kappel Dr | 0.69mi | 3/1.0 (+1) | 1,414 (-8%) | 2mo | $139,000 | $98 | 49 |
| 509 Royal Ave | 0.54mi | 3/1.5 (+1) | 1,375 (-10%) | 3mo | $110,000 | $80 | 48 |
| 406 Teston Dr | 0.59mi | 3/1.0 (+1) | 1,320 (-14%) | 4mo | $89,900 | $68 | 41 |
| 410 Argent Ave | 0.73mi | 3/2.0 (+1) | 1,634 (+7%) | 6mo | $210,000 | $129 | 40 |
| 1330 Chambers Rd | 0.64mi | 3/2.0 (+1) | 1,339 (-12%) | 3mo | $139,900 | $104 | 37 |
| 425 S Clark Ave | 0.74mi | 3/1.5 (+1) | 1,734 (+13%) | 2mo | $190,000 | $110 | 34 |
| 536 Ames Pl | 0.66mi | 3/1.5 (+1) | 1,304 (-15%) | 5mo | $69,900 | $54 | 33 |
Match score weights: distance 35% · size 25% · config 20% · recency 20%. Top-matched comps best support the ARV.
Projected returns pro-forma
-3.0% appreciation · 8.0% rent growth · sell at horizon
- IRR
- -7.5%
- Equity multiple
- 0.71×
- Total profit
- $-13,058
- Equity at exit
- $23,842
- IRR
- 7.3%
- Equity multiple
- 1.67×
- Total profit
- $29,842
- Equity at exit
- $13,825
Cash invested: $44,772 (down + closing). Projections, not guarantees.
Landlord ↔ Tenant lean methodology
- Overall (STATE)
- 81 Strongly Landlord-Friendly
- State Missouri
- 81 Strongly Landlord-Friendly · R+10
- County
- — inherits STATE
- City
- — inherits STATE
ZIP-level market 63135
- Rents YoY
- 9.0%
- Active inventory
- 165
- Price-to-rent
- 9.3×
Monthly cashflow live
- Estimated rent
- $1,432 high interval (Pro) →
- Mortgage (P&I)
- −$839
- Tax from tax record
- −$143 /mo · $1,715/yr
- Insurance
- −$67
- HOA
- −$0
- Vacancy / Maint / Mgmt
- −$301
- Net cashflow
- $83
Break-even live
Sensitivity live
| Price | -10% $174 | -5% $128 | +0% $83 | +5% $38 | +10% $-7 |
|---|---|---|---|---|---|
| Rent | -10% $-30 | -5% $27 | +0% $83 | +5% $140 | +10% $196 |
| Rate | -1.0pp $164 | -0.5pp $124 | base $83 | +0.5pp $42 | +1.0pp $0 |
UW: 25.0% down · 7.5% · 30yr · 1.5% tax · 5.0% vac · 8.0% maint · 8.0% mgmt
Financing live
Cash to close
- Down payment
- $39,975
- Closing costs
- $4,797
- Reserves months
- —
- Total cash needed
- —
Loan-product check · same deal, 3 products live
Conventional
25% down · 7.5% · 30yr
- Down + closing
- —
- Monthly P&I
- —
- Monthly cashflow
- —
- DSCR
- —
- Eligible?
- —
Personal DTI + credit; lowest rate.
DSCR
20% down · 8.5% · 30yr
- Down + closing
- —
- Monthly P&I
- —
- Monthly cashflow
- —
- DSCR
- —
- Eligible?
- —
No personal income docs; deal must DSCR.
Hard money
10% down · 12.0% · 12mo
- Down + closing
- —
- Monthly P&I
- —
- Monthly cashflow
- —
- DSCR
- —
- Eligible?
- —
Short-term bridge; refi at stabilization.
Rent comps 14 comps
| Address | Beds | Baths | Sqft | Rent | $/sqft | DOM | Units | Dist |
|---|---|---|---|---|---|---|---|---|
| 13 N Hartnett Ave Saint Louis, MO | 3.0 | 1.0 | 1140 | $1,400 | $1.23 | 12d | 1 | 0.19mi |
| 1006 Highmont Dr Saint Louis, MO | 3.0 | 1.0 | 1920 | $1,550 | $0.81 | 45d | 1 | 0.21mi |
| 945 Edgehill Dr Saint Louis, MO | 3.0 | 1.0 | 1110 | $1,575 | $1.42 | 45d | 1 | 0.27mi |
| 299 Dashwood Dr Saint Louis, MO | 3.0 | 2.0 | 1920 | $1,575 | $0.82 | 25d | 1 | 0.39mi |
| 338 Saint Louis Ave Saint Louis, MO | 3.0 | 1.0 | 1200 | $1,200 | $1.00 | 45d | 1 | 0.41mi |
| 419 S Florissant Rd Ferguson, MO | 2.0 | 1.0 | 1100 | $1,200 | $1.09 | 45d | 1 | 0.61mi |
| 25 S Dellwood Ave Saint Louis, MO | 3.0 | 1.0 | 1944 | $1,600 | $0.82 | 45d | 1 | 0.62mi |
| 6170 Emerald Ave Saint Louis, MO | 3.0 | 1.0 | 1286 | $1,500 | $1.17 | 16d | 1 | 0.73mi |
| 6170 Emerald Ave Saint Louis, MO | 3.0 | 1.0 | 1286 | $1,425 | $1.11 | 3d | 1 | 0.73mi |
| 324 Emmett Ave Saint Louis, MO | 3.0 | 2.0 | 1357 | $1,650 | $1.22 | 25d | 1 | 0.83mi |
| 9845 Dennis Dr Saint Louis, MO | 3.0 | 1.0 | 1251 | $1,200 | $0.96 | 0d | 1 | 0.98mi |
| 9717 Dennis Dr Saint Louis, MO | 3.0 | 1.0 | 1056 | $1,323 | $1.25 | 45d | 1 | 1.00mi |
| 265 S Harvey Ave Saint Louis, MO | 3.0 | 1.5 | 1240 | $1,350 | $1.09 | 45d | 1 | 1.10mi |
| 541 Hentschel Pl Saint Louis, MO | 2.0 | 1.0 | 1305 | $1,500 | $1.15 | 6d | 1 | 1.46mi |
Listing history 16 events
-
2026-06-21days on market $159,900 Active 23 DOM
-
2026-06-18days on market $159,900 Active 20 DOM
-
2026-06-17days on market $159,900 Active 19 DOM
-
2026-06-16days on market $159,900 Active 18 DOM
-
2026-06-15days on market $159,900 Active 17 DOM
-
2026-06-13status $159,900 Active 15 DOM
-
2026-06-05statusdays on market $159,900 Pending 15 DOM
-
2026-06-03days on market $159,900 Active 14 DOM
-
2026-06-02days on market $159,900 Active 13 DOM
-
2026-06-01days on market $159,900 Active 12 DOM
-
2026-05-31days on market $159,900 Active 11 DOM
-
2026-05-20$159,900 Active
-
2011-07-06soldstatus $25,000
-
2004-11-16soldstatus $88,700
-
1989-08-01soldstatus
-
1987-08-01soldstatus
ⓘ Source: listings_history table (triggers on properties + properties_extension) + one-shot
backfill from property_details.listing_events for pre-trigger history.
Tax reassessment forecast MO · Resets to sale price
- Current annual tax
- $1,715 · $143/mo
- Projected year-2 tax
- $1,715 · $143/mo
- Expected delta
- $0/yr ($0/mo · 0.0%)
ⓘ Screening estimate from a state-policy table — verify with the county assessor before closing.
Climate risk First Street
- Flood 1/10 Low FEMA zone X (unshaded) · 0% chance over 30 yrs
- Wildfire 1/10 Low
- Heat 4/10 Moderate 7 d/yr ≥106°F today · 20 d/yr by 30 yrs out
- Wind 2/10 Low 100% chance of damaging wind over 30 yrs
- Air quality 4/10 Moderate 4 unhealthy d/yr today · 5 by 30 yrs out
Nearby sold comps map
Loading sold comps map…
Walkable amenities ~0.75 mi
Loading nearby amenities…
Taxation est. · year 1
- Rental income
- $17,184
- − Mortgage interest
- −$8,957
- − Property taxes
- −$1,715
- − Insurance
- −$800
- − Repairs & maintenance
- −$1,375
- − Management
- −$1,375
- − Depreciation
- −$4,652
- Taxable loss
- −$1,689
- Est. tax savings @ 24.0%
- +$405
- After-tax cash flow
- $1,404/yr
For passive investors: Depreciation is non-cash, so a rental often shows a tax loss while cash-flowing — sheltering income. Rental losses are passive: they offset passive income freely, and up to $25,000/yr can offset ordinary (W-2) income if you actively participate and your MAGI is under $100k (phasing out to $0 by $150k); unused losses carry forward. On sale, claimed depreciation is recaptured at up to 25%, and gains may owe capital-gains tax (a 1031 exchange can defer both). Figures are a year-1 estimate at your 24.0% rate — not tax advice; consult a CPA.
Schools (NCES district)
- District
- Ferguson-Florissant R-II
- NCES district ID
- 2912010
- Math proficiency
- 7% ▼ -9.00%
- Reading proficiency
- 20% ▼ -6.00%
- Median HH income
- $44,610
- Composite
- 11.96/100
- National rank
- #9666
- State rank
- #311 of 324 in MO
Livability — Ferguson
- Score
- 58/100
- State rank
- #586
- US rank
- #20809
Category grades
Schools grade is shown separately in the Schools card above.
Census & demographics
- Census place
- Ferguson, MO
- County
- Saint Louis County · 888,823 people
- City population
- 18,381
- Metro
- St. Louis, MO-IL
- Population (ZIP)
- 18,381
- Household income
- $52,328
- Rent vs Own
- Severe rent burden
- 957.0
Population outlook (St. Louis County) Hauer SSP2
- Today (2025)
- 1,025,227 people
- By 2030
- 1,028,023 · +0.3%
- By 2040
- 1,020,940 · -0.4%
- By 2050
- 1,007,280 · -1.8%
- By 2075
- 987,277 · -3.7%
- By 2100
- 921,984 · -10.1%
Race, ethnicity, and origin ACS 2023
- Neighborhood character
- Predominantly Black (66%)
- Race & ethnicity
- Black 66% White 28% Two or more races 3% Hispanic / Latino 2%
- Common ancestry
- Lithuanian 1% Iranian 1% Romanian 1%
- Foreign-born
- 1% · Canada
- Languages at home
- 95% English-only · Spanish 4%
Political lean MEDSL · St. Louis
- 2024 margin
- Strong D (+23.4) · D 60.8% · R 37.4% · Other 1.7%
- 2008→2024 swing
- +3.5pp toward D · 2008: 19.9pp · 2024: 23.4pp
- All cycles
- 2024: D+23.4 2020: D+24.0 2016: D+16.2 2012: D+13.7 2008: D+19.9
Not yet ingested
- Civics
- —
Market trends
- HPI YoY
- ▼ -152.56%
- Current HPI
- 138.6781
- Rent YoY
- ▲ 9.03%
- Metro
- St. Louis, MO-IL
- State GDP YoY
- ▲ 1.84%
- F500 in state
- 20
Industry mix (Fortune 500 HQ in MO)
| Industry | F500 HQs | Revenue |
|---|---|---|
| Healthcare | 1 | $163B |
|
||
| Insurance | 1 | $21B |
|
||
| Industrial Technology | 1 | $17B |
|
||
| Retail | 1 | $16B |
|
||
| Industrial Distribution | 1 | $10B |
|
||
| Utilities | 1 | $9B |
|
||
Price history
+80.3% since first listed5 events — show timeline
- 2026-05-20 Listed $159,900 MARIS as Distributed by MLS Grid
- 2011-07-06 Sold (Public Records) $25,000 Public Records
- 2004-11-16 Sold (Public Records) $88,700 Public Records
- 1989-08-01 Sold (Public Records) — Public Records
- 1987-08-01 Sold (Public Records) — Public Records
Property tax history
+0.0%/yrLatest (2022): $1,715 · +3.3% YoY. Source: county tax records.
Cash-flow waterfall
monthlySold comps — $/sqft
last 12 mo · ≤1 miLoading sold comps…