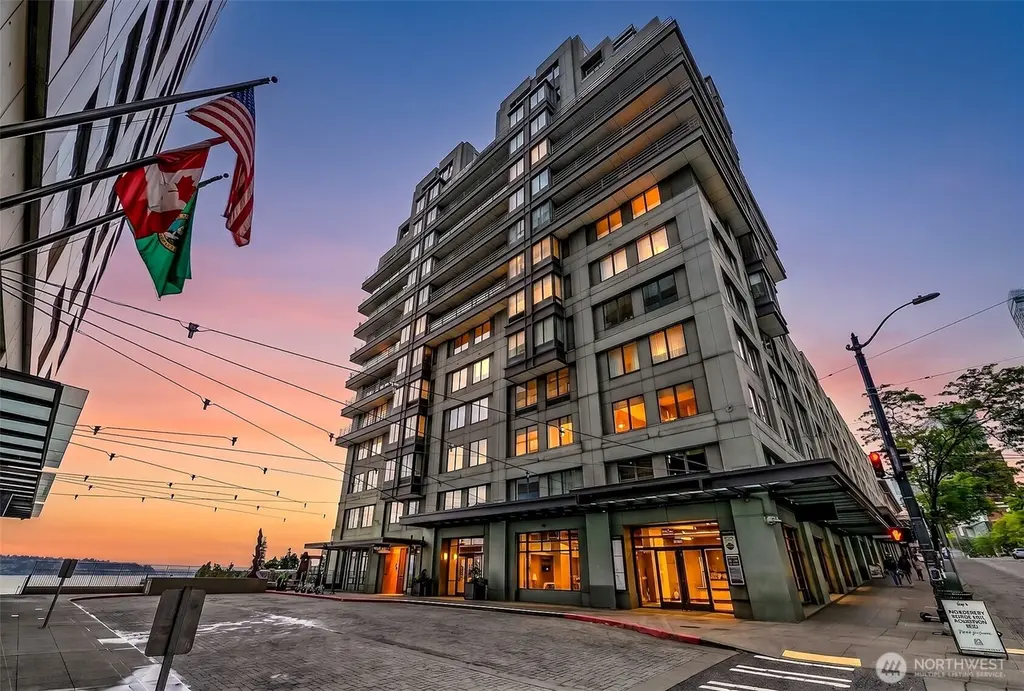
98 Union St #514 · Seattle, WA
Flood risk 1/10 · Minimal
- FEMA flood zone
- X (unshaded)
- Chance of flooding over 30 yrs
- 0.0%
- Est. flood insurance / yr
- $507 – $1,088
Fire risk 1/10 · Minimal
- Est. fire insurance / yr
- $604 – $1,122
Heat risk 3/10 · Minor
- Hot days now (above 86°F)
- 7 days/yr
- Hot days in 30 yrs
- 15 days/yr
Wind risk 1/10 · Minimal
- Chance of severe wind over 30 yrs
- —
Air-quality risk 7/10 · Major
- Unhealthy air days now
- 11 days/yr
- Unhealthy air days in 30 yrs
- 11 days/yr
Risk factors via First Street. Map © Google.
Why this score? — see what drove the D grade
The composite is a weighted blend of 9 inputs, each scored 0–100. Each bar is that input's sub-score; the figure is the points it added to the 100-point composite (weight × sub-score).
- ARV discount +15.0/15.0
- Schools +6.1/10.0
- Appreciation +4.7/10.0
- Livability +3.8/5.0
- 1% rule +3.7/10.0
- Cash flow +3.3/30.0
- Condition / age +2.5/5.0
- Rent growth +2.4/5.0
- DSCR +0.0/10.0
$565,000
🖨 Deal sheet (PDF) 📄 Offer letter ✓ Due diligence
Listing remarks
Live at the epicenter of Seattle’s most iconic destinations - just steps from Pike Place Market, the Seattle Art Museum, the Four Seasons, and the revitalized Waterfront Park. Located in the renowned 98 Union Condominium, designed by Olson Sundberg Architects, this concrete-and-steel building blends timeless Seattle architecture with full-service urban living, including 24-hour concierge, secure parking, storage, elevators, atrium, and resident amenities. This sophisticated two-level residence is quietly positioned on the east side with entry from the atrium. The main level features an updated kitchen, dining area, open living space, half bath, and in-unit laundry - ideal for entertai
Key facts
- 98 union condominium
- Secure parking
- In unit laundry
Tags
Property features AI
Finance
- Other: Bus line nearby; Located on the corner of 1st & Union Street across from the Four Seasons; Building name: 98 Union; Multi-family building; total stories 13; two levels in unit
- Financial info: Listing terms: Cash or Conventional
- HOA & community: HOA present; monthly fee includes common area maintenance, concierge, earthquake insurance, gas, internet, sewer, trash and water; Association fee billed monthly; Building amenities include clubhouse, elevator, exercise room, game/rec room, lobby entrance, gated entry, high-speed internet and concierge; 76 units in the community
Exterior
- Parking: Common garage with 3 parking spaces (1 covered) on level -1; Garage included
- Security: Security gate; Building has fire sprinklers
- Utilities: Electric energy source; Water provided by HOA; Sewer provided by HOA; Cable provided via HOA; Internet connected (Astound); Power by Seattle City Light
- Home design: Attached condominium; Condo across two levels; Entry at main level; Unit on 5th floor of a 13-story building; Remodeled/updated
- Construction: Cement plank and stucco construction; Torch down roof
- Exterior features: Cement planked and stucco exterior; Curbs, paved surfaces and sidewalk; Unit has a view
Interior
- Kitchen: Dishwasher; Garbage disposal; Microwave; Refrigerator; Stove/Range
- Bedrooms: 2 bedrooms (both on the second level)
- Bathrooms: 1 full bath; 1 three-quarter bath; 1 half bath; 1 bathtub; 2 showers; Main level powder room
- Heating & cooling: Radiant heating; No cooling
- Interior features: Window coverings included; Insulated windows; Primary bathroom
- Laundry & utility: Washer; Dryer; Storage unit (Storage #514 located on -1 level)
Neighborhood map
What this means for you Summary
Snapshot
- This is a 2-bed/2.5-bath condo listed at $565k.
Deal economics
- At list price, monthly cash flow is $-2k ($-21k/yr) — negative.
- To cash-flow at today's rent, offer at most $254k (55.1% below list).
- To meet the 1% rule (rent ≥ 1% of price), the offer needs to be $490k (13.3% below list).
- Recommended offer: $254k (55.1% below list) — sets the bar for cash-flow.
- Cap rate 2.5% vs local median 1.6% in Seattle — top-decile yield for the area; either an underpriced asset or a hidden risk that comps aren't pricing in. Stress-test before assuming the spread holds.
Location & tenants
- Location reads 75/100 on livability (#166 in WA, #4,033 nationally) — a middle-class / working-renter tenant base. Strengths: amenities A+, commute A+, employment A+; Watch: crime F, cost of living F.
- Seattle Public Schools (urban): math 64% / reading 72% proficiency, ranked #19 of 291 in WA (top 6%) — acceptable for families but not a draw, mixed tenant base, ~2y average lease.
- Zoned schools: Hazel Wolf K-8 (720 students, 22% FRL); Mcclure Middle School (429 students, 19% FRL); Garfield High School (1,642 students, 40% FRL) — zoned schools at 27% FRL track the district average.
- Market conditions: Rents soft (-0.3%/yr); 155 active listings in the ZIP; 40 comparable units currently listed for rent nearby; rentals leasing fast (median 0d on market — plan ~1-2 weeks tenant-placement turnaround); high-income renter base; 10,555 units permitted in King County in 2024 (7,119 in 5+ unit buildings).
- At $4,901/mo this rent would consume 46% of the median local household income ($129k/yr) (locally 1840% of renters already pay >50% of income on rent) — very limited rent-growth headroom before tenants either downsize or default.
Forward outlook
- In year one you build about $958 of equity ($4k loan paydown + $-3k appreciation (-0.5% local appreciation)).
- King County population projected at +44% by 2050 — long-run rental-demand tailwind backs the buy-and-hold thesis.
- By year 10, paydown + projected appreciation supports a ~$34k cash-out refi (75% LTV) — recoverable capital for the next deal without selling this one.
Negotiation context
- It's been on market 50 days — a 3% lower offer ($548k) is reasonable based on typical stale-listing flexibility.
- 4 sale attempts since 20y ago with the ask held roughly flat each time — persistent listings suggest the price (not the market) is what's stuck; bring a comps-based counter.
- Current owner paid $368k; list at $565k implies a 54% gain — meaningful room to come down on a strong offer.
Risks & watch-outs
- Watch-outs: HOA is 39% of rent.
Questions for the listing agent
- What do current leases actually rent for vs. the listed asking? Can we see a recent rent roll and the last 12 months of T-12 income?
- It's been on market 50 days. Have you received any prior offers? Is the seller open to a 55% concession, seller financing, or rate buy-down credit?
- What does the HOA fee cover, when was the last increase, and are there any pending special assessments or reserve-fund shortfalls?
- Any open or pending special assessments — roof, HVAC, plumbing, elevator, façade? What's the per-unit balance and payoff schedule, and is the seller paying it off at close or rolling it to the buyer?
- Is there a deadline driving the sale (1031 exchange, divorce, estate, relocation)? That informs how much negotiation room exists.
- Schools are A-rated — typically a magnet for longer-tenancy family renters. What's the average tenant stay here, and is there a school-zone premium baked into asking?
- Crime grade is F in this area — have there been break-ins, vandalism, or insurance claims at this property in the last 3 years? What carrier currently insures it and at what premium?
- The area grade is low — what's the realistic commute time and amenity access for the typical tenant pool here? Any planned neighborhood developments (good or bad) we should know about?
- What's the average days-on-market for RENTAL listings here right now (not sales)? A rising rental-DOM trend means longer vacancies and softer asking-rent achievability than the comps imply.
- What's the recent tenant-quality profile in this submarket — average credit score on applications, eviction rate, late-payment / NSF rate, and stable-employment percentage? A property-management company in the area should have these aggregated.
- How much new apartment / multifamily construction is in the pipeline within 1–3 miles? Heavy new supply (>2% of stock underway) typically softens rents 12–24 months out; light construction supports rent growth.
Investment metrics
- 1% rule
- 0.87% ✗
- Cap rate
- 2.55%
- Cash-on-cash
- -13.37%
- DSCR
- 0.40
- GRM
- 9.6
CMA / ARV
- ARV (median comp)
- $702,105
- List price
- $565,000
- Delta
- -19.53%
- Verdict
- UNDERPRICED
- Comps
- 20 within 1.0 mi
Projected returns pro-forma
-0.52% appreciation · 0.0% rent growth · sell at horizon
- IRR
- -23.0%
- Equity multiple
- 0.02×
- Total profit
- $-155,748
- Equity at exit
- $149,474
- IRR
- -19.9%
- Equity multiple
- -0.72×
- Total profit
- $-272,098
- Equity at exit
- $168,413
Cash invested: $158,200 (down + closing). Projections, not guarantees.
Landlord ↔ Tenant lean methodology
- Overall (CITY)
- 0 Strongly Tenant-Friendly
- State Washington
- 28 Tenant-Leaning · D+8
- County
- — inherits STATE
- City Seattle
- 0 Strongly Tenant-Friendly · D+52
ZIP-level market 98101
- Home prices YoY
- -0.3%
- Rents YoY
- -0.3%
- Active inventory
- 155
- Price-to-rent
- 9.6×
Monthly cashflow live
- Estimated rent
- $4,901 high interval (Pro) →
- Mortgage (P&I)
- −$2,963
- Tax from tax record
- −$532 /mo · $6,387/yr
- Insurance
- −$235
- HOA
- −$1,904
- Vacancy / Maint / Mgmt
- −$1,029
- Net cashflow
- $-1,763
Break-even live
Sensitivity live
| Price | -10% $-1,443 | -5% $-1,603 | +0% $-1,763 | +5% $-1,923 | +10% $-2,083 |
|---|---|---|---|---|---|
| Rent | -10% $-2,150 | -5% $-1,957 | +0% $-1,763 | +5% $-1,569 | +10% $-1,376 |
| Rate | -1.0pp $-1,478 | -0.5pp $-1,619 | base $-1,763 | +0.5pp $-1,909 | +1.0pp $-2,058 |
UW: 25.0% down · 7.5% · 30yr · 1.5% tax · 5.0% vac · 8.0% maint · 8.0% mgmt
Financing live
Cash to close
- Down payment
- $141,250
- Closing costs
- $16,950
- Reserves months
- —
- Total cash needed
- —
Loan-product check · same deal, 3 products live
Conventional
25% down · 7.5% · 30yr
- Down + closing
- —
- Monthly P&I
- —
- Monthly cashflow
- —
- DSCR
- —
- Eligible?
- —
Personal DTI + credit; lowest rate.
DSCR
20% down · 8.5% · 30yr
- Down + closing
- —
- Monthly P&I
- —
- Monthly cashflow
- —
- DSCR
- —
- Eligible?
- —
No personal income docs; deal must DSCR.
Hard money
10% down · 12.0% · 12mo
- Down + closing
- —
- Monthly P&I
- —
- Monthly cashflow
- —
- DSCR
- —
- Eligible?
- —
Short-term bridge; refi at stabilization.
Rent comps 40 comps
| Address | Beds | Baths | Sqft | Rent | $/sqft | DOM | Units | Dist |
|---|---|---|---|---|---|---|---|---|
| 1415 2nd Ave Unit 979 Seattle, WA | 2.0 | 2.0 | 1006 | $4,080 | $4.06 | 0d | 1 | 0.07mi |
| 50 University St Seattle, WA | 1.0–2.0 | 1.0–2.0 | 765 | $4,490 | $5.87 | 0d | 5 | 0.11mi |
| 1430 2nd Ave Seattle, WA | 1.0–2.0 | 1.0–2.5 | 1286 | $10,944 | $8.51 | 0d | 23 | 0.11mi |
| 1221 1st Ave Seattle, WA | 2.0 | 1.0–2.0 | 1128 | $5,385 | $4.77 | 0d | 32 | 0.14mi |
| 1600 2nd Ave Seattle, WA | 2.0 | 1.0–2.0 | 859 | $5,165 | $6.01 | 0d | 28 | 0.19mi |
| 1900 1st Ave Seattle, WA | 1.0–2.0 | 1.0–2.0 | 658 | $3,565 | $5.41 | 0d | 17 | 0.20mi |
| 1900 1st Ave Seattle, WA | 1.0 | 1.0–1.5 | 703 | $3,142 | $4.47 | 26d | 11 | 0.20mi |
| 1915 2nd Ave Seattle, WA | 2.0 | 1.0–2.0 | 765 | $3,950 | $5.16 | 0d | 10 | 0.21mi |
| 1305 4th Ave Seattle, WA | 2.0 | 1.0–2.0 | 1360 | $2,000 | $1.47 | 0d | 1 | 0.22mi |
| 1340 4th Ave Seattle, WA | 1.0–3.0 | 1.0–3.5 | 1773 | $14,145 | $7.98 | 0d | 24 | 0.23mi |
| 88 Virginia St Seattle, WA | 3.0 | 2.5 | 1741 | $6,000 | $3.45 | 15d | 1 | 0.24mi |
| 2015 2nd Ave Seattle, WA | 2.0 | 1.0–2.0 | 879 | $4,648 | $5.29 | 0d | 29 | 0.28mi |
| 2000 Alaskan Way #552 Seattle, WA | 2.0 | 2.0 | 1127 | $3,950 | $3.50 | 19d | 1 | 0.31mi |
| 2033 2nd Ave Seattle, WA | 1.0 | 1.0 | 764 | $3,375 | $4.42 | 12d | 2 | 0.31mi |
| 2033 2nd Ave #1900 Seattle, WA | 1.0 | 1.0 | 928 | $4,000 | $4.31 | 4d | 1 | 0.32mi |
| 300 Virginia St Seattle, WA | 2.0 | 2.0 | 940 | $5,100 | $5.43 | 3d | 1 | 0.33mi |
| 1920 4th Ave Seattle, WA | 1.0 | 1.5 | 952 | $3,300 | $3.47 | 6d | 1 | 0.35mi |
| 1920 4th Ave Seattle, WA | 1.0–2.0 | 1.0–2.0 | 1432 | $7,950 | $5.55 | 12d | 2 | 0.35mi |
| 1920 4th Ave Seattle, WA | 1.0–2.0 | 1.0–2.0 | 1432 | $7,950 | $5.55 | 26d | 3 | 0.35mi |
| 888 Western Ave Seattle, WA | 2.0 | 1.0–2.0 | 849 | $4,278 | $5.04 | 0d | 10 | 0.36mi |
| 2134 Western Ave Seattle, WA | 2.0 | 1.0–2.0 | 720 | $3,665 | $5.09 | 5d | 14 | 0.37mi |
| 2125 1st Ave #1702 Seattle, WA | 2.0 | 1.5 | 1035 | $3,695 | $3.57 | 45d | 1 | 0.38mi |
| 909 5th Ave #1501 Seattle, WA | 1.0 | 1.5 | 1241 | $4,680 | $3.77 | 13d | 1 | 0.39mi |
| 909 5th Ave #2301 Seattle, WA | 1.0 | 1.5 | 1244 | $4,500 | $3.62 | 3d | 1 | 0.39mi |
| 2116 4th Ave Seattle, WA | 2.0 | 1.0–2.0 | 1164 | $4,495 | $3.86 | 15d | 19 | 0.45mi |
| 2116 4th Ave Seattle, WA | 1.0–2.0 | 1.0–2.0 | 922 | $4,850 | $5.26 | 0d | 21 | 0.45mi |
| 2105 5th Ave Seattle, WA | 2.0 | 1.0–2.0 | 837 | $4,443 | $5.31 | 0d | 6 | 0.45mi |
| 702 Spring St Seattle, WA | 3.0 | 1.0–2.0 | 1172 | $5,280 | $4.50 | 0d | 35 | 0.46mi |
| 901 6th Ave Seattle, WA | 1.0–4.0 | 1.0 | 1000 | $980 | $0.98 | 0d | 4 | 0.46mi |
| 2201 4th Ave Seattle, WA | 1.0–2.0 | 1.0–2.0 | 849 | $3,399 | $4.00 | 0d | 4 | 0.48mi |
| 737 Olive Way Seattle, WA | 2.0 | 2.0 | 1541 | $5,745 | $3.73 | 0d | 1 | 0.48mi |
| 1942 Westlake Ave Seattle, WA | 2.0 | 1.0–2.0 | 872 | $4,745 | $5.44 | 0d | 13 | 0.48mi |
| 704 Spring St Seattle, WA | 2.0 | 1.0–2.0 | 741 | $3,740 | $5.04 | 0d | 3 | 0.49mi |
| 800 Seneca St Seattle, WA | 2.0 | 1.0–2.0 | 815 | $4,017 | $4.93 | 0d | 32 | 0.50mi |
| 2300 Elliott Ave Seattle, WA | 1.0 | 1.0 | 799 | $2,572 | $3.22 | 0d | 9 | 0.50mi |
| 2208 4th Ave Seattle, WA | 3.0 | 1.0–2.0 | 951 | $5,596 | $5.88 | 0d | 82 | 0.50mi |
| 606 2nd Ave Seattle, WA | 1.0 | 1.0 | 1034 | $2,700 | $2.61 | 0d | 1 | 0.51mi |
| 1525 9th Ave Seattle, WA | 1.0–3.0 | 1.0–3.0 | 1005 | $4,368 | $4.34 | 0d | 25 | 0.52mi |
| 1601 9th Ave Seattle, WA | 1.0–2.0 | 1.0–2.0 | 839 | $3,525 | $4.20 | 0d | 3 | 0.53mi |
| 809 Olive Way Seattle, WA | 1.0–2.0 | 1.0–2.0 | 1379 | $7,889 | $5.72 | 0d | 12 | 0.53mi |
HOA detail condo
- Monthly dues
- $1,904 · $22,848/yr
- Likely covers
- waterdoorman
- Assessments
- None detected in remarks — confirm with the listing agent.
Listing history 29 events
-
2026-06-13status $565,000 Pending 50 DOM
-
2026-06-13days on market $565,000 Active 50 DOM
-
2026-06-12days on market $565,000 Active 49 DOM
-
2026-06-10days on market $565,000 Active 47 DOM
-
2026-06-09days on market $565,000 Active 46 DOM
-
2026-06-08days on market $565,000 Active 45 DOM
-
2026-06-07days on market $565,000 Active 44 DOM
-
2026-06-07days on market $565,000 Active 43 DOM
-
2026-06-04days on market $565,000 Active 41 DOM
-
2026-06-03days on market $565,000 Active 40 DOM
-
2026-06-02days on market $565,000 Active 39 DOM
-
2026-06-01days on market $565,000 Active 38 DOM
-
2026-05-31days on market $565,000 Active 37 DOM
-
2026-04-24$565,000 Active
-
2013-09-30soldstatus $368,000 Sold
-
2013-09-16status Pending Inspection
-
2013-09-09status Active
-
2013-09-09historical Expired
-
2013-08-30price $374,900
-
2013-08-02price $414,000
-
2013-07-05price $439,900
-
2013-06-12$453,000 Active
-
2006-08-29soldstatus $475,000 Closed
-
2006-08-29soldstatus $475,000
-
2006-07-18historical
-
2006-06-13price $478,950
-
2006-04-14$479,000
-
1997-09-25soldstatus $210,000
-
1989-02-14soldstatus $160,000
ⓘ Source: listings_history table (triggers on properties + properties_extension) + one-shot
backfill from property_details.listing_events for pre-trigger history.
Tax reassessment forecast WA · Resets to sale price
- Current annual tax
- $6,387 · $532/mo
- Projected year-2 tax
- $6,387 · $532/mo
- Expected delta
- $0/yr ($0/mo · 0.0%)
ⓘ Screening estimate from a state-policy table — verify with the county assessor before closing.
Climate risk First Street
- Flood 1/10 Low FEMA zone X (unshaded) · 0% chance over 30 yrs
- Wildfire 1/10 Low
- Heat 3/10 Moderate 7 d/yr ≥86°F today · 15 d/yr by 30 yrs out
- Wind 1/10 Low
- Air quality 7/10 Severe 11 unhealthy d/yr today · 11 by 30 yrs out
Nearby sold comps map
Loading sold comps map…
Walkable amenities ~0.75 mi
Loading nearby amenities…
Taxation est. · year 1
- Rental income
- $58,809
- − Mortgage interest
- −$31,649
- − Property taxes
- −$6,387
- − Insurance
- −$2,825
- − Repairs & maintenance
- −$4,705
- − Management
- −$4,705
- − HOA
- −$22,848
- − Depreciation
- −$16,436
- Taxable loss
- −$30,745
- Est. tax savings @ 24.0%
- +$7,379
- After-tax cash flow
- $-13,777/yr
For passive investors: Depreciation is non-cash, so a rental often shows a tax loss while cash-flowing — sheltering income. Rental losses are passive: they offset passive income freely, and up to $25,000/yr can offset ordinary (W-2) income if you actively participate and your MAGI is under $100k (phasing out to $0 by $150k); unused losses carry forward. On sale, claimed depreciation is recaptured at up to 25%, and gains may owe capital-gains tax (a 1031 exchange can defer both). Figures are a year-1 estimate at your 24.0% rate — not tax advice; consult a CPA.
Schools (NCES district)
- District
- Seattle Public Schools
- NCES district ID
- 5307710
- Math proficiency
- 64% ▼ -1.00%
- Reading proficiency
- 72% ▬ 0.00%
- Median HH income
- $68,695
- Composite
- 60.76/100
- National rank
- #1649
- State rank
- #19 of 291 in WA
Livability — Seattle
- Score
- 75/100
- State rank
- #166
- US rank
- #4033
Category grades
Schools grade is shown separately in the Schools card above.
Census & demographics
- Census place
- Seattle, WA
- County
- King County · 2,251,916 people
- City population
- 706,262
- Metro
- Seattle-Tacoma-Bellevue, WA
- Population (ZIP)
- 17,153
- Household income
- $128,882
- Rent vs Own
- Severe rent burden
- 1840.0
Population outlook (King County) Hauer SSP2
- Today (2025)
- 2,576,485 people
- By 2030
- 2,803,316 · +8.8%
- By 2040
- 3,255,921 · +26.4%
- By 2050
- 3,706,444 · +43.9%
- By 2075
- 4,746,063 · +84.2%
- By 2100
- 5,407,730 · +109.9%
Race, ethnicity, and origin ACS 2023
- Neighborhood character
- Diverse neighborhood (Simpson 0.64)
- Race & ethnicity
- White 48% Asian 35% Two or more races 7% Black 6% Hispanic / Latino 5%
- Hispanic origin (detail)
- Mexican 4%
- Common ancestry
- Italian 2% Slovak 2% Lithuanian 1%
- Foreign-born
- 38% · China, Canada, South Korea
- Languages at home
- 67% English-only · Other Indo-European 10% Chinese 8% Spanish 4%
Political lean MEDSL · King
- 2024 margin
- Solid D (+51.7) · D 74.2% · R 22.5% · Other 3.4%
- 2008→2024 swing
- +9.6pp toward D · 2008: 42.1pp · 2024: 51.7pp
- All cycles
- 2024: D+51.7 2020: D+52.7 2016: D+50.4 2012: D+39.9 2008: D+42.1
Not yet ingested
- Civics
- —
Market trends
- HPI YoY
- ▼ -0.52%
- Current HPI
- 193.0062
- Rent YoY
- ▼ -0.28%
- Metro
- Seattle-Tacoma-Bellevue, WA
- State GDP YoY
- ▲ 4.65%
- F500 in state
- 22
Industry mix (Fortune 500 HQ in WA)
| Industry | F500 HQs | Revenue |
|---|---|---|
| Retail | 2 | $269B |
|
||
| Technology / Retail | 1 | $638B |
|
||
| Technology | 1 | $245B |
|
||
| Telecommunications | 1 | $38B |
|
||
| Food / Beverage | 1 | $36B |
|
||
| Automotive / Trucks | 1 | $34B |
|
||
Price history
+253.1% since first listed17 events — show timeline
- 2026-06-13 Pending — NWMLS as Distributed by MLS Grid
- 2026-04-24 Listed $565,000 NWMLS as Distributed by MLS Grid
- 2013-09-30 Sold (MLS) $368,000 NWMLS as Distributed by MLS Grid
- 2013-09-16 Pending — NWMLS as Distributed by MLS Grid
- 2013-09-09 Relisted — NWMLS as Distributed by MLS Grid
- 2013-09-09 Delisted — NWMLS as Distributed by MLS Grid
- 2013-08-30 Price Changed $374,900 NWMLS as Distributed by MLS Grid
- 2013-08-02 Price Changed $414,000 NWMLS as Distributed by MLS Grid
- 2013-07-05 Price Changed $439,900 NWMLS as Distributed by MLS Grid
- 2013-06-12 Listed $453,000 NWMLS as Distributed by MLS Grid
- 2006-08-29 Sold (Public Records) $475,000 Public Records
- 2006-08-29 Sold (MLS) $475,000 NWMLS as Distributed by MLS Grid
- 2006-07-18 Delisted — NWMLS as Distributed by MLS Grid
- 2006-06-13 Price Changed $478,950 NWMLS as Distributed by MLS Grid
- 2006-04-14 Listed $479,000 NWMLS as Distributed by MLS Grid
- 1997-09-25 Sold (Public Records) $210,000 Public Records
- 1989-02-14 Sold (Public Records) $160,000 Public Records
Property tax history
+3.0%/yrLatest (2025): $6,387 · -3.4% YoY. Source: county tax records.
Cash-flow waterfall
monthlySold comps — $/sqft
last 12 mo · ≤1 miLoading sold comps…