95 Shannon Ln · Counce, TN
Flood risk 1/10 · Minimal
- FEMA flood zone
- X (unshaded)
- Chance of flooding over 30 yrs
- 0.0%
- Est. flood insurance / yr
- $507 – $1,088
Fire risk 3/10 · Minor
- Est. fire insurance / yr
- $949 – $1,763
Heat risk 6/10 · Moderate
- Hot days now (above 108°F)
- 7 days/yr
- Hot days in 30 yrs
- 20 days/yr
Wind risk 4/10 · Minor
- Chance of severe wind over 30 yrs
- 18.0%
Air-quality risk 1/10 · Minimal
- Unhealthy air days now
- 0 days/yr
- Unhealthy air days in 30 yrs
- 0 days/yr
Risk factors via First Street. Map © Google.
Why this score? — see what drove the D- grade
The composite is a weighted blend of 9 inputs, each scored 0–100. Each bar is that input's sub-score; the figure is the points it added to the 100-point composite (weight × sub-score).
- Appreciation +10.0/10.0
- Cash flow +7.7/30.0
- ARV discount +7.5/15.0
- Rent growth +2.5/5.0
- Livability +2.5/5.0
- Condition / age +2.5/5.0
- 1% rule +2.3/10.0
- Schools +2.3/10.0
- DSCR +1.8/10.0
$274,900
🖨 Deal sheet 📄 Offer letter ✓ Due diligence
Listing remarks MLS
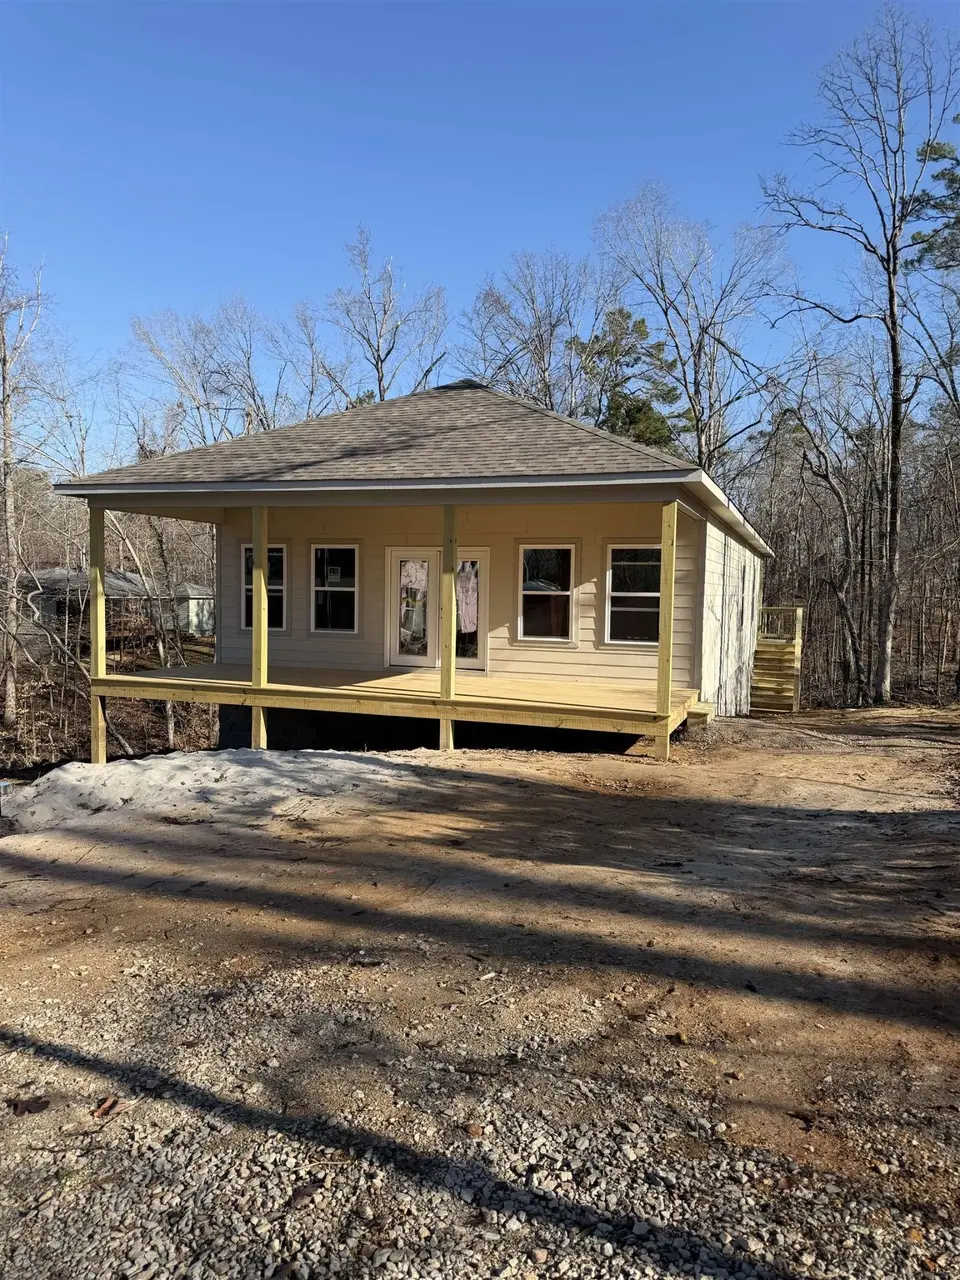
This one level 3br 2bath home under construction is located in the heart of Pickwick just minutes from all the amenities. The exterior includes covered front porch, screened rear porch overlooking the wooded terrain with concrete drive. Inside you will find an open concept with granite counter tops, shaker cabinets, stainless appliances, LVP flooring throughout, gas fire place walk-in laundry/pantry, and a tile shower in the primary bedroom.
Key facts
- Covered front porch
- Stainless appliances
- Screened rear porch
Tags
Neighborhood map
What this means for you Summary
Snapshot
- This is a 3-bed/2.0-bath single-family listed at $275k.
Deal economics
- At list price, monthly cash flow is $-320 ($-4k/yr) — negative.
- To cash-flow at today's rent, offer at most $229k (16.8% below list).
- To meet the 1% rule (rent ≥ 1% of price), the offer needs to be $200k (27.2% below list).
- Recommended offer: $200k (27.2% below list) — sets the bar for 1% rule.
- Cap rate 4.9% vs local median 2.5% in Counce — top-decile yield for the area; either an underpriced asset or a hidden risk that comps aren't pricing in. Stress-test before assuming the spread holds.
Location & tenants
- Location reads: area grade D — affects rentability + tenant quality, not the cash-flow math above.
- Hardin County (rural): math 27% / reading 28% proficiency, ranked #76 of 139 in TN (top 55%) — low school quality limits family demand, transient renter base, plan for 1-2y turnover.
- Market conditions: 385 active listings in the ZIP; 1 comparable units currently listed for rent nearby; 24 units permitted in Hardin County in 2024 (0 in 5+ unit buildings).
Forward outlook
- In year one you build about $29k of equity ($2k loan paydown + $27k appreciation (10.0% local appreciation)).
- Hardin County population projected at -17% by 2050 — secular population decline; favor cash flow + early exit over multi-decade hold.
- By year 2, paydown + projected appreciation supports a ~$47k cash-out refi (75% LTV) — recoverable capital for the next deal without selling this one.
Negotiation context
- It's been on market 102 days — a 9% lower offer ($250k) is reasonable based on typical stale-listing flexibility.
- 2 sale attempts with the ask held roughly flat each time — persistent listings suggest the price (not the market) is what's stuck; bring a comps-based counter.
Risks & watch-outs
- Climate carrying-cost: extreme-heat days projected 7→20/yr by 2055 (HVAC capex compounding) — expect insurance premiums to compound above CPI over the hold.
Questions for the listing agent
- What do current leases actually rent for vs. the listed asking? Can we see a recent rent roll and the last 12 months of T-12 income?
- It's been on market 102 days. Have you received any prior offers? Is the seller open to a 27% concession, seller financing, or rate buy-down credit?
- Why hasn't it sold? Are there any deal-killer items the seller is aware of (foundation, flood, title, zoning, code violations)?
- Is there a deadline driving the sale (1031 exchange, divorce, estate, relocation)? That informs how much negotiation room exists.
- The area grade is low — what's the realistic commute time and amenity access for the typical tenant pool here? Any planned neighborhood developments (good or bad) we should know about?
- What's the average days-on-market for RENTAL listings here right now (not sales)? A rising rental-DOM trend means longer vacancies and softer asking-rent achievability than the comps imply.
- What's the recent tenant-quality profile in this submarket — average credit score on applications, eviction rate, late-payment / NSF rate, and stable-employment percentage? A property-management company in the area should have these aggregated.
- How much new for-sale + rental construction is in the pipeline within 1–3 miles? Heavy new supply typically softens prices + rents 12–24 months out; constrained supply supports both.
Investment metrics
- 1% rule
- 0.73% ✗
- Cap rate
- 4.90%
- Cash-on-cash
- -4.99%
- DSCR
- 0.78
- GRM
- 11.5
CMA / ARV
No comps found within radius.
Projected returns pro-forma
10.0% appreciation · 3.0% rent growth · sell at horizon
- IRR
- 20.7%
- Equity multiple
- 2.68×
- Total profit
- $129,382
- Equity at exit
- $247,652
- IRR
- 18.9%
- Equity multiple
- 6.16×
- Total profit
- $397,083
- Equity at exit
- $534,070
Cash invested: $76,972 (down + closing). Projections, not guarantees.
Landlord ↔ Tenant lean methodology
- Overall (STATE)
- 87 Strongly Landlord-Friendly
- State Tennessee
- 87 Strongly Landlord-Friendly · R+13
- County
- — inherits STATE
- City
- — inherits STATE
ZIP-level market 38372
- Home prices YoY
- 5.5%
- Active inventory
- 385
- Price-to-rent
- 11.5×
Monthly cashflow live
- Estimated rent
- $2,000 medium interval (Pro) →
- Mortgage (P&I)
- −$1,442
- Tax est. 1.5%
- −$344 /mo · $4,124/yr
- Insurance
- −$115
- HOA
- −$0
- Vacancy / Maint / Mgmt
- −$420
- Net cashflow
- $-320
Break-even live
UW: 25.0% down · 7.5% · 30yr · 1.5% tax · 5.0% vac · 8.0% maint · 8.0% mgmt
Financing live
Cash to close
- Down payment
- $68,725
- Closing costs
- $8,247
- Reserves months
- —
- Total cash needed
- —
Loan-product check · same deal, 3 products live
Conventional
25% down · 7.5% · 30yr
- Down + closing
- —
- Monthly P&I
- —
- Monthly cashflow
- —
- DSCR
- —
- Eligible?
- —
Personal DTI + credit; lowest rate.
DSCR
20% down · 8.5% · 30yr
- Down + closing
- —
- Monthly P&I
- —
- Monthly cashflow
- —
- DSCR
- —
- Eligible?
- —
No personal income docs; deal must DSCR.
Hard money
10% down · 12.0% · 12mo
- Down + closing
- —
- Monthly P&I
- —
- Monthly cashflow
- —
- DSCR
- —
- Eligible?
- —
Short-term bridge; refi at stabilization.
Rent comps 1 comps
| Address | Beds | Baths | Sqft | Rent | $/sqft | DOM | Units | Dist |
|---|---|---|---|---|---|---|---|---|
| 221 Saint Andrews Ct Counce, TN | 3.0 | 3.0 | 1721 | $2,000 | $1.16 | 43d | 1 | 1.14mi |
Listing history 2 events
-
2026-02-17$274,900 Active 445-char remark
Show marketing remark (445 chars)
This one level 3br 2bath home under construction is located in the heart of Pickwick just minutes from all the amenities. The exterior includes covered front porch, screened rear porch overlooking the wooded terrain with concrete drive. Inside you will find an open concept with granite counter tops, shaker cabinets, stainless appliances, LVP flooring throughout, gas fire place walk-in laundry/pantry, and a tile shower in the primary bedroom.
ⓘ Source: listings_history table (triggers on properties + properties_extension) + one-shot
backfill from property_details.listing_events for pre-trigger history.
Climate risk First Street
- Flood 1/10 Low FEMA zone X (unshaded) · 0% chance over 30 yrs
- Wildfire 3/10 Moderate
- Heat 6/10 Major 7 d/yr ≥108°F today · 20 d/yr by 30 yrs out
- Wind 4/10 Moderate 18% chance of damaging wind over 30 yrs
- Air quality 1/10 Low 0 unhealthy d/yr today · 0 by 30 yrs out
Nearby sold comps map
Loading sold comps map…
Walkable amenities ~0.75 mi
Loading nearby amenities…
Taxation est. · year 1
- Rental income
- $24,000
- − Mortgage interest
- −$15,399
- − Property taxes
- −$4,124
- − Insurance
- −$1,374
- − Repairs & maintenance
- −$1,920
- − Management
- −$1,920
- − Depreciation
- −$7,997
- Taxable loss
- −$8,734
- Est. tax savings @ 24.0%
- +$2,096
- After-tax cash flow
- $-1,741/yr
For passive investors: Depreciation is non-cash, so a rental often shows a tax loss while cash-flowing — sheltering income. Rental losses are passive: they offset passive income freely, and up to $25,000/yr can offset ordinary (W-2) income if you actively participate and your MAGI is under $100k (phasing out to $0 by $150k); unused losses carry forward. On sale, claimed depreciation is recaptured at up to 25%, and gains may owe capital-gains tax (a 1031 exchange can defer both). Figures are a year-1 estimate at your 24.0% rate — not tax advice; consult a CPA.
Schools (NCES district)
- District
- Hardin County
- NCES district ID
- 4701680
- Math proficiency
- 27% ▼ -1.00%
- Reading proficiency
- 28% ▼ -1.00%
- Median HH income
- $34,404
- Composite
- 22.64/100
- National rank
- #8061
- State rank
- #76 of 139 in TN
Livability — Counce
No livability data for this city. (Only ~50 U.S. cities are tracked.)
Census & demographics
- Population (ZIP)
- 17,659
Population outlook (Hardin County) Hauer SSP2
- Today (2025)
- 24,740 people
- By 2030
- 23,971 · -3.1%
- By 2040
- 22,284 · -9.9%
- By 2050
- 20,612 · -16.7%
- By 2075
- 17,072 · -31.0%
- By 2100
- 13,723 · -44.5%
Race, ethnicity, and origin ACS 2023
- Neighborhood character
- Predominantly White (89%)
- Race & ethnicity
- White 89% Two or more races 5% Black 3% Hispanic / Latino 3%
- Common ancestry
- Italian 5% Slovak 2% Danish 2%
- Foreign-born
- 1% · Canada
- Languages at home
- 97% English-only · Spanish 2% German/W. Germanic 1%
Political lean MEDSL · Hardin
- 2024 margin
- Solid R (+71.0) · D 14.1% · R 85.1%
- 2008→2024 swing
- -28.3pp toward R · 2008: -42.7pp · 2024: -71.0pp
- All cycles
- 2024: R+71.0 2020: R+67.5 2016: R+64.2 2012: R+51.6 2008: R+42.7
Not yet ingested
- Civics
- —
Market trends
- HPI YoY
- ▲ 15.20%
- Current HPI
- 293.51
- Rent YoY
- —
- Metro
- —
- State GDP YoY
- ▲ 2.78%
- F500 in state
- 22
Industry mix (Fortune 500 HQ in TN)
| Industry | F500 HQs | Revenue |
|---|---|---|
| Healthcare | 3 | $91B |
|
||
| Retail | 3 | $72B |
|
||
| Transportation / Logistics | 1 | $88B |
|
||
| Paper / Packaging | 1 | $19B |
|
||
| Insurance | 1 | $13B |
|
||
| Energy | 1 | $12B |
|
||
Price history
+0.0% since first listed2 events — show timeline
- 2026-02-17 Listed $274,900 REALTRACS as Distributed by MLS Grid
- 2026-02-17 Listed $274,900 Memphis Area Association of Realtors(R) MLS
Cash-flow waterfall
monthlySold comps — $/sqft
last 12 mo · ≤1 miLoading sold comps…