8282 Park Place Blvd Unit G2 · Houston, TX
Flood risk 4/10 · Minor
- FEMA flood zone
- X (unshaded)
- Chance of flooding over 30 yrs
- 0.22%
- Est. flood insurance / yr
- $507 – $1,088
Fire risk 1/10 · Minimal
- Est. fire insurance / yr
- $1,222 – $2,270
Heat risk 9/10 · Severe
- Hot days now (above 109°F)
- 7 days/yr
- Hot days in 30 yrs
- 24 days/yr
Wind risk 9/10 · Severe
- Chance of severe wind over 30 yrs
- 99.0%
Air-quality risk 2/10 · Minimal
- Unhealthy air days now
- 2 days/yr
- Unhealthy air days in 30 yrs
- 2 days/yr
Risk factors via First Street. Map © Google.
Why this score? — see what drove the C+ grade
The composite is a weighted blend of 9 inputs, each scored 0–100. Each bar is that input's sub-score; the figure is the points it added to the 100-point composite (weight × sub-score).
- Cash flow +28.4/30.0
- DSCR +10.0/10.0
- 1% rule +8.2/10.0
- Livability +3.7/5.0
- Rent growth +2.7/5.0
- Schools +2.7/10.0
- Condition / age +2.5/5.0
- ARV discount +1.8/15.0
- Appreciation +0.0/10.0
$79,999
🖨 Deal sheet 📄 Offer letter ✓ Due diligence
Listing remarks MLS
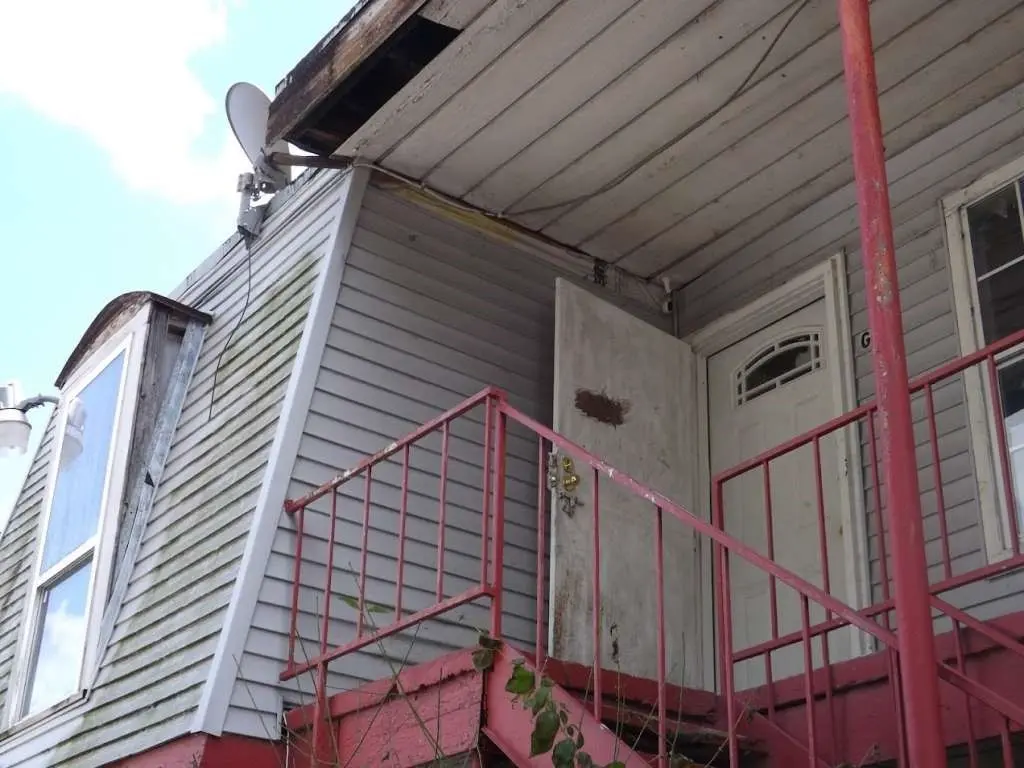
NEAR HOBBY AIRPORT! Located in South Houston, this 2-bedroom, 1.5-bathroom condominium features a full kitchen and washer/dryer connections. Enjoy ceiling fans in the main rooms for added comfort. Conveniently close to the 610 and I-45 freeways, just minutes from Hobby Airport. WE MAKE IT EASY TO OWN. This is a great opportunity! Don't wait, call us today to get more information on the owner's easy terms and smooth process that may be able to put the deed in your name and make this your dream home.
Key facts
- Hobby airport
- Full kitchen
- Close to freeways
Tags
Neighborhood map
What this means for you Summary
Snapshot
- This is a 2-bed/1.0-bath condo listed at $80k.
Deal economics
- At list price, monthly cash flow is $260 ($3k/yr) — positive.
- The deal already cash-flows at list — no discount required.
- Meets the 1% rule at list price ($1k rent vs $80k).
- Recommended offer: $70k (12.0% below list) — sets the bar for market timing.
- Cap rate 10.2% vs local median 3.2% in Houston — top-decile yield for the area; either an underpriced asset or a hidden risk that comps aren't pricing in. Stress-test before assuming the spread holds.
Location & tenants
- Location reads 74/100 on livability (#184 in TX, #4,771 nationally) — a middle-class / working-renter tenant base. Strengths: amenities A+, cost of living A+, housing A+; Watch: schools D, crime F.
- Houston ISD (urban): math 27% / reading 35% proficiency, ranked #593 of 826 in TX (top 72%) — families likely to look elsewhere, expect single-tenant / working-renter base with shorter leases; 71% free/reduced lunch — lower-income household profile, screen leases tightly.
- Market conditions: Rents flat; 88 active listings in the ZIP; 40 comparable units currently listed for rent nearby; rentals at typical pace (median 15d on market — plan ~3-4 weeks tenant-placement turnaround); 29,883 units permitted in Harris County in 2024 (8,621 in 5+ unit buildings).
Forward outlook
- Local home prices are declining (-3.0%/yr); year-one equity from $553 of loan paydown is wiped out by about $2k of value loss. Plan a longer hold.
- Harris County population projected at +47% by 2050 — long-run rental-demand tailwind backs the buy-and-hold thesis.
Negotiation context
- It's been on market 387 days — a 12% lower offer ($70k) is reasonable based on typical stale-listing flexibility.
- Current owner paid $10k; list at $80k implies a 679% gain — meaningful room to come down on a strong offer.
Risks & watch-outs
- Climate carrying-cost: severe wind risk, 99% chance of damaging wind over 30y; extreme-heat days projected 7→24/yr by 2055 (HVAC capex compounding) — expect insurance premiums to compound above CPI over the hold.
Questions for the listing agent
- It's been on market 387 days. Have you received any prior offers? Is the seller open to a 12% concession, seller financing, or rate buy-down credit?
- Built in 1975 — when were the roof, HVAC, electrical panel, plumbing, and water heater last replaced?
- Any open or pending special assessments — roof, HVAC, plumbing, elevator, façade? What's the per-unit balance and payoff schedule, and is the seller paying it off at close or rolling it to the buyer?
- Why hasn't it sold? Are there any deal-killer items the seller is aware of (foundation, flood, title, zoning, code violations)?
- Is there a deadline driving the sale (1031 exchange, divorce, estate, relocation)? That informs how much negotiation room exists.
- Schools are D-rated, which usually means shorter tenancies and higher turnover. Who's the typical renter profile here, and what's been the actual vacancy rate?
- Crime grade is F in this area — have there been break-ins, vandalism, or insurance claims at this property in the last 3 years? What carrier currently insures it and at what premium?
- What's the average days-on-market for RENTAL listings here right now (not sales)? A rising rental-DOM trend means longer vacancies and softer asking-rent achievability than the comps imply.
- What's the recent tenant-quality profile in this submarket — average credit score on applications, eviction rate, late-payment / NSF rate, and stable-employment percentage? A property-management company in the area should have these aggregated.
- How much new apartment / multifamily construction is in the pipeline within 1–3 miles? Heavy new supply (>2% of stock underway) typically softens rents 12–24 months out; light construction supports rent growth.
Investment metrics
- 1% rule
- 1.32% ✓
- Cap rate
- 10.19%
- Cash-on-cash
- 13.91%
- DSCR
- 1.62
- GRM
- 6.3
CMA / ARV
- ARV (median comp)
- $71,027
- List price
- $79,999
- Delta
- 12.63%
- Verdict
- OVERPRICED
- Comps
- 20 within 2.0 mi
Projected returns pro-forma
-3.0% appreciation · 0.88% rent growth · sell at horizon
- IRR
- 1.7%
- Equity multiple
- 1.06×
- Total profit
- $1,391
- Equity at exit
- $11,928
- IRR
- 9.0%
- Equity multiple
- 1.62×
- Total profit
- $13,926
- Equity at exit
- $6,917
Cash invested: $22,400 (down + closing). Projections, not guarantees.
Landlord ↔ Tenant lean methodology
- Overall (STATE)
- 87 Strongly Landlord-Friendly
- State Texas
- 87 Strongly Landlord-Friendly · R+5
- County
- — inherits STATE
- City
- — inherits STATE
ZIP-level market 77017
- Home prices YoY
- -21.7%
- Rents YoY
- 0.9%
- Active inventory
- 88
- Price-to-rent
- 6.3×
Monthly cashflow live
- Estimated rent
- $1,060 high interval (Pro) →
- Mortgage (P&I)
- −$420
- Tax from tax record
- −$125 /mo · $1,498/yr
- Insurance
- −$33
- HOA
- −$0
- Vacancy / Maint / Mgmt
- −$223
- Net cashflow
- $260
Break-even live
UW: 25.0% down · 7.5% · 30yr · 1.5% tax · 5.0% vac · 8.0% maint · 8.0% mgmt
Financing live
Cash to close
- Down payment
- $20,000
- Closing costs
- $2,400
- Reserves months
- —
- Total cash needed
- —
Loan-product check · same deal, 3 products live
Conventional
25% down · 7.5% · 30yr
- Down + closing
- —
- Monthly P&I
- —
- Monthly cashflow
- —
- DSCR
- —
- Eligible?
- —
Personal DTI + credit; lowest rate.
DSCR
20% down · 8.5% · 30yr
- Down + closing
- —
- Monthly P&I
- —
- Monthly cashflow
- —
- DSCR
- —
- Eligible?
- —
No personal income docs; deal must DSCR.
Hard money
10% down · 12.0% · 12mo
- Down + closing
- —
- Monthly P&I
- —
- Monthly cashflow
- —
- DSCR
- —
- Eligible?
- —
Short-term bridge; refi at stabilization.
Rent comps 40 comps
| Address | Beds | Baths | Sqft | Rent | $/sqft | DOM | Units | Dist |
|---|---|---|---|---|---|---|---|---|
| 8357 Park Place Blvd Houston, TX | 1.0 | 1.0 | 739 | $845 | $1.14 | 43d | 1 | 0.22mi |
| 7915 Ithaca St Unit 2 Houston, TX | 2.0 | 1.0 | 600 | $750 | $1.25 | 43d | 1 | 0.69mi |
| 8335 Bonner Dr Houston, TX | 1.0 | 1.0 | 700 | $950 | $1.36 | 43d | 1 | 0.74mi |
| 2724 Broadway St Houston, TX | 1.0 | 1.0 | 680 | $872 | $1.28 | 43d | 7 | 0.82mi |
| 4143 Dover Ave Houston, TX | 2.0 | 1.0 | 880 | $1,065 | $1.21 | 43d | 1 | 0.93mi |
| 7313 Gulf Fwy #907 Houston, TX | 1.0 | 1.0 | 635 | $999 | $1.57 | 15d | 1 | 0.96mi |
| 7581 City Dr Ofc City Houston, TX | 1.0 | 1.0 | 615 | $830 | $1.35 | 43d | 1 | 1.20mi |
| 8445 Winkler Dr Houston, TX | 1.0 | 1.0 | 704 | $800 | $1.14 | 24d | 1 | 1.22mi |
| 7950 Bellfort St Houston, TX | 1.0–2.0 | 1.0–2.0 | 796 | $1,142 | $1.43 | 1d | 15 | 1.26mi |
| 8535 Winkler Dr Houston, TX | 2.0 | 1.0 | 874 | $900 | $1.03 | 43d | 1 | 1.32mi |
| 4800 Allendale Rd Houston, TX | 1.0 | 1.0 | 1003 | $1,043 | $1.04 | 18d | 1 | 1.33mi |
| 4800 Allendale Rd Unit 1162 Houston, TX | 1.0 | 1.0 | 1003 | $1,004 | $1.00 | 5d | 1 | 1.35mi |
| 4800 Allendale Rd Unit 4821 Houston, TX | 1.0 | 1.0 | 1003 | $1,039 | $1.04 | 14d | 1 | 1.35mi |
| 4800 Allendale Rd Apt 321 Houston, TX | 1.0 | 1.0 | 1003 | $1,004 | $1.00 | 7d | 1 | 1.35mi |
| 4800 Allendale Rd Unit 4851 Houston, TX | 1.0 | 1.0 | 1003 | $1,019 | $1.02 | 43d | 1 | 1.35mi |
| 4800 Allendale Rd Unit 1187 Houston, TX | 1.0 | 1.0 | 1003 | $1,001 | $1.00 | 3d | 1 | 1.35mi |
| 4800 Allendale Rd Unit 4821 Houston, TX | 1.0 | 1.0 | 1003 | $1,043 | $1.04 | 10d | 1 | 1.35mi |
| 4807 Allendale Rd Houston, TX | 1.0 | 1.0 | 600 | $775 | $1.29 | 43d | 1 | 1.36mi |
| 4800 Allendale Rd Unit 1047 Houston, TX | 1.0 | 1.0 | 1003 | $1,044 | $1.04 | 11d | 1 | 1.36mi |
| 3505 Evergreen Dr Houston, TX | 2.0 | 2.0 | 974 | $1,150 | $1.18 | 18d | 1 | 1.40mi |
| 3505 Evergreen Dr Houston, TX | 2.0 | 2.0 | 974 | $1,150 | $1.18 | 19d | 1 | 1.40mi |
| 7901 Leonora St Houston, TX | 1.0–2.0 | 1.0 | 750 | $1,245 | $1.66 | 5d | 10 | 1.42mi |
| 7661 Bellfort Ave Houston, TX | 2.0 | 2.0 | 930 | $1,349 | $1.45 | 20d | 1 | 1.45mi |
| 7661 Bellfort Ave Houston, TX | 1.0 | 1.0 | 650 | $1,099 | $1.69 | 24d | 1 | 1.45mi |
| 7661 Bellfort Ave Houston, TX | 1.0 | 1.0 | 650 | $1,099 | $1.69 | 43d | 1 | 1.45mi |
| 8101 Leonora St Houston, TX | 1.0–2.0 | 1.0–2.0 | 975 | $1,300 | $1.33 | 2d | 4 | 1.47mi |
| 8625 Winkler Dr Unit 422 Houston, TX | 2.0 | 2.0 | 787 | $1,096 | $1.39 | 10d | 1 | 1.47mi |
| 8625 Winkler Dr Unit 8646 Houston, TX | 1.0 | 1.0 | 616 | $923 | $1.50 | 14d | 1 | 1.47mi |
| 8625 Winkler Dr Unit 2-2125 Houston, TX | 2.0 | 1.0 | 787 | $1,082 | $1.37 | 24d | 1 | 1.47mi |
| 8625 Winkler Dr Unit 8699 Houston, TX | 1.0 | 1.0 | 616 | $927 | $1.50 | 10d | 1 | 1.47mi |
| 2522 Patricia Manor Pl Unit 2162 Houston, TX | 2.0 | 2.0 | 714 | $911 | $1.28 | 7d | 1 | 1.49mi |
| 2522 Patricia Manor Pl Unit 1162 Houston, TX | 1.0 | 1.0 | 560 | $773 | $1.38 | 7d | 1 | 1.49mi |
| 2522 Patricia Manor Pl Unit 2573 Houston, TX | 1.0 | 1.0 | 560 | $762 | $1.36 | 12d | 1 | 1.49mi |
| 2522 Patricia Manor Pl Unit 2596 Houston, TX | 1.0 | 1.0 | 560 | $770 | $1.38 | 3d | 1 | 1.49mi |
| 2522 Patricia Manor Pl Unit 2596 Houston, TX | 1.0 | 1.0 | 560 | $808 | $1.44 | 14d | 1 | 1.49mi |
| 2522 Patricia Manor Pl Unit 510 Houston, TX | 3.0 | 2.0 | 924 | $1,039 | $1.12 | 3d | 1 | 1.49mi |
| 8625 Winkler Dr Houston, TX | 1.0–2.0 | 1.0 | 701 | $1,310 | $1.87 | 15d | 17 | 1.49mi |
| 8625 Winkler Dr Houston, TX | 1.0–2.0 | 1.0 | 701 | $1,310 | $1.87 | 1d | 16 | 1.49mi |
| 8625 Winkler Dr Houston, TX | 1.0 | 1.0 | 616 | $885 | $1.44 | 16d | 1 | 1.49mi |
| 2325 Coral St Houston, TX | 2.0 | 1.0 | 714 | $850 | $1.19 | 22d | 1 | 1.50mi |
HOA detail condo
- Monthly dues
- $0 · $0/yr
- Assessments
- None detected in remarks — confirm with the listing agent.
Listing history 17 events
-
2026-06-18days on market $79,999 Active 387 DOM
-
2026-06-17days on market $79,999 Active 386 DOM
-
2026-06-16days on market $79,999 Active 385 DOM
-
2026-06-15days on market $79,999 Active 384 DOM
-
2026-06-13days on market $79,999 Active 382 DOM
-
2026-06-10days on market $79,999 Active 378 DOM
-
2026-06-08days on market $79,999 Active 377 DOM
-
2026-06-07days on market $79,999 Active 376 DOM
-
2026-06-04days on market $79,999 Active 373 DOM
-
2026-06-01days on market $79,999 Active 370 DOM
-
2026-05-31days on market $79,999 Active 369 DOM
-
2025-11-21price $79,999 503-char remark
Show marketing remark (503 chars)
NEAR HOBBY AIRPORT! Located in South Houston, this 2-bedroom, 1.5-bathroom condominium features a full kitchen and washer/dryer connections. Enjoy ceiling fans in the main rooms for added comfort. Conveniently close to the 610 and I-45 freeways, just minutes from Hobby Airport. WE MAKE IT EASY TO OWN. This is a great opportunity! Don't wait, call us today to get more information on the owner's easy terms and smooth process that may be able to put the deed in your name and make this your dream home.
-
2025-05-27$84,999 Active 503-char remark
Show marketing remark (503 chars)
NEAR HOBBY AIRPORT! Located in South Houston, this 2-bedroom, 1.5-bathroom condominium features a full kitchen and washer/dryer connections. Enjoy ceiling fans in the main rooms for added comfort. Conveniently close to the 610 and I-45 freeways, just minutes from Hobby Airport. WE MAKE IT EASY TO OWN. This is a great opportunity! Don't wait, call us today to get more information on the owner's easy terms and smooth process that may be able to put the deed in your name and make this your dream home.
-
2015-08-04soldstatus
-
2014-07-07soldstatus
-
1991-01-02soldstatus
-
1990-12-26soldstatus $10,270
ⓘ Source: listings_history table (triggers on properties + properties_extension) + one-shot
backfill from property_details.listing_events for pre-trigger history.
Tax reassessment forecast TX · Resets to sale price
- Current annual tax
- $1,498 · $125/mo
- Projected year-2 tax
- $1,498 · $125/mo
- Expected delta
- $0/yr ($0/mo · 0.0%)
ⓘ Screening estimate from a state-policy table — verify with the county assessor before closing.
Climate risk First Street
- Flood 4/10 Moderate FEMA zone X (unshaded) · 22% chance over 30 yrs
- Wildfire 1/10 Low
- Heat 9/10 Extreme 7 d/yr ≥109°F today · 24 d/yr by 30 yrs out
- Wind 9/10 Extreme 99% chance of damaging wind over 30 yrs
- Air quality 2/10 Low 2 unhealthy d/yr today · 2 by 30 yrs out
Nearby sold comps map
Loading sold comps map…
Walkable amenities ~0.75 mi
Loading nearby amenities…
Taxation est. · year 1
- Rental income
- $12,719
- − Mortgage interest
- −$4,481
- − Property taxes
- −$1,498
- − Insurance
- −$400
- − Repairs & maintenance
- −$1,017
- − Management
- −$1,017
- − Depreciation
- −$2,327
- Taxable income
- $1,978
- Est. tax owed @ 24.0%
- −$475
- After-tax cash flow
- $2,641/yr
For passive investors: Depreciation is non-cash, so a rental often shows a tax loss while cash-flowing — sheltering income. Rental losses are passive: they offset passive income freely, and up to $25,000/yr can offset ordinary (W-2) income if you actively participate and your MAGI is under $100k (phasing out to $0 by $150k); unused losses carry forward. On sale, claimed depreciation is recaptured at up to 25%, and gains may owe capital-gains tax (a 1031 exchange can defer both). Figures are a year-1 estimate at your 24.0% rate — not tax advice; consult a CPA.
Schools (NCES district)
- District
- Houston ISD
- NCES district ID
- 4823640
- Math proficiency
- 27% ▼ -18.00%
- Reading proficiency
- 35% ▼ -6.00%
- Median HH income
- $46,054
- Composite
- 26.63/100
- National rank
- #7173
- State rank
- #593 of 826 in TX
Livability — Houston
- Score
- 74/100
- State rank
- #184
- US rank
- #4771
Category grades
Schools grade is shown separately in the Schools card above.
Census & demographics
- Census place
- Houston, TX
- County
- Harris County · 4,702,590 people
- City population
- 3,226,434
- Metro
- Houston-The Woodlands-Sugar Land, TX
- Population (ZIP)
- 29,640
- Household income
- $51,079
- Rent vs Own
- Severe rent burden
- 1601.0
Population outlook (Harris County) Hauer SSP2
- Today (2025)
- 5,571,493 people
- By 2030
- 6,089,821 · +9.3%
- By 2040
- 7,142,806 · +28.2%
- By 2050
- 8,185,864 · +46.9%
- By 2075
- 10,574,329 · +89.8%
- By 2100
- 12,109,958 · +117.4%
Race, ethnicity, and origin ACS 2023
- Neighborhood character
- Predominantly Hispanic (81%)
- Race & ethnicity
- Hispanic / Latino 81% Two or more races 38% White 7% Black 6% Asian 4%
- Hispanic origin (detail)
- Mexican 65%
- Common ancestry
- Lithuanian 1%
- Foreign-born
- 39% · Canada, Vietnam
- Languages at home
- 32% English-only · Spanish 63% Vietnamese 4%
Political lean MEDSL · Harris
- 2024 margin
- Lean D (+5.5) · D 52.0% · R 46.4% · Other 1.6%
- 2008→2024 swing
- +3.9pp toward D · 2008: 1.6pp · 2024: 5.5pp
- All cycles
- 2024: D+5.5 2020: D+13.3 2016: D+12.4 2012: D+0.1 2008: D+1.6
Not yet ingested
- Civics
- —
Market trends
- HPI YoY
- ▼ -76.86%
- Current HPI
- 277.3656
- Rent YoY
- ▲ 0.88%
- Metro
- Houston-The Woodlands-Sugar Land, TX
- State GDP YoY
- ▲ 3.95%
- F500 in state
- 110
Industry mix (Fortune 500 HQ in TX)
| Industry | F500 HQs | Revenue |
|---|---|---|
| Energy | 16 | $1,198B |
|
||
| Technology | 5 | $198B |
|
||
| Engineering / Construction | 4 | $72B |
|
||
| Energy Services | 3 | $60B |
|
||
| Utilities | 3 | $41B |
|
||
| Healthcare | 2 | $330B |
|
||
Price history
+679.0% since first listed6 events — show timeline
- 2025-11-21 Price Changed $79,999 HARMLS
- 2025-05-27 Listed $84,999 HARMLS
- 2015-08-04 Sold (Public Records) — Public Records
- 2014-07-07 Sold (Public Records) — Public Records
- 1991-01-02 Sold (Public Records) — Public Records
- 1990-12-26 Sold (Public Records) $10,270 Public Records
Property tax history
+11.6%/yrLatest (2025): $1,498 · +3.8% YoY. Source: county tax records.
Cash-flow waterfall
monthlySold comps — $/sqft
last 12 mo · ≤1 miLoading sold comps…