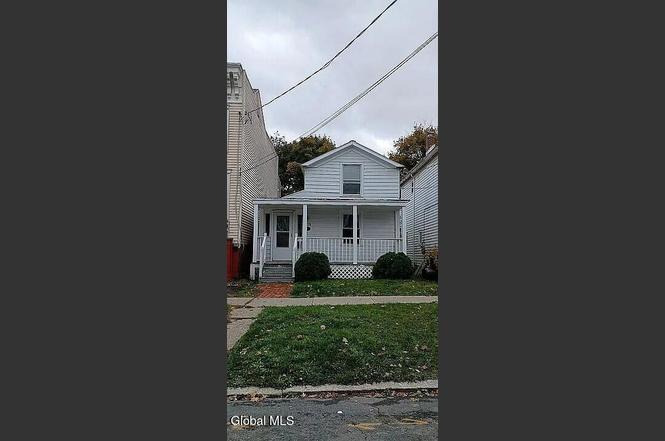
252 Yates St · Albany, NY
Flood risk 1/10 · Minimal
- FEMA flood zone
- X (unshaded)
- Chance of flooding over 30 yrs
- 0.0%
- Est. flood insurance / yr
- $473 – $860
Fire risk 1/10 · Minimal
- Est. fire insurance / yr
- $691 – $1,283
Heat risk 4/10 · Minor
- Hot days now (above 97°F)
- 7 days/yr
- Hot days in 30 yrs
- 16 days/yr
Wind risk 3/10 · Minor
- Chance of severe wind over 30 yrs
- 6.0%
Air-quality risk 1/10 · Minimal
- Unhealthy air days now
- 0 days/yr
- Unhealthy air days in 30 yrs
- 0 days/yr
Risk factors via First Street. Map © Google.
Why this score? — see what drove the C+ grade
The composite is a weighted blend of 9 inputs, each scored 0–100. Each bar is that input's sub-score; the figure is the points it added to the 100-point composite (weight × sub-score).
- Cash flow +28.4/30.0
- DSCR +10.0/10.0
- 1% rule +9.0/10.0
- Livability +4.0/5.0
- Rent growth +3.8/5.0
- Schools +3.2/10.0
- ARV discount +2.5/15.0
- Condition / age +2.5/5.0
- Appreciation +0.0/10.0
$145,900
🖨 Deal sheet (PDF) 📄 Offer letter ✓ Due diligence
Listing remarks
Move-in ready! Multiple Offers! This bright, refreshed single-family home delivers a new roof, newer furnace, new flooring, and new windows--all the big-ticket items already done. Minutes from Albany Med, St. Peter's, and downtown, it's perfect for anyone who wants convenience and zero hassle. Easy to show and ready to impress! More Pictures to come!
Key facts
- Newer furnace
- New flooring
- New roof
Tags
Neighborhood map
What this means for you Summary
Snapshot
- This is a 4-bed/1.5-bath single-family listed at $146k.
Deal economics
- At list price, monthly cash flow is $471 ($6k/yr) — positive.
- The deal already cash-flows at list — no discount required.
- Meets the 1% rule at list price ($2k rent vs $146k).
- Recommended offer: $142k (3.0% below list) — sets the bar for market timing.
- Cap rate 10.2% vs local median 5.7% in Albany — top-decile yield for the area; either an underpriced asset or a hidden risk that comps aren't pricing in. Stress-test before assuming the spread holds.
Location & tenants
- Location reads 79/100 on livability (#129 in NY, #2,083 nationally) — a middle-class / working-renter tenant base. Strengths: amenities A+, commute A+, housing A+; Watch: employment C-, crime F.
- Albany City School District (urban): math 37% / reading 40% proficiency, ranked #543 of 590 in NY (top 92%) — families likely to look elsewhere, expect single-tenant / working-renter base with shorter leases; 66% free/reduced lunch — lower-income household profile, screen leases tightly.
- Zoned schools: Albany High School (math 74% / reading 67%, grade B+, #710 of 1,100 statewide, top 65%, 2,676 students, 69% FRL) — zoned schools at 69% FRL track the district average.
- Zoned-school proficiency averages 70% at this address vs 38% district-wide (+32 pts) — the actual schools serving this property are materially stronger than the Albany City School District average implies; a family-tenant draw the district grade alone would hide.
- Market conditions: Rents rising fast (+5.0%/yr); 99 active listings in the ZIP; 21 comparable units currently listed for rent nearby; rentals at typical pace (median 24d on market — plan ~3-4 weeks tenant-placement turnaround); 43% of comp listings sitting > 30 days — soft ceiling on asking rent; 675 units permitted in Albany County in 2024 (451 in 5+ unit buildings).
Forward outlook
- Local home prices are declining (-3.0%/yr); year-one equity from $1k of loan paydown is wiped out by about $4k of value loss. Plan a longer hold.
- Albany County population projected at +9% by 2050 — modest demand growth; plan on rents tracking national, not racing it.
- At projected returns (-3.0% appreciation + 5.0% rent growth), your $41k cash investment doubles in ~8 years — after that, you're playing with house money.
Negotiation context
- It's been on market 47 days — a 3% lower offer ($142k) is reasonable based on typical stale-listing flexibility.
- 13 sale attempts since 24y ago with the ask held roughly flat each time — persistent listings suggest the price (not the market) is what's stuck; bring a comps-based counter.
- Current owner paid $75k; list at $146k implies a 95% gain — meaningful room to come down on a strong offer.
Risks & watch-outs
- Watch-outs: property tax is 2.6% of price; built in 1851 — expect roof / HVAC / electrical / plumbing capex.
Questions for the listing agent
- It's been on market 47 days. Have you received any prior offers? Is the seller open to a 3% concession, seller financing, or rate buy-down credit?
- Built in 1851 — when were the roof, HVAC, electrical panel, plumbing, and water heater last replaced?
- Property tax is high relative to price — has the assessment been appealed recently, and will the sale trigger a re-assessment?
- Is there a deadline driving the sale (1031 exchange, divorce, estate, relocation)? That informs how much negotiation room exists.
- Crime grade is F in this area — have there been break-ins, vandalism, or insurance claims at this property in the last 3 years? What carrier currently insures it and at what premium?
- What's the average days-on-market for RENTAL listings here right now (not sales)? A rising rental-DOM trend means longer vacancies and softer asking-rent achievability than the comps imply.
- What's the recent tenant-quality profile in this submarket — average credit score on applications, eviction rate, late-payment / NSF rate, and stable-employment percentage? A property-management company in the area should have these aggregated.
- How much new for-sale + rental construction is in the pipeline within 1–3 miles? Heavy new supply typically softens prices + rents 12–24 months out; constrained supply supports both.
Investment metrics
- 1% rule
- 1.40% ✓
- Cap rate
- 10.17%
- Cash-on-cash
- 13.85%
- DSCR
- 1.62
- GRM
- 6.0
CMA / ARV
- ARV (on-the-fly)
- $131,320
- Comps found
- 7
Show comp detail 7 sales within ~0.75 mi
| Address | Dist | Beds/Ba | Sqft | Sold | Price | $/sf | Match |
|---|---|---|---|---|---|---|---|
| 152 Ontario St | 0.59mi | 3/1.0 (-1) | 935 (-5%) | 8mo | $125,350 | $134 | 52 |
| 39 Glenwood St | 0.66mi | 3/1.0 (-1) | 952 (-3%) | 13mo | $200,000 | $210 | 47 |
| 809 Park Ave | 0.65mi | 4/1.5 | 1,125 (+15%) | 4mo | $262,400 | $233 | 42 |
| 368 Elk St | 0.64mi | 3/1.0 (-1) | 1,040 (+6%) | 17mo | $77,000 | $74 | 39 |
| 52 Lawnridge Ave | 0.62mi | 3/2.0 (-1) | 1,123 (+15%) | 2mo | $325,000 | $289 | 38 |
| 9 Robin St | 0.72mi | 3/1.5 (-1) | 1,056 (+8%) | 16mo | $114,450 | $108 | 35 |
| 127 Sherman St | 0.66mi | 3/1.0 (-1) | 1,064 (+9%) | 16mo | $48,000 | $45 | 34 |
Match score weights: distance 35% · size 25% · config 20% · recency 20%. Top-matched comps best support the ARV.
Projected returns pro-forma
-3.0% appreciation · 5.05% rent growth · sell at horizon
- IRR
- 6.6%
- Equity multiple
- 1.26×
- Total profit
- $10,792
- Equity at exit
- $21,754
- IRR
- 17.9%
- Equity multiple
- 2.64×
- Total profit
- $66,919
- Equity at exit
- $12,615
Cash invested: $40,852 (down + closing). Projections, not guarantees.
Landlord ↔ Tenant lean methodology
- Overall (STATE)
- 15 Strongly Tenant-Friendly
- State New York
- 15 Strongly Tenant-Friendly · D+10
- County
- — inherits STATE
- City
- — inherits STATE
ZIP-level market 12208
- Home prices YoY
- -30.1%
- Rents YoY
- 5.0%
- Active inventory
- 99
- Price-to-rent
- 6.0×
Monthly cashflow live
- Estimated rent
- $2,043 high interval (Pro) →
- Mortgage (P&I)
- −$765
- Tax from tax record
- −$317 /mo · $3,804/yr
- Insurance
- −$61
- HOA
- −$0
- Vacancy / Maint / Mgmt
- −$429
- Net cashflow
- $471
Break-even live
Sensitivity live
| Price | -10% $554 | -5% $513 | +0% $471 | +5% $430 | +10% $389 |
|---|---|---|---|---|---|
| Rent | -10% $310 | -5% $391 | +0% $471 | +5% $552 | +10% $633 |
| Rate | -1.0pp $545 | -0.5pp $508 | base $471 | +0.5pp $434 | +1.0pp $395 |
UW: 25.0% down · 7.5% · 30yr · 1.5% tax · 5.0% vac · 8.0% maint · 8.0% mgmt
Financing live
Cash to close
- Down payment
- $36,475
- Closing costs
- $4,377
- Reserves months
- —
- Total cash needed
- —
Loan-product check · same deal, 3 products live
Conventional
25% down · 7.5% · 30yr
- Down + closing
- —
- Monthly P&I
- —
- Monthly cashflow
- —
- DSCR
- —
- Eligible?
- —
Personal DTI + credit; lowest rate.
DSCR
20% down · 8.5% · 30yr
- Down + closing
- —
- Monthly P&I
- —
- Monthly cashflow
- —
- DSCR
- —
- Eligible?
- —
No personal income docs; deal must DSCR.
Hard money
10% down · 12.0% · 12mo
- Down + closing
- —
- Monthly P&I
- —
- Monthly cashflow
- —
- DSCR
- —
- Eligible?
- —
Short-term bridge; refi at stabilization.
Rent comps 21 comps
| Address | Beds | Baths | Sqft | Rent | $/sqft | DOM | Units | Dist |
|---|---|---|---|---|---|---|---|---|
| 614 Park Ave Albany, NY | 3.0 | 1.0 | 1118 | $2,500 | $2.24 | 44d | 1 | 0.22mi |
| 489 Hamilton St Unit 1 Albany, NY | 3.0 | 1.0 | 1100 | $1,800 | $1.64 | 14d | 1 | 0.23mi |
| 673 Myrtle Ave Albany, NY | 4.0 | 1.0 | 1076 | $2,400 | $2.23 | 21d | 1 | 0.30mi |
| 223 Western Ave #1 Albany, NY | 3.0 | 1.0 | 1100 | $1,750 | $1.59 | 24d | 1 | 0.30mi |
| 184 Quail St Albany, NY | 3.0 | 1.0 | 618 | $1,600 | $2.59 | 44d | 1 | 0.32mi |
| 517 Hamilton St Albany, NY | 4.0 | 1.0 | 1020 | $2,000 | $1.96 | 24d | 1 | 0.32mi |
| 273 Western Ave Unit 3 Albany, NY | 3.0 | 1.0 | 1100 | $1,850 | $1.68 | 24d | 1 | 0.33mi |
| 273 Western Ave Unit 2 Albany, NY | 3.0 | 1.0 | 1000 | $1,800 | $1.80 | 24d | 1 | 0.33mi |
| 520 Madison Ave Unit 1 Albany, NY | 3.0 | 1.0 | 1080 | $1,700 | $1.57 | 44d | 1 | 0.49mi |
| 260 Bradford St Unit 205 Albany, NY | 3.0 | 2.0 | 912 | $1,700 | $1.86 | 24d | 1 | 0.63mi |
| 88 Willett St Albany, NY | 3.0 | 1.0 | 825 | $2,080 | $2.52 | 14d | 10 | 0.64mi |
| 199 Lark St Albany, NY | 3.0 | 1.0 | 1000 | $1,800 | $1.80 | 44d | 1 | 0.77mi |
| 316 2nd St Albany, NY | 3.0 | 1.0 | 850 | $1,700 | $2.00 | 44d | 1 | 0.87mi |
| 346 Madison Ave Unit 3 Albany, NY | 3.0 | 2.0 | 1110 | $2,725 | $2.45 | 44d | 1 | 0.91mi |
| 254 Sheridan Ave Unit 2 Albany, NY | 3.0 | 1.0 | 900 | $1,300 | $1.44 | 24d | 1 | 0.93mi |
| 4 Irving St Unit 2nd Floor Albany, NY | 3.0 | 1.0 | 1000 | $1,695 | $1.70 | 44d | 1 | 0.95mi |
| 469 Livingston Ave Albany, NY | 1.0–3.0 | 1.0 | 685 | $1,610 | $2.35 | 14d | 1 | 0.96mi |
| 31 Bertha St Albany, NY | 4.0 | 1.0 | 1116 | $2,000 | $1.79 | 24d | 1 | 1.20mi |
| 11 King Ave Unit 2 Albany, NY | 3.0 | 1.0 | 1100 | $1,600 | $1.45 | 14d | 1 | 1.22mi |
| 502 Second Ave #3 Albany, NY | 3.0 | 1.0 | 1100 | $1,800 | $1.64 | 44d | 1 | 1.28mi |
| 9 St Josephs Ter Albany, NY | 3.0 | 2.0 | 1000 | $1,850 | $1.85 | 44d | 1 | 1.37mi |
Listing history 33 events
-
2026-03-19status Pending
-
2026-03-09status Active
-
2026-02-27status Pending
-
2026-01-21$145,900 Active
-
2025-07-22historical
-
2025-07-15$170,000 Active
-
2023-10-01historical
-
2023-08-23$149,000 Active
-
2020-12-30historical
-
2020-01-23status Extended
-
2019-12-31historical
-
2019-05-06status Extended
-
2019-05-01historical
-
2019-05-01price $149,900
-
2018-05-01$125,000 New
-
2018-01-01historical
-
2017-06-14price $110,000
-
2016-10-31$120,000 New
-
2016-09-08historical
-
2016-05-12$120,000 New
-
2016-04-13historical
-
2015-10-19$120,000 Active
-
2015-10-06soldstatus $75,000
-
2015-09-29soldstatus $75,000 Closed (Final Sale)
-
2015-07-16historical
-
2015-06-23$82,900
-
2005-08-18soldstatus $75,000
-
2005-08-05soldstatus $75,000
-
2005-06-06historical
-
2005-06-03$75,000
-
2003-01-09soldstatus $35,000
-
2002-12-20soldstatus $35,000
-
2002-02-27$39,000
ⓘ Source: listings_history table (triggers on properties + properties_extension) + one-shot
backfill from property_details.listing_events for pre-trigger history.
Tax reassessment forecast NY · Partial reset (capped growth)
- Current annual tax
- $3,804 · $317/mo
- Projected year-2 tax
- $3,804 · $317/mo
- Expected delta
- $0/yr ($0/mo · 0.0%)
ⓘ Screening estimate from a state-policy table — verify with the county assessor before closing.
Climate risk First Street
- Flood 1/10 Low FEMA zone X (unshaded) · 0% chance over 30 yrs
- Wildfire 1/10 Low
- Heat 4/10 Moderate 7 d/yr ≥97°F today · 16 d/yr by 30 yrs out
- Wind 3/10 Moderate 6% chance of damaging wind over 30 yrs
- Air quality 1/10 Low 0 unhealthy d/yr today · 0 by 30 yrs out
Nearby sold comps map
Loading sold comps map…
Walkable amenities ~0.75 mi
Loading nearby amenities…
Taxation est. · year 1
- Rental income
- $24,520
- − Mortgage interest
- −$8,173
- − Property taxes
- −$3,804
- − Insurance
- −$730
- − Repairs & maintenance
- −$1,962
- − Management
- −$1,962
- − Depreciation
- −$4,244
- Taxable income
- $3,646
- Est. tax owed @ 24.0%
- −$875
- After-tax cash flow
- $4,781/yr
For passive investors: Depreciation is non-cash, so a rental often shows a tax loss while cash-flowing — sheltering income. Rental losses are passive: they offset passive income freely, and up to $25,000/yr can offset ordinary (W-2) income if you actively participate and your MAGI is under $100k (phasing out to $0 by $150k); unused losses carry forward. On sale, claimed depreciation is recaptured at up to 25%, and gains may owe capital-gains tax (a 1031 exchange can defer both). Figures are a year-1 estimate at your 24.0% rate — not tax advice; consult a CPA.
Schools (NCES district)
- District
- Albany City School District
- NCES district ID
- 3602460
- Math proficiency
- 37% ▲ 6.00%
- Reading proficiency
- 40% ▲ 7.00%
- Median HH income
- $40,568
- Composite
- 32.34/100
- National rank
- #5744
- State rank
- #543 of 590 in NY
Livability — Albany
- Score
- 79/100
- State rank
- #129
- US rank
- #2083
Category grades
Schools grade is shown separately in the Schools card above.
Census & demographics
- Census place
- Albany, NY
- County
- Albany County · 196,626 people
- City population
- 116,921
- Metro
- Albany-Schenectady-Troy, NY
- Population (ZIP)
- 23,289
- Household income
- $70,413
- Rent vs Own
- Severe rent burden
- 1952.0
Population outlook (Albany County) Hauer SSP2
- Today (2025)
- 320,794 people
- By 2030
- 327,401 · +2.1%
- By 2040
- 338,218 · +5.4%
- By 2050
- 348,467 · +8.6%
- By 2075
- 381,693 · +19.0%
- By 2100
- 393,809 · +22.8%
Race, ethnicity, and origin ACS 2023
- Neighborhood character
- Predominantly White (66%)
- Race & ethnicity
- White 66% Black 12% Asian 10% Hispanic / Latino 7% Two or more races 7%
- Hispanic origin (detail)
- Puerto Rican 3%
- Common ancestry
- Romanian 5% Italian 3% Scotch-Irish 3%
- Foreign-born
- 16% · Canada, China, Philippines
- Languages at home
- 83% English-only · Other Indo-European 4% Other Asian/Pacific 3% French/Haitian/Cajun 2%
Political lean MEDSL · Albany
- 2024 margin
- Strong D (+25.8) · D 62.9% · R 37.1%
- 2008→2024 swing
- -3.6pp toward R · 2008: 29.4pp · 2024: 25.8pp
- All cycles
- 2024: D+25.8 2020: D+31.4 2016: D+24.3 2012: D+31.0 2008: D+29.4
Not yet ingested
- Civics
- —
Market trends
- HPI YoY
- ▼ -120.46%
- Current HPI
- 279.716
- Rent YoY
- ▲ 5.05%
- Metro
- Albany-Schenectady-Troy, NY
- State GDP YoY
- ▲ 2.60%
- F500 in state
- 92
Industry mix (Fortune 500 HQ in NY)
| Industry | F500 HQs | Revenue |
|---|---|---|
| Financial Services | 10 | $950B |
|
||
| Consumer Goods | 9 | $162B |
|
||
| Insurance | 4 | $225B |
|
||
| Telecommunications | 2 | $144B |
|
||
| Pharmaceuticals | 2 | $112B |
|
||
| Media / Entertainment | 2 | $69B |
|
||
Price history
+274.1% since first listed33 events — show timeline
- 2026-03-19 Pending — Global MLS
- 2026-03-09 Relisted — Global MLS
- 2026-02-27 Pending — Global MLS
- 2026-01-21 Listed $145,900 Global MLS
- 2025-07-22 Listing Removed — Global MLS
- 2025-07-15 Listed $170,000 Global MLS
- 2023-10-01 Listing Removed — Global MLS
- 2023-08-23 Listed $149,000 Global MLS
- 2020-12-30 Listing Removed — Global MLS
- 2020-01-23 Relisted — Global MLS
- 2019-12-31 Listing Removed — Global MLS
- 2019-05-06 Relisted — Global MLS
- 2019-05-01 Listing Removed — Global MLS
- 2019-05-01 Price Changed $149,900 Global MLS
- 2018-05-01 Listed $125,000 Global MLS
- 2018-01-01 Listing Removed — Global MLS
- 2017-06-14 Price Changed $110,000 Global MLS
- 2016-10-31 Listed $120,000 Global MLS
- 2016-09-08 Listing Removed — Global MLS
- 2016-05-12 Listed $120,000 Global MLS
- 2016-04-13 Listing Removed — Global MLS
- 2015-10-19 Listed $120,000 Global MLS
- 2015-10-06 Sold (Public Records) $75,000 Public Records
- 2015-09-29 Sold (MLS) $75,000 Global MLS
- 2015-07-16 Listing Removed — Global MLS
- 2015-06-23 Listed $82,900 Global MLS
- 2005-08-18 Sold (Public Records) $75,000 Public Records
- 2005-08-05 Sold (MLS) $75,000 Global MLS
- 2005-06-06 Listing Removed — Global MLS
- 2005-06-03 Listed $75,000 Global MLS
- 2003-01-09 Sold (MLS) $35,000 Global MLS
- 2002-12-20 Sold (Public Records) $35,000 Public Records
- 2002-02-27 Listed $39,000 Global MLS
Property tax history
+4.1%/yrLatest (2025): $3,804 · +2.4% YoY. Source: county tax records.
Cash-flow waterfall
monthlySold comps — $/sqft
last 12 mo · ≤1 miLoading sold comps…