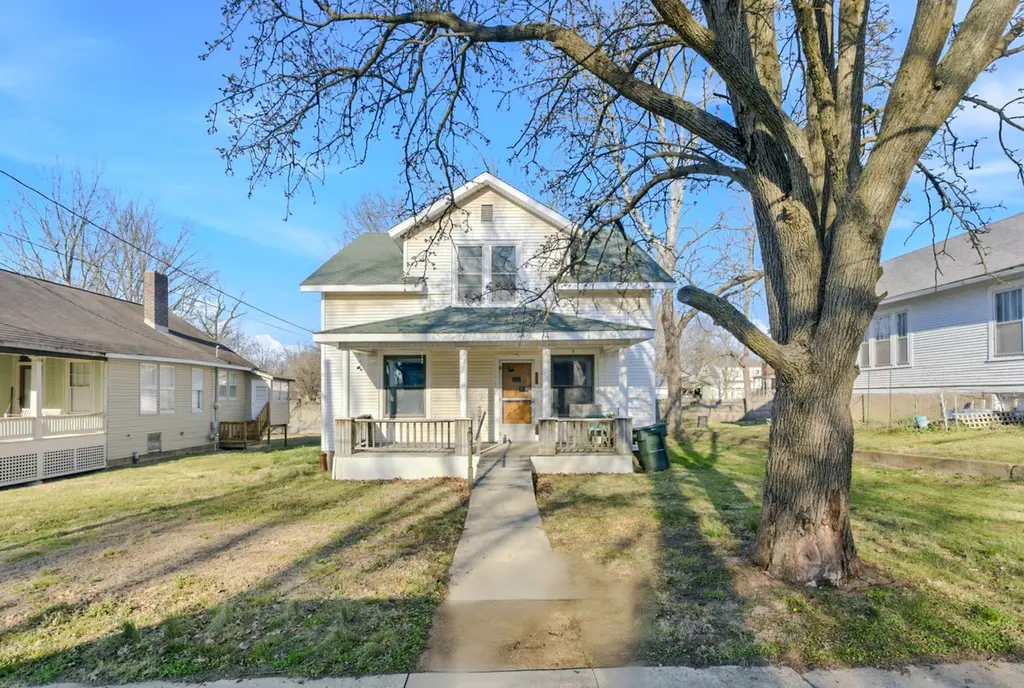
833 Center St · Fulton, MO
Flood risk 1/10 · Minimal
- FEMA flood zone
- X (unshaded)
- Chance of flooding over 30 yrs
- 0.0%
- Est. flood insurance / yr
- $473 – $860
Fire risk 4/10 · Minor
- Est. fire insurance / yr
- $1,054 – $1,958
Heat risk 4/10 · Minor
- Hot days now (above 106°F)
- 7 days/yr
- Hot days in 30 yrs
- 19 days/yr
Wind risk 2/10 · Minimal
- Chance of severe wind over 30 yrs
- —
Air-quality risk 2/10 · Minimal
- Unhealthy air days now
- 1 days/yr
- Unhealthy air days in 30 yrs
- 1 days/yr
Risk factors via First Street. Map © Google.
Why this score? — see what drove the B- grade
The composite is a weighted blend of 9 inputs, each scored 0–100. Each bar is that input's sub-score; the figure is the points it added to the 100-point composite (weight × sub-score).
- Cash flow +30.0/30.0
- 1% rule +10.0/10.0
- DSCR +10.0/10.0
- ARV discount +7.5/15.0
- Livability +3.6/5.0
- Schools +3.3/10.0
- Rent growth +2.5/5.0
- Condition / age +2.5/5.0
- Appreciation +0.0/10.0
$75,000
🖨 Deal sheet 📄 Offer letter ✓ Due diligence
Listing remarks MLS
Step into the charm of yesteryear with this historic home located at 833 Center Street in Fulton, Missouri. Rich with character and timeless architectural details, this property offers a rare opportunity to restore and reimagine a piece of local history. Being sold as is, this home is perfect for investors, renovators, or anyone with a vision. Original features hint at its former beauty--high ceilings, classic woodwork, and a layout that reflects the craftsmanship of its era. With the right updates, this property has the potential to become a stunning residence, income-producing rental, or unique showcase home. Situated in an established neighborhood, the location provides convenient access to downtown Fulton, local schools, and community amenities.
Key facts
- Original features
- Classic woodwork
- High ceilings
Tags
Neighborhood map
What this means for you Summary
Snapshot
- This is a 4-bed/1.0-bath single-family listed at $75k.
Deal economics
- At list price, monthly cash flow is $672 ($8k/yr) — positive.
- The deal already cash-flows at list — no discount required.
- Meets the 1% rule at list price ($1k rent vs $75k).
- Recommended offer: $73k (3.0% below list) — sets the bar for market timing.
- Cap rate 17.1% vs local median 4.0% in Fulton — top-decile yield for the area; either an underpriced asset or a hidden risk that comps aren't pricing in. Stress-test before assuming the spread holds.
Location & tenants
- Location reads 71/100 on livability (#115 in MO) — a middle-class / working-renter tenant base. Strengths: cost of living A+, housing A+, crime B+; Watch: amenities F, commute F, employment D-.
- Fulton 58 (town): math 36% / reading 42% proficiency, ranked #158 of 324 in MO (top 49%) — families likely to look elsewhere, expect single-tenant / working-renter base with shorter leases.
- Market conditions: 134 active listings in the ZIP; 3 comparable units currently listed for rent nearby; rentals at typical pace (median 21d on market — plan ~3-4 weeks tenant-placement turnaround); 40 units permitted in Callaway County in 2024 (0 in 5+ unit buildings).
Forward outlook
- Local home prices are declining (-3.0%/yr); year-one equity from $519 of loan paydown is wiped out by about $2k of value loss. Plan a longer hold.
- At projected returns (-3.0% appreciation + 3.0% rent growth), your $21k cash investment doubles in ~4 years — after that, you're playing with house money.
Negotiation context
- It's been on market 35 days — a 3% lower offer ($73k) is reasonable based on typical stale-listing flexibility.
Risks & watch-outs
- Watch-outs: built in 1920 — expect roof / HVAC / electrical / plumbing capex.
Questions for the listing agent
- It's been on market 35 days. Have you received any prior offers? Is the seller open to a 3% concession, seller financing, or rate buy-down credit?
- Built in 1920 — when were the roof, HVAC, electrical panel, plumbing, and water heater last replaced?
- Is there a deadline driving the sale (1031 exchange, divorce, estate, relocation)? That informs how much negotiation room exists.
- What's the average days-on-market for RENTAL listings here right now (not sales)? A rising rental-DOM trend means longer vacancies and softer asking-rent achievability than the comps imply.
- What's the recent tenant-quality profile in this submarket — average credit score on applications, eviction rate, late-payment / NSF rate, and stable-employment percentage? A property-management company in the area should have these aggregated.
- How much new for-sale + rental construction is in the pipeline within 1–3 miles? Heavy new supply typically softens prices + rents 12–24 months out; constrained supply supports both.
Investment metrics
- 1% rule
- 1.99% ✓
- Cap rate
- 17.05%
- Cash-on-cash
- 38.42%
- DSCR
- 2.71
- GRM
- 4.2
CMA / ARV
- ARV (median comp)
- $152,902
- List price
- $75,000
- Delta
- -50.95%
- Verdict
- UNDERPRICED
- Comps
- 20 within 1.0 mi
Show comp detail 8 sales within ~0.75 mi
| Address | Dist | Beds/Ba | Sqft | Sold | Price | $/sf | Match |
|---|---|---|---|---|---|---|---|
| 1021 N Bluff St | 0.27mi | 3/2.0 (-1) | 1,654 (-4%) | 8mo | $286,000 | $173 | 66 |
| 504 State Hwy Z | 0.56mi | 3/1.0 (-1) | 1,772 (+3%) | 4mo | $155,000 | $87 | 60 |
| 200 W 4th St | 0.56mi | 3/1.0 (-1) | 1,653 (-4%) | 7mo | $194,900 | $118 | 57 |
| 112 W 6th St | 0.42mi | 3/1.0 (-1) | 1,585 (-8%) | 9mo | $149,900 | $95 | 56 |
| 728 Vine St | 0.33mi | 3/1.0 (-1) | 1,575 (-8%) | 14mo | $179,900 | $114 | 55 |
| 702 Grand Ave | 0.35mi | 4/1.5 | 1,906 (+11%) | 20mo | $59,900 | $31 | 46 |
| 1408 Westminster Ave | 0.62mi | 3/2.0 (-1) | 1,669 (-3%) | 14mo | $159,900 | $96 | 46 |
| 505 Church St | 0.71mi | 3/2.0 (-1) | 1,764 (+3%) | 23mo | $287,900 | $163 | 33 |
Match score weights: distance 35% · size 25% · config 20% · recency 20%. Top-matched comps best support the ARV.
Projected returns pro-forma
-3.0% appreciation · 3.0% rent growth · sell at horizon
- IRR
- 34.5%
- Equity multiple
- 2.46×
- Total profit
- $30,689
- Equity at exit
- $11,183
- IRR
- 41.4%
- Equity multiple
- 4.90×
- Total profit
- $81,932
- Equity at exit
- $6,485
Cash invested: $21,000 (down + closing). Projections, not guarantees.
Landlord ↔ Tenant lean methodology
- Overall (STATE)
- 81 Strongly Landlord-Friendly
- State Missouri
- 81 Strongly Landlord-Friendly · R+10
- County
- — inherits STATE
- City
- — inherits STATE
ZIP-level market 65251
- Active inventory
- 134
- Price-to-rent
- 4.2×
Monthly cashflow live
- Estimated rent
- $1,491 medium interval (Pro) →
- Mortgage (P&I)
- −$393
- Tax from tax record
- −$81 /mo · $975/yr
- Insurance
- −$31
- HOA
- −$0
- Vacancy / Maint / Mgmt
- −$313
- Net cashflow
- $672
Break-even live
UW: 25.0% down · 7.5% · 30yr · 1.5% tax · 5.0% vac · 8.0% maint · 8.0% mgmt
Financing live
Cash to close
- Down payment
- $18,750
- Closing costs
- $2,250
- Reserves months
- —
- Total cash needed
- —
Loan-product check · same deal, 3 products live
Conventional
25% down · 7.5% · 30yr
- Down + closing
- —
- Monthly P&I
- —
- Monthly cashflow
- —
- DSCR
- —
- Eligible?
- —
Personal DTI + credit; lowest rate.
DSCR
20% down · 8.5% · 30yr
- Down + closing
- —
- Monthly P&I
- —
- Monthly cashflow
- —
- DSCR
- —
- Eligible?
- —
No personal income docs; deal must DSCR.
Hard money
10% down · 12.0% · 12mo
- Down + closing
- —
- Monthly P&I
- —
- Monthly cashflow
- —
- DSCR
- —
- Eligible?
- —
Short-term bridge; refi at stabilization.
Rent comps 3 comps
| Address | Beds | Baths | Sqft | Rent | $/sqft | DOM | Units | Dist |
|---|---|---|---|---|---|---|---|---|
| 301 W 14th St Fulton, MO | 3.0 | 1.0 | 1240 | $1,500 | $1.21 | 13d | 1 | 0.54mi |
| 703 W 7th St Fulton, MO | 4.0 | 2.0 | 1375 | $1,350 | $0.98 | 43d | 1 | 0.89mi |
| 501 Stack Rd Fulton, MO | 3.0 | 1.5 | 1200 | $1,275 | $1.06 | 21d | 1 | 1.23mi |
Listing history 15 events
-
2026-06-17statusdays on market $75,000 Pending 35 DOM
-
2026-06-16days on market $75,000 Active 34 DOM
-
2026-06-15days on market $75,000 Active 33 DOM
-
2026-06-14days on market $75,000 Active 31 DOM
-
2026-06-13days on market $75,000 Active 30 DOM
-
2026-06-10days on market $75,000 Active 28 DOM
-
2026-06-09days on market $75,000 Active 27 DOM
-
2026-06-08days on market $75,000 Active 26 DOM
-
2026-06-07pricedays on market $75,000 Active 25 DOM
-
2026-06-02days on market $89,000 Active 20 DOM
-
2026-05-31days on market $89,000 Active 18 DOM
-
2026-05-30days on market $89,000 Active 17 DOM
-
2026-05-02status Pending 759-char remark
Show marketing remark (759 chars)
Step into the charm of yesteryear with this historic home located at 833 Center Street in Fulton, Missouri. Rich with character and timeless architectural details, this property offers a rare opportunity to restore and reimagine a piece of local history. Being sold as is, this home is perfect for investors, renovators, or anyone with a vision. Original features hint at its former beauty--high ceilings, classic woodwork, and a layout that reflects the craftsmanship of its era. With the right updates, this property has the potential to become a stunning residence, income-producing rental, or unique showcase home. Situated in an established neighborhood, the location provides convenient access to downtown Fulton, local schools, and community amenities.
-
2026-04-16$89,000 Active 759-char remark
Show marketing remark (759 chars)
Step into the charm of yesteryear with this historic home located at 833 Center Street in Fulton, Missouri. Rich with character and timeless architectural details, this property offers a rare opportunity to restore and reimagine a piece of local history. Being sold as is, this home is perfect for investors, renovators, or anyone with a vision. Original features hint at its former beauty--high ceilings, classic woodwork, and a layout that reflects the craftsmanship of its era. With the right updates, this property has the potential to become a stunning residence, income-producing rental, or unique showcase home. Situated in an established neighborhood, the location provides convenient access to downtown Fulton, local schools, and community amenities.
-
2000-10-25soldstatus
ⓘ Source: listings_history table (triggers on properties + properties_extension) + one-shot
backfill from property_details.listing_events for pre-trigger history.
Tax reassessment forecast MO · Resets to sale price
- Current annual tax
- $975 · $81/mo
- Projected year-2 tax
- $975 · $81/mo
- Expected delta
- $0/yr ($0/mo · 0.0%)
ⓘ Screening estimate from a state-policy table — verify with the county assessor before closing.
Climate risk First Street
- Flood 1/10 Low FEMA zone X (unshaded) · 0% chance over 30 yrs
- Wildfire 4/10 Moderate
- Heat 4/10 Moderate 7 d/yr ≥106°F today · 19 d/yr by 30 yrs out
- Wind 2/10 Low
- Air quality 2/10 Low 1 unhealthy d/yr today · 1 by 30 yrs out
Nearby sold comps map
Loading sold comps map…
Walkable amenities ~0.75 mi
Loading nearby amenities…
Taxation est. · year 1
- Rental income
- $17,897
- − Mortgage interest
- −$4,201
- − Property taxes
- −$975
- − Insurance
- −$375
- − Repairs & maintenance
- −$1,432
- − Management
- −$1,432
- − Depreciation
- −$2,182
- Taxable income
- $7,301
- Est. tax owed @ 24.0%
- −$1,752
- After-tax cash flow
- $6,317/yr
For passive investors: Depreciation is non-cash, so a rental often shows a tax loss while cash-flowing — sheltering income. Rental losses are passive: they offset passive income freely, and up to $25,000/yr can offset ordinary (W-2) income if you actively participate and your MAGI is under $100k (phasing out to $0 by $150k); unused losses carry forward. On sale, claimed depreciation is recaptured at up to 25%, and gains may owe capital-gains tax (a 1031 exchange can defer both). Figures are a year-1 estimate at your 24.0% rate — not tax advice; consult a CPA.
Schools (NCES district)
- District
- Fulton 58
- NCES district ID
- 2912550
- Math proficiency
- 36% ▼ -1.00%
- Reading proficiency
- 42% ▼ -4.00%
- Median HH income
- $46,431
- Composite
- 33.31/100
- National rank
- #5504
- State rank
- #158 of 324 in MO
Livability — Fulton
- Score
- 71/100
- State rank
- #115
- US rank
- #7204
Category grades
Schools grade is shown separately in the Schools card above.
Census & demographics
- Census place
- Fulton, MO
- County
- Callaway County · 22,579 people
- City population
- 22,579
- Metro
- Jefferson City, MO
- Population (ZIP)
- 22,579
- Household income
- $63,072
- Rent vs Own
- Severe rent burden
- 551.0
Population outlook (Callaway County) Hauer SSP2
- Today (2025)
- 45,390 people
- By 2030
- 45,493 · +0.2%
- By 2040
- 45,092 · -0.7%
- By 2050
- 44,069 · -2.9%
- By 2075
- 41,875 · -7.7%
- By 2100
- 38,094 · -16.1%
Race, ethnicity, and origin ACS 2023
- Neighborhood character
- Predominantly White (86%)
- Race & ethnicity
- White 86% Two or more races 6% Black 5% Hispanic / Latino 3%
- Common ancestry
- Italian 5% Lithuanian 3% Serbian 2%
- Foreign-born
- 1% · Canada
- Languages at home
- 98% English-only · Spanish 1%
Political lean MEDSL · Callaway
- 2024 margin
- Solid R (+43.3) · D 27.6% · R 70.9% · Other 1.5%
- 2008→2024 swing
- -23.6pp toward R · 2008: -19.7pp · 2024: -43.3pp
- All cycles
- 2024: R+43.3 2020: R+42.3 2016: R+42.2 2012: R+31.1 2008: R+19.7
Not yet ingested
- Civics
- —
Market trends
- HPI YoY
- ▼ -119.33%
- Current HPI
- 205.5205
- Rent YoY
- —
- Metro
- Jefferson City, MO
- State GDP YoY
- ▲ 1.84%
- F500 in state
- 20
Industry mix (Fortune 500 HQ in MO)
| Industry | F500 HQs | Revenue |
|---|---|---|
| Healthcare | 1 | $163B |
|
||
| Insurance | 1 | $21B |
|
||
| Industrial Technology | 1 | $17B |
|
||
| Retail | 1 | $16B |
|
||
| Industrial Distribution | 1 | $10B |
|
||
| Utilities | 1 | $9B |
|
||
Price history
3 events — show timeline
- 2026-05-02 Pending — CBORMLS
- 2026-04-16 Listed $89,000 CBORMLS
- 2000-10-25 Sold (Public Records) — Public Records
Property tax history
+7.7%/yrLatest (2024): $975 · +0.5% YoY. Source: county tax records.
Cash-flow waterfall
monthlySold comps — $/sqft
last 12 mo · ≤1 miLoading sold comps…