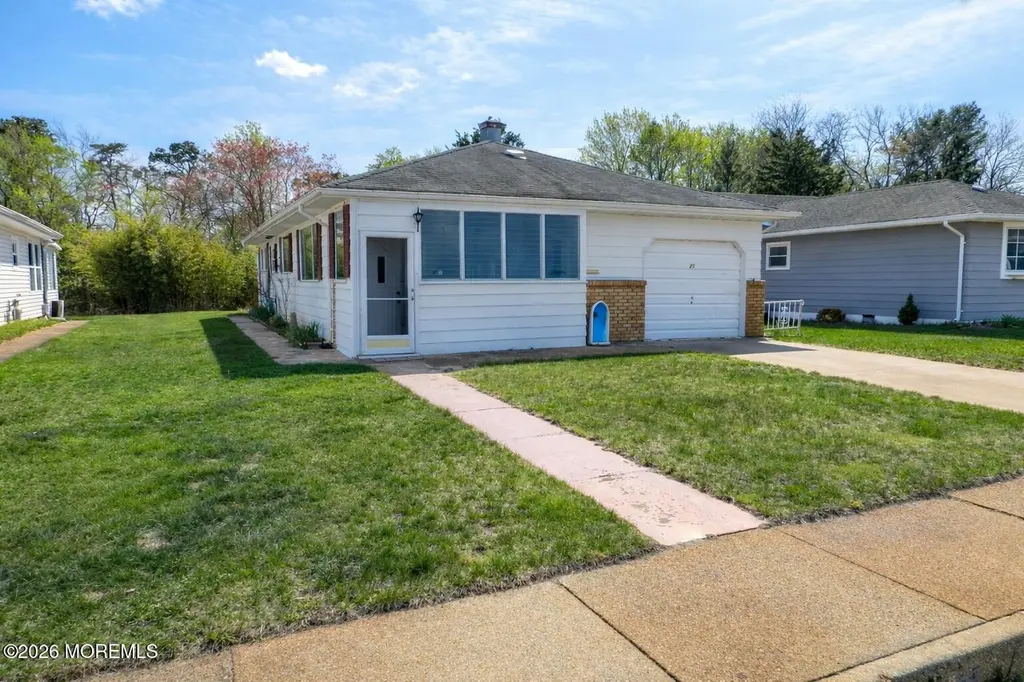
23 Barbados Dr S · Silver Ridge, NJ
Flood risk 6/10 · Moderate
- FEMA flood zone
- X (shaded)
- Chance of flooding over 30 yrs
- 0.53%
- Est. flood insurance / yr
- $507 – $1,088
Fire risk 4/10 · Minor
- Est. fire insurance / yr
- $526 – $976
Heat risk 7/10 · Major
- Hot days now (above 102°F)
- 7 days/yr
- Hot days in 30 yrs
- 15 days/yr
Wind risk 6/10 · Moderate
- Chance of severe wind over 30 yrs
- 68.0%
Air-quality risk 3/10 · Minor
- Unhealthy air days now
- 3 days/yr
- Unhealthy air days in 30 yrs
- 4 days/yr
Risk factors via First Street. Map © Google.
Why this score? — see what drove the C grade
The composite is a weighted blend of 9 inputs, each scored 0–100. Each bar is that input's sub-score; the figure is the points it added to the 100-point composite (weight × sub-score).
- Cash flow +19.8/30.0
- ARV discount +15.0/15.0
- DSCR +6.3/10.0
- 1% rule +5.2/10.0
- Livability +3.4/5.0
- Schools +2.6/10.0
- Rent growth +2.5/5.0
- Condition / age +2.5/5.0
- Appreciation +0.0/10.0
$235,000
🖨 Deal sheet 📄 Offer letter ✓ Due diligence
Listing remarks MLS
You just can't beat the location of this Yellowstone in Holiday City Berkeley, a 55+ active adult community at the Jersey Shore. If you are looking for a serene backyard with a babbling brook, this is it! There is a front enclosure that offers entrance to the home and garage - and you can't beat the 3 season room to relax and enjoy. Come take a look and leave the hustle and bustle behind!
Key facts
- Swimming pools
- Community amenities
- Clubhouses
Tags
Property features AI
Finance
- HOA & community: HOA present (Holiday City Berkeley); Monthly association fee of $50; Community amenities: swimming pool, clubhouse, common area, common access; Association fee covers: common area, lawn maintenance, pool, snow removal
Exterior
- Parking: Attached 1-car garage
- Utilities: Public sewer
- Home design: Single-family (fee simple ownership); Model: Yellowstone
- Construction: Crawl space foundation
- Exterior features: Shingle roof; Stream on the property; Level lot
Interior
- Kitchen: Dishwasher; Microwave; Stove; Refrigerator; Gas cooking
- Bedrooms: 2 bedrooms (all on the first level)
- Flooring: Tile; Other
- Bathrooms: 1 full bathroom (on the first level)
- Heating & cooling: Baseboard heating; Central air conditioning
- Interior features: Outdoor lighting; Window treatments; Light fixtures; See remarks (additional interior details)
- Laundry & utility: Washer; Dryer
Neighborhood map
What this means for you Summary
Snapshot
- This is a 2-bed/1.0-bath single-family listed at $235k.
Deal economics
- At list price, monthly cash flow is $280 ($3k/yr) — positive.
- The deal already cash-flows at list — no discount required.
- Meets the 1% rule at list price ($2k rent vs $235k).
- Recommended offer: $231k (1.5% below list) — sets the bar for market timing.
Location & tenants
- Location reads 67/100 on livability (#338 in NJ) — a middle-class / working-renter tenant base. Strengths: crime A+, health & safety A+, housing A-; Watch: schools F, amenities F, commute F.
- Central Regional School District (suburban): math 17% / reading 43% proficiency, ranked #357 of 472 in NJ (top 76%) — families likely to look elsewhere, expect single-tenant / working-renter base with shorter leases.
- Market conditions: 491 active listings in the ZIP; 5 comparable units currently listed for rent nearby; rentals leasing fast (median 2d on market — plan ~1-2 weeks tenant-placement turnaround); 4,434 units permitted in Ocean County in 2024 (868 in 5+ unit buildings).
- At $2,398/mo this rent would consume 49% of the median local household income ($58k/yr) (locally 1010% of renters already pay >50% of income on rent) — very limited rent-growth headroom before tenants either downsize or default.
Forward outlook
- Local home prices are declining (-3.0%/yr); year-one equity from $2k of loan paydown is wiped out by about $7k of value loss. Plan a longer hold.
- Ocean County population projected to shrink 8% by 2050 — rents likely to lag national; underwrite the cash flow, not the appreciation.
Negotiation context
- It's been on market 23 days — a 2% lower offer ($231k) is reasonable based on typical stale-listing flexibility.
- 3 sale attempts since 17y ago with the ask held roughly flat each time — persistent listings suggest the price (not the market) is what's stuck; bring a comps-based counter.
- Current owner paid $122k; list at $235k implies a 93% gain — meaningful room to come down on a strong offer.
Risks & watch-outs
- Climate carrying-cost: major flood risk; major wind risk, 68% chance of damaging wind over 30y; extreme-heat days projected 7→15/yr by 2055 (HVAC capex compounding) — expect insurance premiums to compound above CPI over the hold.
Questions for the listing agent
- Built in 1970 — when were the roof, HVAC, electrical panel, plumbing, and water heater last replaced?
- What does the HOA fee cover, when was the last increase, and are there any pending special assessments or reserve-fund shortfalls?
- Is there a deadline driving the sale (1031 exchange, divorce, estate, relocation)? That informs how much negotiation room exists.
- Schools are F-rated, which usually means shorter tenancies and higher turnover. Who's the typical renter profile here, and what's been the actual vacancy rate?
- What's the average days-on-market for RENTAL listings here right now (not sales)? A rising rental-DOM trend means longer vacancies and softer asking-rent achievability than the comps imply.
- What's the recent tenant-quality profile in this submarket — average credit score on applications, eviction rate, late-payment / NSF rate, and stable-employment percentage? A property-management company in the area should have these aggregated.
- How much new for-sale + rental construction is in the pipeline within 1–3 miles? Heavy new supply typically softens prices + rents 12–24 months out; constrained supply supports both.
Investment metrics
- 1% rule
- 1.02% ✓
- Cap rate
- 7.72%
- Cash-on-cash
- 5.10%
- DSCR
- 1.23
- GRM
- 8.2
CMA / ARV
- ARV (on-the-fly)
- $294,488
- Comps found
- 12
Show comp detail 12 sales within ~0.75 mi
| Address | Dist | Beds/Ba | Sqft | Sold | Price | $/sf | Match |
|---|---|---|---|---|---|---|---|
| 23 Barbados Dr S | 0.00mi | 2/1.0 | 1,124 (0%) | 1mo | $200,000 | $178 | 99 |
| 843 N Edgebrook Dr N | 0.07mi | 2/1.0 | 1,122 (-0%) | 2mo | $294,000 | $262 | 95 |
| 37 Oranjestad St | 0.36mi | 2/1.0 | 1,124 (0%) | 2mo | $242,500 | $216 | 82 |
| 18 Saint David Dr | 0.41mi | 2/1.0 | 1,124 (0%) | 1mo | $305,000 | $271 | 80 |
| 6 Marigot Ct | 0.37mi | 2/1.5 | 1,154 (+3%) | 1mo | $350,000 | $303 | 75 |
| 22 Down Ct | 0.59mi | 2/1.5 | 1,140 (+1%) | 2mo | $330,000 | $289 | 67 |
| 6 Speighstown Pl | 0.57mi | 2/2.0 | 1,232 (+10%) | 0mo | $295,000 | $239 | 53 |
| 9 Port Royal Dr | 0.61mi | 2/2.0 | 1,232 (+10%) | 1mo | $420,000 | $341 | 51 |
| 20 Paradise Blvd | 0.60mi | 2/2.0 | 1,232 (+10%) | 1mo | $425,000 | $345 | 51 |
| 116 Orlando Blvd | 0.65mi | 2/2.0 | 1,232 (+10%) | 2mo | $287,000 | $233 | 48 |
| 5 Templeton St | 0.69mi | 2/2.0 | 1,232 (+10%) | 1mo | $300,000 | $244 | 47 |
| 9 Hamilton Ct | 0.67mi | 2/1.0 | 971 (-14%) | 2mo | $225,000 | $232 | 45 |
Match score weights: distance 35% · size 25% · config 20% · recency 20%. Top-matched comps best support the ARV.
Projected returns pro-forma
-3.0% appreciation · 3.0% rent growth · sell at horizon
- IRR
- -8.4%
- Equity multiple
- 0.69×
- Total profit
- $-20,232
- Equity at exit
- $35,039
- IRR
- 1.2%
- Equity multiple
- 1.08×
- Total profit
- $5,449
- Equity at exit
- $20,319
Cash invested: $65,800 (down + closing). Projections, not guarantees.
Landlord ↔ Tenant lean methodology
- Overall (STATE)
- 21 Tenant-Leaning
- State New Jersey
- 21 Tenant-Leaning · D+6
- County
- — inherits STATE
- City
- — inherits STATE
ZIP-level market 08757
- Active inventory
- 491
- Price-to-rent
- 8.2×
Monthly cashflow live
- Estimated rent
- $2,398 high interval (Pro) →
- Mortgage (P&I)
- −$1,232
- Tax from tax record
- −$234 /mo · $2,810/yr
- Insurance
- −$98
- HOA
- −$50
- Vacancy / Maint / Mgmt
- −$504
- Net cashflow
- $280
Break-even live
UW: 25.0% down · 7.5% · 30yr · 1.5% tax · 5.0% vac · 8.0% maint · 8.0% mgmt
Financing live
Cash to close
- Down payment
- $58,750
- Closing costs
- $7,050
- Reserves months
- —
- Total cash needed
- —
Loan-product check · same deal, 3 products live
Conventional
25% down · 7.5% · 30yr
- Down + closing
- —
- Monthly P&I
- —
- Monthly cashflow
- —
- DSCR
- —
- Eligible?
- —
Personal DTI + credit; lowest rate.
DSCR
20% down · 8.5% · 30yr
- Down + closing
- —
- Monthly P&I
- —
- Monthly cashflow
- —
- DSCR
- —
- Eligible?
- —
No personal income docs; deal must DSCR.
Hard money
10% down · 12.0% · 12mo
- Down + closing
- —
- Monthly P&I
- —
- Monthly cashflow
- —
- DSCR
- —
- Eligible?
- —
Short-term bridge; refi at stabilization.
Rent comps 5 comps
| Address | Beds | Baths | Sqft | Rent | $/sqft | DOM | Units | Dist |
|---|---|---|---|---|---|---|---|---|
| 2 York St Toms River, NJ | 2.0 | 1.5 | 1105 | $2,200 | $1.99 | 1d | 1 | 0.09mi |
| 59 Guadeloupe Dr Toms River, NJ | 2.0 | 2.0 | 1126 | $2,300 | $2.04 | 1d | 1 | 0.78mi |
| 12 Mayaquez Ln Toms River, NJ | 2.0 | 2.0 | 1364 | $2,100 | $1.54 | 1d | 1 | 0.99mi |
| 159 Fort de France Ave Toms River, NJ | 2.0 | 2.0 | 1440 | $2,475 | $1.72 | 6d | 1 | 1.02mi |
| 510 Jamaica Blvd Toms River, NJ | 2.0 | 2.0 | 1264 | $2,500 | $1.98 | 1d | 1 | 1.15mi |
HOA detail
- Monthly dues
- $50 · $600/yr
Listing history 8 events
-
2026-05-14status Pending
-
2026-04-20$235,000 Active
-
2013-09-27soldstatus $122,000
-
2013-09-20soldstatus $122,000 391-char remark
Show marketing remark (391 chars)
You just can't beat the location of this Yellowstone in Holiday City Berkeley, a 55+ active adult community at the Jersey Shore. If you are looking for a serene backyard with a babbling brook, this is it! There is a front enclosure that offers entrance to the home and garage - and you can't beat the 3 season room to relax and enjoy. Come take a look and leave the hustle and bustle behind!
-
2013-05-02$119,900 391-char remark
Show marketing remark (391 chars)
You just can't beat the location of this Yellowstone in Holiday City Berkeley, a 55+ active adult community at the Jersey Shore. If you are looking for a serene backyard with a babbling brook, this is it! There is a front enclosure that offers entrance to the home and garage - and you can't beat the 3 season room to relax and enjoy. Come take a look and leave the hustle and bustle behind!
-
2009-01-10$155,500
-
1991-02-28soldstatus $65,000
-
1984-09-01soldstatus $54,500
ⓘ Source: listings_history table (triggers on properties + properties_extension) + one-shot
backfill from property_details.listing_events for pre-trigger history.
Tax reassessment forecast NJ · Partial reset (capped growth)
- Current annual tax
- $2,810 · $234/mo
- Projected year-2 tax
- $4,331 · $361/mo
- Expected delta
- +$1,521/yr (+$127/mo · 54.1%)
ⓘ Screening estimate from a state-policy table — verify with the county assessor before closing.
Climate risk First Street
- Flood 6/10 Major FEMA zone X (shaded) · 53% chance over 30 yrs
- Wildfire 4/10 Moderate
- Heat 7/10 Severe 7 d/yr ≥102°F today · 15 d/yr by 30 yrs out
- Wind 6/10 Major 68% chance of damaging wind over 30 yrs
- Air quality 3/10 Moderate 3 unhealthy d/yr today · 4 by 30 yrs out
Nearby sold comps map
Loading sold comps map…
Walkable amenities ~0.75 mi
Loading nearby amenities…
Taxation est. · year 1
- Rental income
- $28,773
- − Mortgage interest
- −$13,164
- − Property taxes
- −$2,810
- − Insurance
- −$1,175
- − Repairs & maintenance
- −$2,302
- − Management
- −$2,302
- − HOA
- −$600
- − Depreciation
- −$6,836
- Taxable loss
- −$416
- Est. tax savings @ 24.0%
- +$100
- After-tax cash flow
- $3,457/yr
For passive investors: Depreciation is non-cash, so a rental often shows a tax loss while cash-flowing — sheltering income. Rental losses are passive: they offset passive income freely, and up to $25,000/yr can offset ordinary (W-2) income if you actively participate and your MAGI is under $100k (phasing out to $0 by $150k); unused losses carry forward. On sale, claimed depreciation is recaptured at up to 25%, and gains may owe capital-gains tax (a 1031 exchange can defer both). Figures are a year-1 estimate at your 24.0% rate — not tax advice; consult a CPA.
Schools (NCES district)
- District
- Central Regional School District
- NCES district ID
- 3402910
- Math proficiency
- 17% ▼ -14.00%
- Reading proficiency
- 43% ▲ 7.00%
- Median HH income
- $44,676
- Composite
- 25.59/100
- National rank
- #7422
- State rank
- #357 of 472 in NJ
Livability — Silver Ridge
- Score
- 67/100
- State rank
- #338
- US rank
- #10927
Category grades
Schools grade is shown separately in the Schools card above.
Census & demographics
- Census place
- Silver Ridge, NJ
- County
- Ocean County · 439,426 people
- Metro
- New York-Newark-Jersey City, NY-NJ-PA
- Population (ZIP)
- 36,087
- Household income
- $58,319
- Rent vs Own
- Severe rent burden
- 1010.0
Population outlook (Ocean County) Hauer SSP2
- Today (2025)
- 586,991 people
- By 2030
- 581,403 · -1.0%
- By 2040
- 564,913 · -3.8%
- By 2050
- 538,149 · -8.3%
- By 2075
- 468,845 · -20.1%
- By 2100
- 350,297 · -40.3%
Race, ethnicity, and origin ACS 2023
- Neighborhood character
- Predominantly White (75%)
- Race & ethnicity
- White 75% Hispanic / Latino 15% Two or more races 9% Black 5% Asian 2%
- Hispanic origin (detail)
- Mexican 4% Puerto Rican 6% Dominican 1%
- Common ancestry
- Romanian 9% Slovak 2% Iranian 2%
- Foreign-born
- 11% · Canada, Jamaica
- Languages at home
- 85% English-only · Spanish 7% Other Indo-European 3% Russian/Polish/Slavic 2%
Political lean MEDSL · Ocean
- 2024 margin
- Solid R (+36.0) · D 31.4% · R 67.4% · Other 1.2%
- 2008→2024 swing
- -17.6pp toward R · 2008: -18.4pp · 2024: -36.0pp
- All cycles
- 2024: R+36.0 2020: R+28.7 2016: R+34.0 2012: R+17.7 2008: R+18.4
Not yet ingested
- Civics
- —
Market trends
- HPI YoY
- ▼ -429.32%
- Current HPI
- 305.1341
- Rent YoY
- —
- Metro
- New York-Newark-Jersey City, NY-NJ-PA
- State GDP YoY
- ▲ 2.05%
- F500 in state
- 34
Industry mix (Fortune 500 HQ in NJ)
| Industry | F500 HQs | Revenue |
|---|---|---|
| Consumer Goods | 3 | $31B |
|
||
| Pharmaceuticals | 2 | $153B |
|
||
| Technology | 2 | $21B |
|
||
| Insurance | 2 | $20B |
|
||
| Healthcare | 2 | $19B |
|
||
| Financial Services | 1 | $70B |
|
||
Price history
+331.2% since first listed8 events — show timeline
- 2026-05-14 Pending — MOMLS
- 2026-04-20 Listed $235,000 MOMLS
- 2013-09-27 Sold (Public Records) $122,000 Public Records
- 2013-09-20 Sold (MLS) $122,000 MOMLS
- 2013-05-02 Listed $119,900 MOMLS
- 2009-01-10 Listed $155,500 MOMLS
- 1991-02-28 Sold (Public Records) $65,000 Public Records
- 1984-09-01 Sold (Public Records) $54,500 Public Records
Property tax history
+2.8%/yrLatest (2025): $2,810 · +7.4% YoY. Source: county tax records.
Cash-flow waterfall
monthlySold comps — $/sqft
last 12 mo · ≤1 miLoading sold comps…