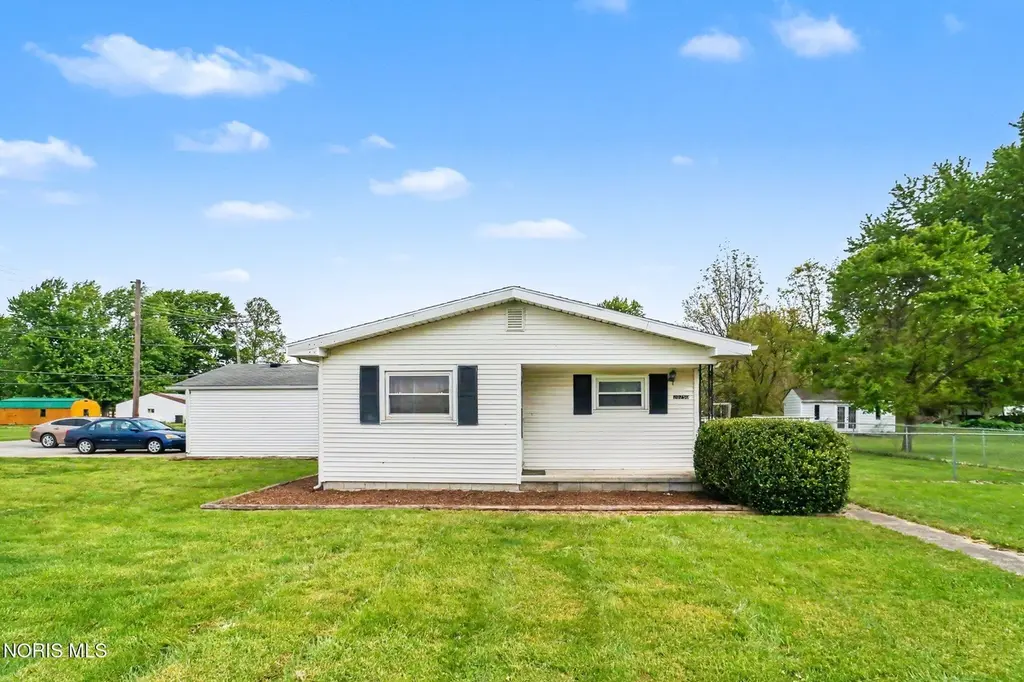
20750 Taylor St · Weston, OH
Flood risk 3/10 · Minor
- FEMA flood zone
- X (unshaded)
- Chance of flooding over 30 yrs
- 0.2%
- Est. flood insurance / yr
- $507 – $1,088
Fire risk 1/10 · Minimal
- Est. fire insurance / yr
- $713 – $1,323
Heat risk 3/10 · Minor
- Hot days now (above 99°F)
- 7 days/yr
- Hot days in 30 yrs
- 17 days/yr
Wind risk 2/10 · Minimal
- Chance of severe wind over 30 yrs
- —
Air-quality risk 2/10 · Minimal
- Unhealthy air days now
- 1 days/yr
- Unhealthy air days in 30 yrs
- 2 days/yr
Risk factors via First Street. Map © Google.
Why this score? — see what drove the C+ grade
The composite is a weighted blend of 9 inputs, each scored 0–100. Each bar is that input's sub-score; the figure is the points it added to the 100-point composite (weight × sub-score).
- Cash flow +21.0/30.0
- ARV discount +15.0/15.0
- DSCR +6.7/10.0
- 1% rule +5.5/10.0
- Schools +5.4/10.0
- Livability +3.2/5.0
- Rent growth +2.5/5.0
- Condition / age +2.5/5.0
- Appreciation +0.0/10.0
$110,000
🖨 Deal sheet 📄 Offer letter ✓ Due diligence
Listing remarks MLS
This comfortable home across from park has been totally remodeled. New windows, master bdrm & bath added in '08, kitchen in '10 & water heater in '14. The wood floors are the originals & have been resurfaced. Large spacious living rm & eat-in kitchen w/oak cupboards. Den has large closet & could be used as a 4th. bdrm. After seeing this well maintained home, check out the large lot w/shed & deck.
Key facts
- 0.3 acre lot
- 2 garage spots
- Built 1960
Property features AI
Finance
- Other: Lot includes an additional parcel; Lot size approximately 0.3 acre
Exterior
- Parking: Attached garage; 2 garage spaces; Driveway parking; Concrete surfaces
- Utilities: Electricity connected with circuit breaker panel; Natural gas connected; Public water; Public sewer
- Home design: Single-family residence — house; One level / single-story; No attached units or common walls; Living area reported from public records
- Construction: Vinyl siding; Crawl space foundation
- Exterior features: Shingle roof; Chain link fencing; Shed(s) on the property
Interior
- Kitchen: Kitchen on the main level (approx. 16 x 12)
- Bedrooms: Primary bedroom on the main level (approx. 15 x 20); Bedroom 2 on the main level (approx. 12 x 12); Bedroom 3 on the main level (approx. 8 x 14)
- Flooring: Other flooring
- Bathrooms: 2 full bathrooms
- Heating & cooling: Forced air heating (natural gas); Central air conditioning
- Interior features: Primary bathroom; Total of 5 rooms
- Laundry & utility: Laundry located on the main level
Neighborhood map
What this means for you Summary
Snapshot
- This is a 3-bed/2.0-bath single-family listed at $110k.
Deal economics
- At list price, monthly cash flow is $155 ($2k/yr) — positive.
- The deal already cash-flows at list — no discount required.
- Meets the 1% rule at list price ($1k rent vs $110k).
- Recommended offer: $108k (1.5% below list) — sets the bar for market timing.
Location & tenants
- Location reads 64/100 on livability (#761 in OH) — a middle-class / working-renter tenant base. Strengths: crime A+, cost of living A+, housing A+; Watch: amenities F, commute F, employment D-.
- Otsego Local (rural): math 59% / reading 65% proficiency, ranked #231 of 656 in OH (top 35%) — acceptable for families but not a draw, mixed tenant base, ~2y average lease.
- Zoned schools: Otsego Elementary School (math 63% / reading 66%, grade B, #522 of 1,584 statewide, top 36%, 833 students, 25% FRL); Otsego High School (math 10% / reading 67%, grade F, #555 of 781 statewide, top 71%, 479 students, 31% FRL) — zoned schools at 28% FRL track the district average.
- Market conditions: 7 active listings in the ZIP; 493 units permitted in Wood County in 2024 (48 in 5+ unit buildings).
Forward outlook
- Local home prices are declining (-3.0%/yr); year-one equity from $761 of loan paydown is wiped out by about $3k of value loss. Plan a longer hold.
- Wood County population projected at +14% by 2050 — modest demand growth; plan on rents tracking national, not racing it.
Negotiation context
- It's been on market 28 days — a 2% lower offer ($108k) is reasonable based on typical stale-listing flexibility.
- 3 sale attempts since 12y ago with the ask held roughly flat each time — persistent listings suggest the price (not the market) is what's stuck; bring a comps-based counter.
Questions for the listing agent
- Built in 1960 — when were the roof, HVAC, electrical panel, plumbing, and water heater last replaced?
- Is there a deadline driving the sale (1031 exchange, divorce, estate, relocation)? That informs how much negotiation room exists.
- Schools are F-rated, which usually means shorter tenancies and higher turnover. Who's the typical renter profile here, and what's been the actual vacancy rate?
- What's the average days-on-market for RENTAL listings here right now (not sales)? A rising rental-DOM trend means longer vacancies and softer asking-rent achievability than the comps imply.
- What's the recent tenant-quality profile in this submarket — average credit score on applications, eviction rate, late-payment / NSF rate, and stable-employment percentage? A property-management company in the area should have these aggregated.
- How much new for-sale + rental construction is in the pipeline within 1–3 miles? Heavy new supply typically softens prices + rents 12–24 months out; constrained supply supports both.
Investment metrics
- 1% rule
- 1.05% ✓
- Cap rate
- 7.99%
- Cash-on-cash
- 6.05%
- DSCR
- 1.27
- GRM
- 7.9
CMA / ARV
- ARV (median comp)
- $144,466
- List price
- $110,000
- Delta
- -23.86%
- Verdict
- UNDERPRICED
- Comps
- 20 within 1.0 mi
Show comp detail 9 sales within ~0.75 mi
| Address | Dist | Beds/Ba | Sqft | Sold | Price | $/sf | Match |
|---|---|---|---|---|---|---|---|
| 20700 Sycamore St | 0.09mi | 3/2.0 | 1,248 (-7%) | 10mo | $182,150 | $146 | 75 |
| 20710 Taylor St | 0.04mi | 2/1.5 (-1) | 1,326 (-1%) | 19mo | $104,500 | $79 | 73 |
| 20750 Sycamore St | 0.06mi | 3/1.0 | 1,506 (+12%) | 5mo | $190,000 | $126 | 69 |
| 13270 Main St | 0.28mi | 3/2.0 | 1,188 (-12%) | 18mo | $172,000 | $145 | 53 |
| 13459 Main St | 0.42mi | 3/1.0 | 1,221 (-9%) | 14mo | $104,500 | $86 | 50 |
| 20210 Oak St | 0.61mi | 4/2.0 (+1) | 1,464 (+9%) | 3mo | $160,000 | $109 | 49 |
| 13430 Washington St | 0.50mi | 3/1.5 | 1,200 (-11%) | 16mo | $165,000 | $138 | 43 |
| 20572 Russ St | 0.48mi | 3/1.0 | 1,443 (+7%) | 24mo | $172,000 | $119 | 42 |
| 20115 Taylor St | 0.71mi | 4/2.0 (+1) | 1,464 (+9%) | 16mo | $186,400 | $127 | 34 |
Match score weights: distance 35% · size 25% · config 20% · recency 20%. Top-matched comps best support the ARV.
Projected returns pro-forma
-3.0% appreciation · 3.0% rent growth · sell at horizon
- IRR
- -6.9%
- Equity multiple
- 0.74×
- Total profit
- $-7,916
- Equity at exit
- $16,401
- IRR
- 2.7%
- Equity multiple
- 1.19×
- Total profit
- $5,916
- Equity at exit
- $9,511
Cash invested: $30,800 (down + closing). Projections, not guarantees.
Landlord ↔ Tenant lean methodology
- Overall (STATE)
- 73 Landlord-Friendly
- State Ohio
- 73 Landlord-Friendly · R+6
- County
- — inherits STATE
- City
- — inherits STATE
ZIP-level market 43569
- Home prices YoY
- -19.4%
- Active inventory
- 7
- Price-to-rent
- 7.9×
Monthly cashflow live
- Estimated rent
- $1,160 medium interval (Pro) →
- Mortgage (P&I)
- −$577
- Tax from tax record
- −$138 /mo · $1,659/yr
- Insurance
- −$46
- HOA
- −$0
- Vacancy / Maint / Mgmt
- −$244
- Net cashflow
- $155
Break-even live
UW: 25.0% down · 7.5% · 30yr · 1.5% tax · 5.0% vac · 8.0% maint · 8.0% mgmt
Financing live
Cash to close
- Down payment
- $27,500
- Closing costs
- $3,300
- Reserves months
- —
- Total cash needed
- —
Loan-product check · same deal, 3 products live
Conventional
25% down · 7.5% · 30yr
- Down + closing
- —
- Monthly P&I
- —
- Monthly cashflow
- —
- DSCR
- —
- Eligible?
- —
Personal DTI + credit; lowest rate.
DSCR
20% down · 8.5% · 30yr
- Down + closing
- —
- Monthly P&I
- —
- Monthly cashflow
- —
- DSCR
- —
- Eligible?
- —
No personal income docs; deal must DSCR.
Hard money
10% down · 12.0% · 12mo
- Down + closing
- —
- Monthly P&I
- —
- Monthly cashflow
- —
- DSCR
- —
- Eligible?
- —
Short-term bridge; refi at stabilization.
Listing history 14 events
-
2026-06-03statusdays on market $110,000 Pending 28 DOM
-
2026-06-02days on market $110,000 Active 27 DOM
-
2026-06-01days on market $110,000 Active 26 DOM
-
2026-05-31days on market $110,000 Active 25 DOM
-
2026-05-30days on market $110,000 Active 24 DOM
-
2026-05-04$110,000 Active 495-char remark
-
2025-10-14price $100,000 423-char remark
Show marketing remark (423 chars)
This comfortable home across from park has been totally remodeled. New windows, master bdrm & bath added in '08, kitchen in '10 & water heater in '14. The wood floors are the originals & have been resurfaced. Large spacious living rm & eat-in kitchen w/oak cupboards. Den has large closet & could be used as a 4th. bdrm. After seeing this well maintained home, check out the large lot w/shed & deck.
-
2019-05-10soldstatus $115,000
-
2018-11-15historical
-
2018-08-03$112,800
-
2015-02-20soldstatus $100,000
-
2015-02-18soldstatus $100,000 423-char remark
Show marketing remark (423 chars)
This comfortable home across from park has been totally remodeled. New windows, master bdrm & bath added in '08, kitchen in '10 & water heater in '14. The wood floors are the originals & have been resurfaced. Large spacious living rm & eat-in kitchen w/oak cupboards. Den has large closet & could be used as a 4th. bdrm. After seeing this well maintained home, check out the large lot w/shed & deck.
-
2014-09-29$104,900 423-char remark
Show marketing remark (423 chars)
This comfortable home across from park has been totally remodeled. New windows, master bdrm & bath added in '08, kitchen in '10 & water heater in '14. The wood floors are the originals & have been resurfaced. Large spacious living rm & eat-in kitchen w/oak cupboards. Den has large closet & could be used as a 4th. bdrm. After seeing this well maintained home, check out the large lot w/shed & deck.
-
2000-07-31soldstatus $50,000
ⓘ Source: listings_history table (triggers on properties + properties_extension) + one-shot
backfill from property_details.listing_events for pre-trigger history.
Tax reassessment forecast OH · Partial reset (capped growth)
- Current annual tax
- $1,659 · $138/mo
- Projected year-2 tax
- $1,688 · $141/mo
- Expected delta
- +$28/yr (+$2/mo · 1.7%)
ⓘ Screening estimate from a state-policy table — verify with the county assessor before closing.
Climate risk First Street
- Flood 3/10 Moderate FEMA zone X (unshaded) · 20% chance over 30 yrs
- Wildfire 1/10 Low
- Heat 3/10 Moderate 7 d/yr ≥99°F today · 17 d/yr by 30 yrs out
- Wind 2/10 Low
- Air quality 2/10 Low 1 unhealthy d/yr today · 2 by 30 yrs out
Nearby sold comps map
Loading sold comps map…
Walkable amenities ~0.75 mi
Loading nearby amenities…
Taxation est. · year 1
- Rental income
- $13,918
- − Mortgage interest
- −$6,162
- − Property taxes
- −$1,659
- − Insurance
- −$550
- − Repairs & maintenance
- −$1,113
- − Management
- −$1,113
- − Depreciation
- −$3,200
- Taxable income
- $120
- Est. tax owed @ 24.0%
- −$29
- After-tax cash flow
- $1,835/yr
For passive investors: Depreciation is non-cash, so a rental often shows a tax loss while cash-flowing — sheltering income. Rental losses are passive: they offset passive income freely, and up to $25,000/yr can offset ordinary (W-2) income if you actively participate and your MAGI is under $100k (phasing out to $0 by $150k); unused losses carry forward. On sale, claimed depreciation is recaptured at up to 25%, and gains may owe capital-gains tax (a 1031 exchange can defer both). Figures are a year-1 estimate at your 24.0% rate — not tax advice; consult a CPA.
Schools (NCES district)
- District
- Otsego Local
- NCES district ID
- 3905072
- Math proficiency
- 59% ▼ -10.00%
- Reading proficiency
- 65% ▼ -5.00%
- Median HH income
- $65,653
- Composite
- 54.22/100
- National rank
- #1377
- State rank
- #231 of 656 in OH
Livability — Weston
- Score
- 64/100
- State rank
- #761
- US rank
- #13706
Category grades
Schools grade is shown separately in the Schools card above.
Census & demographics
- Census place
- Weston, OH
- County
- Wood · 127,168 people
- City population
- 2,804
- Metro
- Toledo, OH
- Population (ZIP)
- 2,804
- Household income
- $64,783
- Rent vs Own
- Severe rent burden
- 7.2
Population outlook (Wood County) Hauer SSP2
- Today (2025)
- 138,744 people
- By 2030
- 143,189 · +3.2%
- By 2040
- 150,896 · +8.8%
- By 2050
- 158,589 · +14.3%
- By 2075
- 182,166 · +31.3%
- By 2100
- 196,533 · +41.7%
Race, ethnicity, and origin ACS 2023
- Neighborhood character
- Predominantly White (82%)
- Race & ethnicity
- White 82% Hispanic / Latino 12% Two or more races 7%
- Hispanic origin (detail)
- Mexican 10%
- Common ancestry
- Slovak 2% Romanian 1% Iranian 1%
- Foreign-born
- 4% · Canada
- Languages at home
- 94% English-only · Spanish 6%
Political lean MEDSL · Wood
- 2024 margin
- R (+10.2) · D 44.4% · R 54.6%
- 2008→2024 swing
- -17.3pp toward R · 2008: 7.1pp · 2024: -10.2pp
- All cycles
- 2024: R+10.2 2020: R+7.6 2016: R+8.5 2012: D+4.2 2008: D+7.1
Not yet ingested
- Civics
- —
Market trends
- HPI YoY
- ▼ -54.45%
- Current HPI
- 226.1011
- Rent YoY
- —
- Metro
- —
- State GDP YoY
- ▲ 1.98%
- F500 in state
- 48
Industry mix (Fortune 500 HQ in OH)
| Industry | F500 HQs | Revenue |
|---|---|---|
| Insurance | 3 | $145B |
|
||
| Industrial Machinery | 3 | $49B |
|
||
| Financial Services | 3 | $24B |
|
||
| Consumer Goods | 2 | $93B |
|
||
| Aerospace / Defense | 2 | $47B |
|
||
| Utilities | 2 | $33B |
|
||
Price history
+120.0% since first listed10 events — show timeline
- 2026-06-03 Pending — NORIS
- 2026-05-04 Listed $110,000 NORIS
- 2025-10-14 Price Changed $100,000 NORIS
- 2019-05-10 Sold (Public Records) $115,000 Public Records
- 2018-11-15 Listing Removed — NORIS
- 2018-08-03 Listed $112,800 NORIS
- 2015-02-20 Sold (Public Records) $100,000 Public Records
- 2015-02-18 Sold (MLS) $100,000 NORIS
- 2014-09-29 Listed $104,900 NORIS
- 2000-07-31 Sold (Public Records) $50,000 Public Records
Property tax history
+3.1%/yrLatest (2025): $1,659 · -0.8% YoY. Source: county tax records.
Cash-flow waterfall
monthlySold comps — $/sqft
last 12 mo · ≤1 miLoading sold comps…