28180 E 12th St · Fair Oaks, OK
Flood risk 1/10 · Minimal
- FEMA flood zone
- X (unshaded)
- Chance of flooding over 30 yrs
- 0.0%
- Est. flood insurance / yr
- $507 – $1,088
Fire risk 4/10 · Minor
- Est. fire insurance / yr
- $2,463 – $4,575
Heat risk 6/10 · Moderate
- Hot days now (above 111°F)
- 7 days/yr
- Hot days in 30 yrs
- 17 days/yr
Wind risk 2/10 · Minimal
- Chance of severe wind over 30 yrs
- 3.0%
Air-quality risk 3/10 · Minor
- Unhealthy air days now
- 2 days/yr
- Unhealthy air days in 30 yrs
- 3 days/yr
Risk factors via First Street. Map © Google.
Why this score? — see what drove the B- grade
The composite is a weighted blend of 9 inputs, each scored 0–100. Each bar is that input's sub-score; the figure is the points it added to the 100-point composite (weight × sub-score).
- Cash flow +30.0/30.0
- 1% rule +10.0/10.0
- DSCR +10.0/10.0
- ARV discount +7.5/15.0
- Livability +2.9/5.0
- Rent growth +2.5/5.0
- Appreciation +1.8/10.0
- Schools +1.5/10.0
- Condition / age +1.0/5.0
$69,900
🖨 Deal sheet 📄 Offer letter ✓ Due diligence
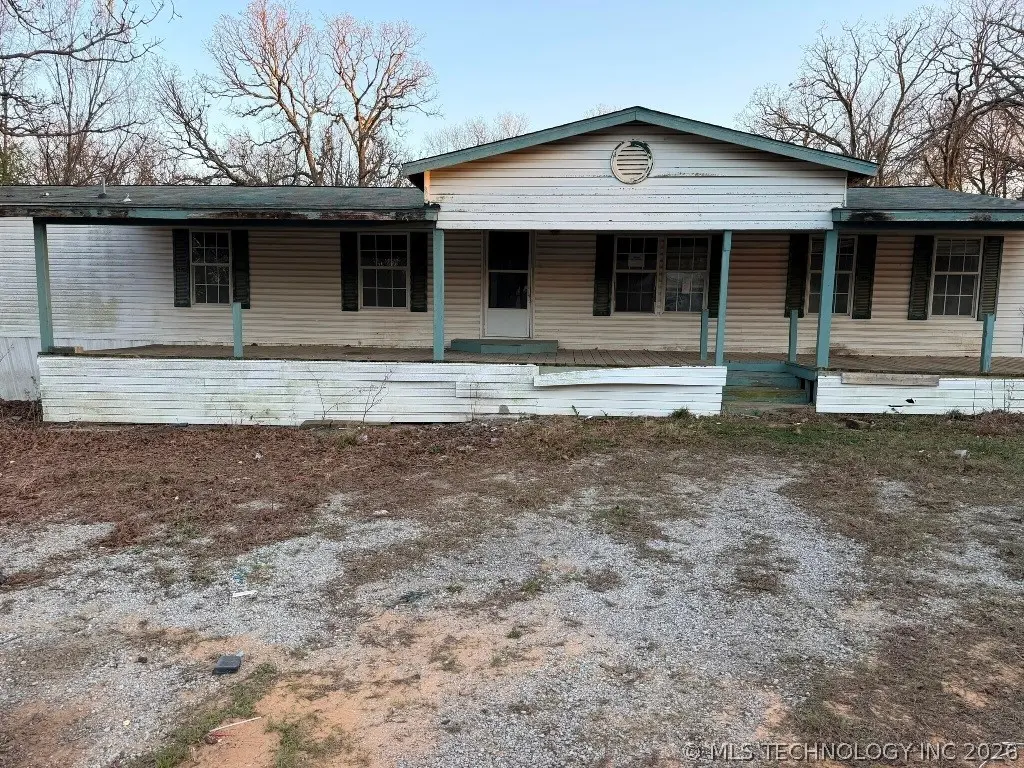
Listing remarks
Great opportunity for investors or buyers looking for their next renovation project. This spacious 3-bedroom, 3-bath double-wide mobile home sits on approximately 1.5 acres in a quiet setting surrounded by mature trees. The home features a large covered front porch and a versatile floor plan with multiple living areas, offering flexibility for both everyday living and entertaining. Bedrooms are generously sized, with potential to convert an additional living area into a 4th bedroom. Property does require repairs and is being sold as-is, but offers strong upside for those willing to put in the work. With land, space, and layout already in place, this is a great value-add opportunity for resa
Key facts
- Covered front porch
- Mature trees
- 1.5 acre lot
Tags
Property features AI
Exterior
- Security: No safety shelter
- Utilities: Rural water
- Home design: Manufactured home (double wide); Single-story; Faces north; Tie-down foundation
- Construction: Manufactured construction with vinyl siding; Asphalt/fiberglass roof
- Exterior features: Covered patio and porch; Porch; Mature trees on the lot; No other exterior features listed
Interior
- Kitchen: Range
- Flooring: Carpet; Laminate
- Bathrooms: 3 full bathrooms
- Heating & cooling: Electric heating with multiple heating units; Multiple cooling units
- Interior features: Aluminum frame windows; Laminate countertops; No additional interior features listed
Neighborhood map
What this means for you Summary
Snapshot
- This is a 3-bed/3.0-bath manufactured listed at $70k. Condition is rated poor.
Deal economics
- At list price, monthly cash flow is $581 ($7k/yr) — positive.
- The deal already cash-flows at list — no discount required.
- Meets the 1% rule at list price ($1k rent vs $70k).
- Recommended offer: $66k (6.0% below list) — sets the bar for market timing.
Location & tenants
- Location reads 58/100 on livability (#435 in OK) — a working-class tenant base; expect higher turnover. Strengths: cost of living A+, housing B; Watch: crime C-, schools F, amenities F.
- Catoosa (suburban): math 15% / reading 18% proficiency, ranked #195 of 270 in OK (top 72%) — low school quality limits family demand, transient renter base, plan for 1-2y turnover.
- Market conditions: 76 active listings in the ZIP; 581 units permitted in Wagoner County in 2024 (0 in 5+ unit buildings).
Forward outlook
- Local home prices are declining (-3.0%/yr); year-one equity from $483 of loan paydown is wiped out by about $2k of value loss. Plan a longer hold.
- Wagoner County population projected at +16% by 2050 — long-run rental-demand tailwind backs the buy-and-hold thesis.
- At projected returns (-3.0% appreciation + 3.0% rent growth), your $20k cash investment doubles in ~4 years — after that, you're playing with house money.
Negotiation context
- It's been on market 82 days — a 6% lower offer ($66k) is reasonable based on typical stale-listing flexibility.
- 3 sale attempts; this cycle's ask has dropped $15k (18%) from the opening price — seller is motivated, your offer sets the floor, not the list.
Risks & watch-outs
- Climate carrying-cost: extreme-heat days projected 7→17/yr by 2055 (HVAC capex compounding) — expect insurance premiums to compound above CPI over the hold.
Questions for the listing agent
- It's been on market 82 days. Have you received any prior offers? Is the seller open to a 6% concession, seller financing, or rate buy-down credit?
- Have any recent inspections been done? Can we get a copy of the seller's disclosures and any deferred-maintenance estimates?
- Why hasn't it sold? Are there any deal-killer items the seller is aware of (foundation, flood, title, zoning, code violations)?
- Is there a deadline driving the sale (1031 exchange, divorce, estate, relocation)? That informs how much negotiation room exists.
- Schools are F-rated, which usually means shorter tenancies and higher turnover. Who's the typical renter profile here, and what's been the actual vacancy rate?
- What's the average days-on-market for RENTAL listings here right now (not sales)? A rising rental-DOM trend means longer vacancies and softer asking-rent achievability than the comps imply.
- What's the recent tenant-quality profile in this submarket — average credit score on applications, eviction rate, late-payment / NSF rate, and stable-employment percentage? A property-management company in the area should have these aggregated.
- How much new for-sale + rental construction is in the pipeline within 1–3 miles? Heavy new supply typically softens prices + rents 12–24 months out; constrained supply supports both.
Investment metrics
- 1% rule
- 1.93% ✓
- Cap rate
- 16.27%
- Cash-on-cash
- 35.62%
- DSCR
- 2.59
- GRM
- 4.3
CMA / ARV
- ARV (on-the-fly)
- $266,328
- Comps found
- 1
Show comp detail 1 sale within ~0.75 mi
| Address | Dist | Beds/Ba | Sqft | Sold | Price | $/sf | Match |
|---|---|---|---|---|---|---|---|
| 28290 E 11th St | 0.13mi | 4/2.5 (+1) | 1,792 (-8%) | 1mo | $245,000 | $137 | 73 |
Match score weights: distance 35% · size 25% · config 20% · recency 20%. Top-matched comps best support the ARV.
Projected returns pro-forma
-3.0% appreciation · 3.0% rent growth · sell at horizon
- IRR
- 31.3%
- Equity multiple
- 2.31×
- Total profit
- $25,698
- Equity at exit
- $10,422
- IRR
- 38.4%
- Equity multiple
- 4.58×
- Total profit
- $70,109
- Equity at exit
- $6,044
Cash invested: $19,572 (down + closing). Projections, not guarantees.
Landlord ↔ Tenant lean methodology
- Overall (STATE)
- 83 Strongly Landlord-Friendly
- State Oklahoma
- 83 Strongly Landlord-Friendly · R+20
- County
- — inherits STATE
- City
- — inherits STATE
ZIP-level market 74015
- Home prices YoY
- -2.0%
- Active inventory
- 76
- Price-to-rent
- 4.3×
Monthly cashflow live
- Estimated rent
- $1,347 medium interval (Pro) →
- Mortgage (P&I)
- −$367
- Tax est. 1.5%
- −$87 /mo · $1,048/yr
- Insurance
- −$29
- HOA
- −$0
- Vacancy / Maint / Mgmt
- −$283
- Net cashflow
- $581
Break-even live
UW: 25.0% down · 7.5% · 30yr · 1.5% tax · 5.0% vac · 8.0% maint · 8.0% mgmt
Financing live
Cash to close
- Down payment
- $17,475
- Closing costs
- $2,097
- Reserves months
- —
- Total cash needed
- —
Loan-product check · same deal, 3 products live
Conventional
25% down · 7.5% · 30yr
- Down + closing
- —
- Monthly P&I
- —
- Monthly cashflow
- —
- DSCR
- —
- Eligible?
- —
Personal DTI + credit; lowest rate.
DSCR
20% down · 8.5% · 30yr
- Down + closing
- —
- Monthly P&I
- —
- Monthly cashflow
- —
- DSCR
- —
- Eligible?
- —
No personal income docs; deal must DSCR.
Hard money
10% down · 12.0% · 12mo
- Down + closing
- —
- Monthly P&I
- —
- Monthly cashflow
- —
- DSCR
- —
- Eligible?
- —
Short-term bridge; refi at stabilization.
Listing history 20 events
-
2026-06-18days on market $69,900 Active 82 DOM
-
2026-06-17days on market $69,900 Active 81 DOM
-
2026-06-16days on market $69,900 Active 80 DOM
-
2026-06-15days on market $69,900 Active 79 DOM
-
2026-06-13days on market $69,900 Active 77 DOM
-
2026-06-13pricedays on market $69,900 Active 76 DOM
-
2026-06-10days on market $74,900 Active 74 DOM
-
2026-06-09days on market $74,900 Active 73 DOM
-
2026-06-08days on market $74,900 Active 72 DOM
-
2026-06-07days on market $74,900 Active 71 DOM
-
2026-06-03days on market $74,900 Active 67 DOM
-
2026-06-02days on market $74,900 Active 66 DOM
-
2026-06-01days on market $74,900 Active 65 DOM
-
2026-05-31days on market $74,900 Active 64 DOM
-
2026-05-05price $74,900
-
2026-03-27$84,900 Active
-
2025-05-19historical
-
2025-05-06status Active
-
2025-04-26status Pending
-
2025-04-17$97,500 Active
ⓘ Source: listings_history table (triggers on properties + properties_extension) + one-shot
backfill from property_details.listing_events for pre-trigger history.
Climate risk First Street
- Flood 1/10 Low FEMA zone X (unshaded) · 0% chance over 30 yrs
- Wildfire 4/10 Moderate
- Heat 6/10 Major 7 d/yr ≥111°F today · 17 d/yr by 30 yrs out
- Wind 2/10 Low 3% chance of damaging wind over 30 yrs
- Air quality 3/10 Moderate 2 unhealthy d/yr today · 3 by 30 yrs out
Nearby sold comps map
Loading sold comps map…
Walkable amenities ~0.75 mi
Loading nearby amenities…
Taxation est. · year 1
- Rental income
- $16,163
- − Mortgage interest
- −$3,915
- − Property taxes
- −$1,048
- − Insurance
- −$350
- − Repairs & maintenance
- −$1,293
- − Management
- −$1,293
- − Depreciation
- −$2,033
- Taxable income
- $6,230
- Est. tax owed @ 24.0%
- −$1,495
- After-tax cash flow
- $5,477/yr
For passive investors: Depreciation is non-cash, so a rental often shows a tax loss while cash-flowing — sheltering income. Rental losses are passive: they offset passive income freely, and up to $25,000/yr can offset ordinary (W-2) income if you actively participate and your MAGI is under $100k (phasing out to $0 by $150k); unused losses carry forward. On sale, claimed depreciation is recaptured at up to 25%, and gains may owe capital-gains tax (a 1031 exchange can defer both). Figures are a year-1 estimate at your 24.0% rate — not tax advice; consult a CPA.
Condition & rehab AI · 12 photos
This mobile home requires extensive repairs and maintenance, including exterior painting, landscaping, and interior updates. Significant value can be added through these improvements.
Repairs flagged
- Major siding — Weathered and missing
- Major trim — Missing and damaged
- Major flooring — Dirty and worn
- Major paint — Peeling and damaged
- Major landscaping — Overgrown and debris
Value-add opportunities
- Both exterior painting — Enhances curb appeal and value
- Both landscaping — Improves curb appeal and value
- Both interior painting — Enhances interior appearance and value
- Both flooring replacement — Improves functionality and value
- Both roof inspection — Ensures structural integrity and value
Renovation cost estimate screening
| Repair item | Severity | Est. cost |
|---|---|---|
| siding · Weathered and missing | Major | $15,000–50,000 |
| trim · Missing and damaged | Major | $15,000–50,000 |
| flooring · Dirty and worn | Major | $15,000–50,000 |
| paint · Peeling and damaged | Major | $15,000–50,000 |
| landscaping · Overgrown and debris | Major | $15,000–50,000 |
| Total estimated repair cost · 5 items | $75,000–250,000 |
Value-add ROI direction
- Both exterior painting — Enhances curb appeal and value ↑
- Both landscaping — Improves curb appeal and value ↑
- Both interior painting — Enhances interior appearance and value ↑
- Both flooring replacement — Improves functionality and value ↑
- Both roof inspection — Ensures structural integrity and value ↑
ⓘ Cost ranges are severity-bucket heuristics (US national rule-of-thumb). Get contractor quotes + a written scope before underwriting a rehab budget.
Schools (NCES district)
- District
- Catoosa
- NCES district ID
- 4006870
- Math proficiency
- 15% ▼ -12.00%
- Reading proficiency
- 18% ▼ -8.00%
- Median HH income
- $52,968
- Composite
- 15.29/100
- National rank
- #9330
- State rank
- #195 of 270 in OK
Livability — Fair Oaks
- Score
- 58/100
- State rank
- #435
- US rank
- #21220
Category grades
Schools grade is shown separately in the Schools card above.
Census & demographics
- Population (ZIP)
- 8,653
Population outlook (Wagoner County) Hauer SSP2
- Today (2025)
- 84,796 people
- By 2030
- 88,162 · +4.0%
- By 2040
- 93,882 · +10.7%
- By 2050
- 98,219 · +15.8%
- By 2075
- 106,561 · +25.7%
- By 2100
- 109,360 · +29.0%
Race, ethnicity, and origin ACS 2023
- Neighborhood character
- Diverse neighborhood (Simpson 0.59)
- Race & ethnicity
- White 63% Two or more races 17% Native American 12% Hispanic / Latino 11% Asian 2%
- Hispanic origin (detail)
- Mexican 8%
- Common ancestry
- Slovak 3% Lithuanian 2% Italian 2%
- Foreign-born
- 4% · Canada, Jamaica
- Languages at home
- 88% English-only · Spanish 9% Other Asian/Pacific 2%
Political lean MEDSL · Wagoner
- 2024 margin
- Solid R (+49.8) · D 24.2% · R 74.0% · Other 1.8%
- 2008→2024 swing
- -8.0pp toward R · 2008: -41.8pp · 2024: -49.8pp
- All cycles
- 2024: R+49.8 2020: R+50.1 2016: R+52.0 2012: R+45.7 2008: R+41.8
Not yet ingested
- Civics
- —
Market trends
- HPI YoY
- ▼ -6.46%
- Current HPI
- 310.9
- Rent YoY
- —
- Metro
- —
- State GDP YoY
- ▲ 1.55%
- F500 in state
- 6
Industry mix (Fortune 500 HQ in OK)
| Industry | F500 HQs | Revenue |
|---|---|---|
| Energy | 3 | $48B |
|
||
Price history
-23.2% since first listed6 events — show timeline
- 2026-05-05 Price Changed $74,900 MLS Technology, Inc.
- 2026-03-27 Listed $84,900 MLS Technology, Inc.
- 2025-05-19 Listing Removed — MLS Technology, Inc.
- 2025-05-06 Relisted — MLS Technology, Inc.
- 2025-04-26 Pending — MLS Technology, Inc.
- 2025-04-17 Listed $97,500 MLS Technology, Inc.
Cash-flow waterfall
monthlySold comps — $/sqft
last 12 mo · ≤1 miLoading sold comps…