 Duplex
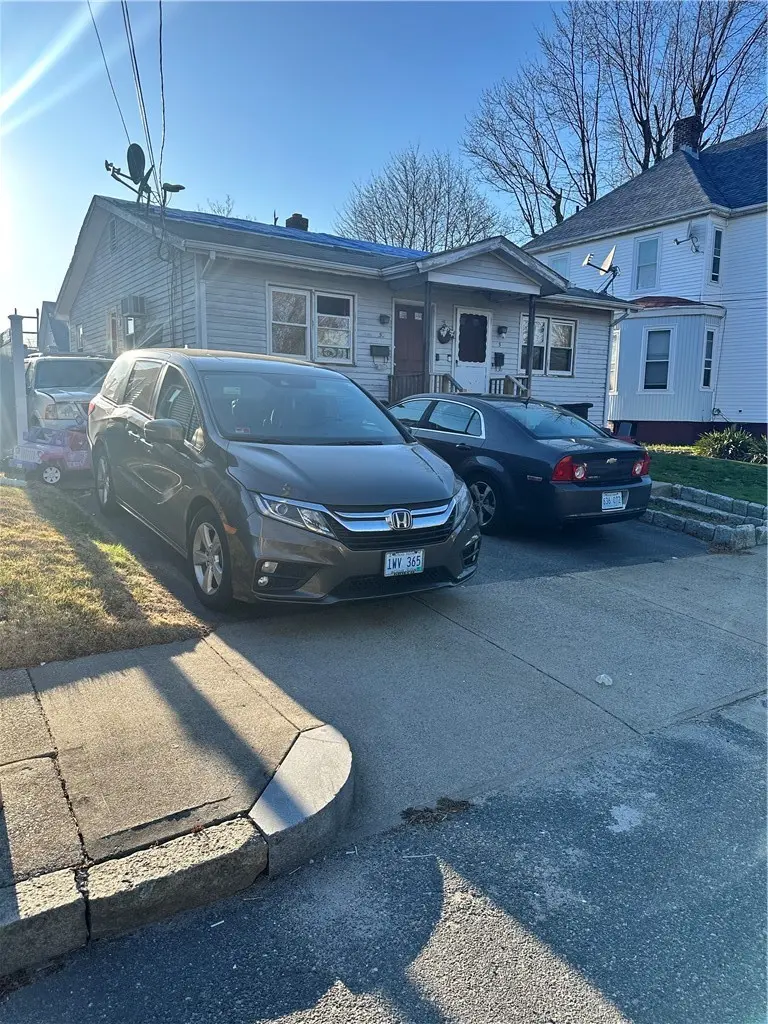
5 Washington Ave · Cranston, RI
Flood risk 1/10 · Minimal
- FEMA flood zone
- X (unshaded)
- Chance of flooding over 30 yrs
- 0.0%
- Est. flood insurance / yr
- $507 – $1,088
Fire risk 1/10 · Minimal
- Est. fire insurance / yr
- $835 – $1,551
Heat risk 5/10 · Moderate
- Hot days now (above 96°F)
- 7 days/yr
- Hot days in 30 yrs
- 15 days/yr
Wind risk 6/10 · Moderate
- Chance of severe wind over 30 yrs
- 71.0%
Air-quality risk 2/10 · Minimal
- Unhealthy air days now
- 1 days/yr
- Unhealthy air days in 30 yrs
- 2 days/yr
Risk factors via First Street. Map © Google.
Why this score? — see what drove the B- grade
The composite is a weighted blend of 9 inputs, each scored 0–100. Each bar is that input's sub-score; the figure is the points it added to the 100-point composite (weight × sub-score).
- Cash flow +30.0/30.0
- DSCR +10.0/10.0
- 1% rule +9.1/10.0
- ARV discount +7.5/15.0
- Livability +4.4/5.0
- Rent growth +3.1/5.0
- Condition / age +2.5/5.0
- Schools +2.3/10.0
- Appreciation +0.0/10.0
$275,000
🖨 Deal sheet 📄 Offer letter ✓ Due diligence
Multi-family units
County records classify this as Multi-Family (2-4 Unit). Listing-text estimate: 2 units. confirmed
Listing remarks
Side-by-side duplex in Cranston offered as a cash-only sale. Property needs work but presents strong potential for investment income. Each unit benefits from a large, fenced-in backyard, ideal for children, pets, and added privacy. Great opportunity for contractors, investors, or anyone looking to add value and build equity. Please submit all offers by Sunday 5PM 4/12/26
Key facts
- Side-by-side duplex
- 5,000 sq ft lot
- 4 parking spots
Tags
Property features AI
Finance
- Financial info: Operating expenses reported at $4,500; One-bedroom unit currently rented for $900 (actual rent)
- HOA & community: Close to highway access, public transportation, schools, shopping and restaurants
Exterior
- Parking: No garage; Space for 4 vehicles (total)
- Utilities: Public water connected; Public sewer connected; 100 amp electric service; Tenant pays hot water
- Home design: Single-story building; Concrete perimeter foundation
- Construction: Clapboard exterior with drywall interior
- Exterior features: Fenced yard; Above-ground pool
Interior
- Kitchen: Oven; Range; Refrigerator
- Bedrooms: One-bedroom unit (1 bedroom); Three-bedroom unit (3 bedrooms)
- Flooring: Carpet; Ceramic tile; Laminate
- Bathrooms: Three full bathrooms total across units; One full bathroom in the one-bedroom unit; Two full bathrooms in the three-bedroom unit
- Heating & cooling: Gas heating with baseboard and forced air
- Interior features: Tub/shower; Partially finished basement with interior and exterior entry
- Laundry & utility: In-unit laundry
Neighborhood map
What this means for you Summary
Snapshot
- This is a 2 × 2-bed/1.5-bath units multifamily listed at $275k.
Deal economics
- At list price, monthly cash flow is $1k ($14k/yr) — positive. Per door: $565/mo.
- The deal already cash-flows at list — no discount required.
- Meets the 1% rule at list price ($4k rent vs $275k).
- Cap rate 11.2% vs local median 3.3% in Cranston — top-decile yield for the area; either an underpriced asset or a hidden risk that comps aren't pricing in. Stress-test before assuming the spread holds.
Location & tenants
- Location reads 87/100 on livability (#1 in RI, #323 nationally) — a professional / high-income tenant draw. Strengths: crime A+, employment A+, housing A+.
- Cranston (suburban): math 16% / reading 35% proficiency, ranked #23 of 39 in RI (top 59%) — low school quality limits family demand, transient renter base, plan for 1-2y turnover.
- Market conditions: Rents rising (+2.4%/yr); 124 active listings in the ZIP; 25 comparable units currently listed for rent nearby; rentals at typical pace (median 19d on market — plan ~3-4 weeks tenant-placement turnaround); solid renter incomes; 776 units permitted in Providence County in 2024 (229 in 5+ unit buildings).
- At $3,876/mo this rent would consume 58% of the median local household income ($81k/yr) (locally 985% of renters already pay >50% of income on rent) — very limited rent-growth headroom before tenants either downsize or default.
Forward outlook
- Local home prices are declining (-3.0%/yr); year-one equity from $2k of loan paydown is wiped out by about $8k of value loss. Plan a longer hold.
- Providence County population projected at +5% by 2050 — modest demand growth; plan on rents tracking national, not racing it.
- At projected returns (-3.0% appreciation + 2.4% rent growth), your $77k cash investment doubles in ~8 years — after that, you're playing with house money.
Negotiation context
- Only 5 days on market — expect competitive offers; lowballing is unlikely to land.
- 3 sale attempts since 30y ago with the ask held roughly flat each time — persistent listings suggest the price (not the market) is what's stuck; bring a comps-based counter.
- Current owner paid $160k; list at $275k implies a 72% gain — meaningful room to come down on a strong offer.
Risks & watch-outs
- Climate carrying-cost: major wind risk, 71% chance of damaging wind over 30y; extreme-heat days projected 7→15/yr by 2055 (HVAC capex compounding) — expect insurance premiums to compound above CPI over the hold.
Questions for the listing agent
- Can we see the unit-by-unit rent roll, current vacancy, and any below-market leases? What's the average tenancy length?
- What capital expenditures (roof, boiler, parking lot, exteriors) have been made in the last 5 years, and what's planned in the next 2?
- Is there a deadline driving the sale (1031 exchange, divorce, estate, relocation)? That informs how much negotiation room exists.
- What's the average days-on-market for RENTAL listings here right now (not sales)? A rising rental-DOM trend means longer vacancies and softer asking-rent achievability than the comps imply.
- What's the recent tenant-quality profile in this submarket — average credit score on applications, eviction rate, late-payment / NSF rate, and stable-employment percentage? A property-management company in the area should have these aggregated.
- How much new apartment / multifamily construction is in the pipeline within 1–3 miles? Heavy new supply (>2% of stock underway) typically softens rents 12–24 months out; light construction supports rent growth.
Investment metrics
- 1% rule
- 1.41% ✓
- Cap rate
- 11.22%
- Cash-on-cash
- 17.61%
- DSCR
- 1.78
- GRM
- 5.9
CMA / ARV
No comps found within radius.
Projected returns pro-forma
-3.0% appreciation · 2.42% rent growth · sell at horizon
- IRR
- 8.4%
- Equity multiple
- 1.33×
- Total profit
- $25,221
- Equity at exit
- $41,003
- IRR
- 17.1%
- Equity multiple
- 2.37×
- Total profit
- $105,810
- Equity at exit
- $23,777
Cash invested: $77,000 (down + closing). Projections, not guarantees.
Landlord ↔ Tenant lean methodology
- Overall (STATE)
- 31 Tenant-Leaning
- State Rhode Island
- 31 Tenant-Leaning · D+8
- County
- — inherits STATE
- City
- — inherits STATE
ZIP-level market 02920
- Rents YoY
- 2.4%
- Active inventory
- 124
- Price-to-rent
- 11.8×
Monthly cashflow live
- Estimated rent
- $3,876 high interval (Pro) →
- Mortgage (P&I)
- −$1,442
- Tax from tax record
- −$376 /mo · $4,507/yr
- Insurance
- −$115
- HOA
- −$0
- Vacancy / Maint / Mgmt
- −$814
- Net cashflow
- $1,130
Break-even live
2-unit breakdown (identical units grouped — click to expand)
| Units | Beds | Baths | Est. rent |
|---|---|---|---|
| 2× units | 2 | 1.5 | $3,876 |
| #1 | 2 | 1.5 | $1,938 |
| #2 | 2 | 1.5 | $1,938 |
| Total (2 units) | $3,876 | ||
UW: 25.0% down · 7.5% · 30yr · 1.5% tax · 5.0% vac · 8.0% maint · 8.0% mgmt
Financing live
Cash to close
- Down payment
- $68,750
- Closing costs
- $8,250
- Reserves months
- —
- Total cash needed
- —
Loan-product check · same deal, 3 products live
Conventional
25% down · 7.5% · 30yr
- Down + closing
- —
- Monthly P&I
- —
- Monthly cashflow
- —
- DSCR
- —
- Eligible?
- —
Personal DTI + credit; lowest rate.
DSCR
20% down · 8.5% · 30yr
- Down + closing
- —
- Monthly P&I
- —
- Monthly cashflow
- —
- DSCR
- —
- Eligible?
- —
No personal income docs; deal must DSCR.
Hard money
10% down · 12.0% · 12mo
- Down + closing
- —
- Monthly P&I
- —
- Monthly cashflow
- —
- DSCR
- —
- Eligible?
- —
Short-term bridge; refi at stabilization.
Rent comps 25 comps
| Address | Beds | Baths | Sqft | Rent | $/sqft | DOM | Units | Dist |
|---|---|---|---|---|---|---|---|---|
| 8 Anthony Ave Unit 1 Providence, RI | 3.0 | 2.0 | 1400 | $2,800 | $2.00 | 14d | 1 | 0.28mi |
| 304 Webster Ave Cranston, RI | 2.0 | 1.0 | 1144 | $1,850 | $1.62 | 10d | 1 | 0.38mi |
| 37 Sumner Ave Unit 2 Cranston, RI | 2.0 | 1.0 | 800 | $1,600 | $2.00 | 16d | 1 | 0.44mi |
| 348 Union Ave Unit 1 Providence, RI | 2.0 | 1.0 | 900 | $1,900 | $2.11 | 14d | 1 | 0.47mi |
| 56 Greenwich St Unit 1 Providence, RI | 3.0 | 2.0 | 1400 | $2,800 | $2.00 | 23d | 1 | 0.66mi |
| 29 Dunford St Unit 2 Providence, RI | 3.0 | 2.0 | 1116 | $2,400 | $2.15 | 23d | 1 | 0.82mi |
| 20 Pavilion Ct Unit 22 Cranston, RI | 2.0 | 1.5 | 1400 | $2,500 | $1.79 | 43d | 1 | 0.85mi |
| 78 Old Oak Ave Unit 2 Cranston, RI | 2.0 | 1.0 | 880 | $1,700 | $1.93 | 43d | 1 | 0.87mi |
| 151 Chestnut Hill Ave Cranston, RI | 2.0 | 1.0 | 1114 | $2,795 | $2.51 | 44d | 1 | 0.93mi |
| 50 Murray St Unit 9 Providence, RI | 2.0 | 1.5 | 886 | $2,500 | $2.82 | 1d | 1 | 1.06mi |
| 50 Murray St Unit 19 Providence, RI | 2.0 | 1.5 | 1130 | $2,750 | $2.43 | 15d | 1 | 1.06mi |
| 50 Murray St Unit 20 Providence, RI | 2.0 | 1.5 | 1130 | $2,750 | $2.43 | 11d | 1 | 1.06mi |
| 50 Murray St Unit 19 Providence, RI | 2.0 | 1.5 | 1130 | $2,750 | $2.43 | 1d | 1 | 1.06mi |
| 1303 Cranston St Unit 1 Cranston, RI | 3.0 | 1.0 | 1356 | $2,750 | $2.03 | 43d | 1 | 1.07mi |
| 50 Murray St Unit 2 Providence, RI | 2.0 | 1.5 | 860 | $2,500 | $2.91 | 43d | 1 | 1.09mi |
| 50 Murray St Unit 10 Providence, RI | 2.0 | 1.5 | 860 | $2,500 | $2.91 | 19d | 1 | 1.09mi |
| 50 Murray St Unit 21 Providence, RI | 2.0 | 1.5 | 1130 | $2,750 | $2.43 | 20d | 1 | 1.09mi |
| 50 Murray St Unit 2 Providence, RI | 2.0 | 1.5 | 840 | $2,350 | $2.80 | 1d | 1 | 1.09mi |
| 28 Cleveland Ave Unit 3 Cranston, RI | 2.0 | 1.0 | 1000 | $1,695 | $1.70 | 23d | 1 | 1.10mi |
| 718 Dyer Ave Cranston, RI | 3.0 | 1.5 | 1250 | $1,900 | $1.52 | 16d | 1 | 1.11mi |
| 718 Dyer Ave Cranston, RI | 3.0 | 1.5 | 1233 | $1,900 | $1.54 | 23d | 1 | 1.11mi |
| 1336 Cranston St Fl Rear Cranston, RI | 2.0 | 2.0 | 1000 | $2,095 | $2.10 | 10d | 1 | 1.15mi |
| 166 Valley St Providence, RI | 2.0 | 1.0–2.0 | 733 | $2,670 | $3.64 | 2d | 7 | 1.22mi |
| 9 Sprague Ave #3 Cranston, RI | 2.0 | 1.0 | 998 | $1,700 | $1.70 | 43d | 1 | 1.24mi |
| 120 Pontiac Ave Unit 1 Cranston, RI | 3.0 | 1.0 | 1320 | $2,500 | $1.89 | 43d | 1 | 1.35mi |
Listing history 8 events
-
2026-04-14status Pending
-
2026-04-09$275,000 Active
-
2016-11-08price $79,900
-
2004-08-10soldstatus $160,000
-
1997-09-28historical
-
1997-04-07$75,432
-
1996-12-31historical
-
1996-06-10$84,900
ⓘ Source: listings_history table (triggers on properties + properties_extension) + one-shot
backfill from property_details.listing_events for pre-trigger history.
Tax reassessment forecast RI · Partial reset (capped growth)
- Current annual tax
- $4,507 · $376/mo
- Projected year-2 tax
- $4,507 · $376/mo
- Expected delta
- $0/yr ($0/mo · 0.0%)
ⓘ Screening estimate from a state-policy table — verify with the county assessor before closing.
Climate risk First Street
- Flood 1/10 Low FEMA zone X (unshaded) · 0% chance over 30 yrs
- Wildfire 1/10 Low
- Heat 5/10 Major 7 d/yr ≥96°F today · 15 d/yr by 30 yrs out
- Wind 6/10 Major 71% chance of damaging wind over 30 yrs
- Air quality 2/10 Low 1 unhealthy d/yr today · 2 by 30 yrs out
Nearby sold comps map
Loading sold comps map…
Walkable amenities ~0.75 mi
Loading nearby amenities…
Taxation est. · year 1
- Rental income
- $46,512
- − Mortgage interest
- −$15,404
- − Property taxes
- −$4,507
- − Insurance
- −$1,375
- − Repairs & maintenance
- −$3,721
- − Management
- −$3,721
- − Depreciation
- −$8,000
- Taxable income
- $9,784
- Est. tax owed @ 24.0%
- −$2,348
- After-tax cash flow
- $11,209/yr
For passive investors: Depreciation is non-cash, so a rental often shows a tax loss while cash-flowing — sheltering income. Rental losses are passive: they offset passive income freely, and up to $25,000/yr can offset ordinary (W-2) income if you actively participate and your MAGI is under $100k (phasing out to $0 by $150k); unused losses carry forward. On sale, claimed depreciation is recaptured at up to 25%, and gains may owe capital-gains tax (a 1031 exchange can defer both). Figures are a year-1 estimate at your 24.0% rate — not tax advice; consult a CPA.
Schools (NCES district)
- District
- Cranston
- NCES district ID
- 4400240
- Math proficiency
- 16% ▼ -11.00%
- Reading proficiency
- 35% ▼ -7.00%
- Median HH income
- $60,070
- Composite
- 23.36/100
- National rank
- #7910
- State rank
- #23 of 39 in RI
Livability — Cranston
- Score
- 87/100
- State rank
- #1
- US rank
- #323
Category grades
Schools grade is shown separately in the Schools card above.
Census & demographics
- Census place
- Cranston, RI
- County
- Providence County · 548,917 people
- City population
- 72,803
- Metro
- Providence-Warwick, RI-MA
- Population (ZIP)
- 37,155
- Household income
- $80,717
- Rent vs Own
- Severe rent burden
- 985.0
Population outlook (Providence County) Hauer SSP2
- Today (2025)
- 653,469 people
- By 2030
- 660,819 · +1.1%
- By 2040
- 672,747 · +3.0%
- By 2050
- 683,741 · +4.6%
- By 2075
- 720,435 · +10.2%
- By 2100
- 741,582 · +13.5%
Race, ethnicity, and origin ACS 2023
- Neighborhood character
- Majority White (65%)
- Race & ethnicity
- White 65% Hispanic / Latino 18% Two or more races 8% Asian 7% Black 7%
- Hispanic origin (detail)
- Puerto Rican 4% Dominican 6%
- Common ancestry
- Lithuanian 6% Russian 5% Slovak 2%
- Foreign-born
- 16% · Canada, China
- Languages at home
- 73% English-only · Spanish 15% Other Indo-European 5% French/Haitian/Cajun 2%
Political lean MEDSL · Providence
- 2024 margin
- D (+14.4) · D 56.1% · R 41.7% · Other 2.2%
- 2008→2024 swing
- -20.0pp toward R · 2008: 34.4pp · 2024: 14.4pp
- All cycles
- 2024: D+14.4 2020: D+22.9 2016: D+21.2 2012: D+34.9 2008: D+34.4
Not yet ingested
- Civics
- —
Market trends
- HPI YoY
- ▼ -449.22%
- Current HPI
- 334.2336
- Rent YoY
- ▲ 2.42%
- Metro
- Providence-Warwick, RI-MA
- State GDP YoY
- ▲ 2.25%
- F500 in state
- 10
Industry mix (Fortune 500 HQ in RI)
| Industry | F500 HQs | Revenue |
|---|---|---|
| Healthcare | 1 | $373B |
|
||
| Food Distribution | 1 | $31B |
|
||
| Aerospace / Defense | 1 | $14B |
|
||
| Financial Services | 1 | $8B |
|
||
| Consumer Goods | 1 | $4B |
|
||
Price history
+223.9% since first listed8 events — show timeline
- 2026-04-14 Pending — RIS
- 2026-04-09 Listed $275,000 RIS
- 2016-11-08 Price Changed $79,900 RIS
- 2004-08-10 Sold (Public Records) $160,000 Public Records
- 1997-09-28 Listing Removed — RIS
- 1997-04-07 Listed $75,432 RIS
- 1996-12-31 Listing Removed — RIS
- 1996-06-10 Listed $84,900 RIS
Property tax history
+4.0%/yrLatest (2025): $4,507 · +2.0% YoY. Source: county tax records.
Cash-flow waterfall
monthlySold comps — $/sqft
last 12 mo · ≤1 miLoading sold comps…