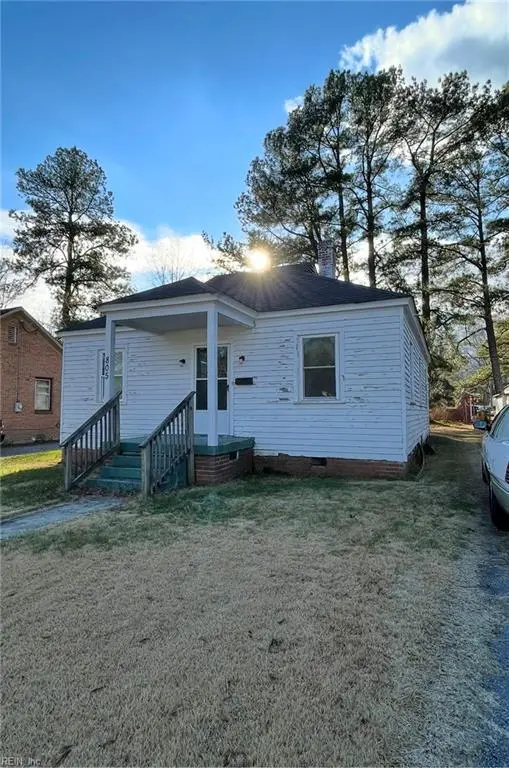
805 Chestnut St · Franklin, VA
Flood risk 1/10 · Minimal
- FEMA flood zone
- X (unshaded)
- Chance of flooding over 30 yrs
- 0.0%
- Est. flood insurance / yr
- $507 – $1,088
Fire risk 1/10 · Minimal
- Est. fire insurance / yr
- $666 – $1,236
Heat risk 8/10 · Major
- Hot days now (above 107°F)
- 7 days/yr
- Hot days in 30 yrs
- 16 days/yr
Wind risk 6/10 · Moderate
- Chance of severe wind over 30 yrs
- 71.0%
Air-quality risk 2/10 · Minimal
- Unhealthy air days now
- 0 days/yr
- Unhealthy air days in 30 yrs
- 1 days/yr
Risk factors via First Street. Map © Google.
Why this score? — see what drove the D+ grade
The composite is a weighted blend of 9 inputs, each scored 0–100. Each bar is that input's sub-score; the figure is the points it added to the 100-point composite (weight × sub-score).
- Cash flow +20.7/30.0
- DSCR +6.6/10.0
- ARV discount +5.9/15.0
- 1% rule +4.4/10.0
- Schools +3.0/10.0
- Livability +3.0/5.0
- Rent growth +2.5/5.0
- Condition / age +2.5/5.0
- Appreciation +0.0/10.0
$144,990
🖨 Deal sheet 📄 Offer letter ✓ Due diligence
Listing remarks
Add tlc to make this house your home! Potential investment opportunity. Occupied, so pre-approved buyer showings only.
Key facts
- Built 1948
- Listed 16 days
Property features AI
Finance
- HOA & community: No HOA fees noted
Exterior
- Parking: Off-street parking; Driveway space; Street parking
- Utilities: City/County water; City/County sewer; Electric water heater
- Home design: Detached bungalow; 1.5 stories; Simple ownership; Crawl foundation
- Construction: Wood exterior; Composite roof; Crawl foundation
- Exterior features: Wood siding; Composite roof
Interior
- Kitchen: Range
- Bedrooms: Bedroom with full bathroom on the first floor
- Flooring: Carpet
- Bathrooms: 1 full bathroom; 1 half bathroom
- Heating & cooling: Baseboard heating
- Interior features: Carpet flooring; Spare room
Neighborhood map
What this means for you Summary
Snapshot
- This is a 2-bed/1.0-bath single-family listed at $145k.
Deal economics
- At list price, monthly cash flow is $196 ($2k/yr) — positive.
- The deal already cash-flows at list — no discount required.
- To meet the 1% rule (rent ≥ 1% of price), the offer needs to be $136k (6.4% below list).
- Recommended offer: $136k (6.4% below list) — sets the bar for 1% rule.
- Cap rate 7.9% vs local median 3.9% in Franklin — top-decile yield for the area; either an underpriced asset or a hidden risk that comps aren't pricing in. Stress-test before assuming the spread holds.
Location & tenants
- Location reads 59/100 on livability (#461 in VA) — a working-class tenant base; expect higher turnover. Strengths: cost of living A+, housing A+, health & safety B+; Watch: crime F, amenities F, commute F.
- Franklin City Public School District (town): math 23% / reading 51% proficiency, ranked #127 of 131 in VA (top 97%) — families likely to look elsewhere, expect single-tenant / working-renter base with shorter leases; 75% free/reduced lunch — lower-income household profile, screen leases tightly.
- Zoned schools: Franklin High (math 37% / reading 82%, grade C+, #247 of 319 statewide, top 80%, 378 students, 100% FRL) — zoned schools average 100% FRL vs 75% district-wide (25 pts higher); higher-poverty schools than district average — tighter screening recommended.
- Zoned-school proficiency averages 60% at this address vs 37% district-wide (+22 pts) — the actual schools serving this property are materially stronger than the Franklin City Public School District average implies; a family-tenant draw the district grade alone would hide.
- Market conditions: 137 active listings in the ZIP; 4 comparable units currently listed for rent nearby; rentals lingering (median 44d on market — plan ~5-8 weeks vacancy on turnover, expect pricing pressure); 50% of comp listings sitting > 30 days — soft ceiling on asking rent.
Forward outlook
- Local home prices are declining (-3.0%/yr); year-one equity from $1k of loan paydown is wiped out by about $4k of value loss. Plan a longer hold.
- Franklin County population projected at -22% by 2050 — secular population decline; favor cash flow + early exit over multi-decade hold.
Negotiation context
- It's been on market 16 days — a 2% lower offer ($143k) is reasonable based on typical stale-listing flexibility.
- Current owner paid $80k; list at $145k implies a 81% gain — meaningful room to come down on a strong offer.
Risks & watch-outs
- Watch-outs: built in 1948 — expect roof / HVAC / electrical / plumbing capex.
- Climate carrying-cost: major wind risk, 71% chance of damaging wind over 30y; extreme-heat days projected 7→16/yr by 2055 (HVAC capex compounding) — expect insurance premiums to compound above CPI over the hold.
Questions for the listing agent
- Built in 1948 — when were the roof, HVAC, electrical panel, plumbing, and water heater last replaced?
- Is there a deadline driving the sale (1031 exchange, divorce, estate, relocation)? That informs how much negotiation room exists.
- Schools are B-rated — typically a magnet for longer-tenancy family renters. What's the average tenant stay here, and is there a school-zone premium baked into asking?
- Crime grade is F in this area — have there been break-ins, vandalism, or insurance claims at this property in the last 3 years? What carrier currently insures it and at what premium?
- The area grade is low — what's the realistic commute time and amenity access for the typical tenant pool here? Any planned neighborhood developments (good or bad) we should know about?
- What's the average days-on-market for RENTAL listings here right now (not sales)? A rising rental-DOM trend means longer vacancies and softer asking-rent achievability than the comps imply.
- What's the recent tenant-quality profile in this submarket — average credit score on applications, eviction rate, late-payment / NSF rate, and stable-employment percentage? A property-management company in the area should have these aggregated.
- How much new for-sale + rental construction is in the pipeline within 1–3 miles? Heavy new supply typically softens prices + rents 12–24 months out; constrained supply supports both.
Investment metrics
- 1% rule
- 0.94% ✗
- Cap rate
- 7.92%
- Cash-on-cash
- 5.80%
- DSCR
- 1.26
- GRM
- 8.9
CMA / ARV
- ARV (on-the-fly)
- $139,920
- Comps found
- 9
Show comp detail 9 sales within ~0.75 mi
| Address | Dist | Beds/Ba | Sqft | Sold | Price | $/sf | Match |
|---|---|---|---|---|---|---|---|
| 650 Hayden Dr | 0.34mi | 3/1.0 (+1) | 1,321 (+0%) | 2mo | $140,000 | $106 | 77 |
| 200 Delk St | 0.47mi | 3/2.0 (+1) | 1,300 (-2%) | 4mo | $114,900 | $88 | 64 |
| 309 Edwards St | 0.42mi | 3/1.5 (+1) | 1,360 (+3%) | 6mo | $80,000 | $59 | 63 |
| 407 Hall St | 0.36mi | 3/2.0 (+1) | 1,178 (-11%) | 4mo | $75,000 | $64 | 53 |
| 311 Washington St | 0.61mi | 3/2.0 (+1) | 1,200 (-9%) | 1mo | $240,000 | $200 | 46 |
| 310 Bogart St | 0.53mi | 3/1.0 (+1) | 1,166 (-12%) | 12mo | $70,000 | $60 | 41 |
| 302 Artis St | 0.68mi | 3/2.0 (+1) | 1,462 (+11%) | 11mo | $219,000 | $150 | 32 |
| 309 Stonewall St | 0.67mi | 3/2.5 (+1) | 1,192 (-10%) | 13mo | $190,000 | $159 | 31 |
| 400 W Third Ave | 0.72mi | 3/2.0 (+1) | 1,516 (+15%) | 11mo | $227,000 | $150 | 23 |
Match score weights: distance 35% · size 25% · config 20% · recency 20%. Top-matched comps best support the ARV.
Projected returns pro-forma
-3.0% appreciation · 3.0% rent growth · sell at horizon
- IRR
- -7.4%
- Equity multiple
- 0.73×
- Total profit
- $-11,048
- Equity at exit
- $21,618
- IRR
- 2.2%
- Equity multiple
- 1.15×
- Total profit
- $6,249
- Equity at exit
- $12,536
Cash invested: $40,597 (down + closing). Projections, not guarantees.
Landlord ↔ Tenant lean methodology
- Overall (STATE)
- 55 Moderately Landlord-Leaning
- State Virginia
- 55 Moderately Landlord-Leaning · D+2
- County
- — inherits STATE
- City
- — inherits STATE
ZIP-level market 23851
- Home prices YoY
- -10.2%
- Active inventory
- 137
- Price-to-rent
- 8.9×
Monthly cashflow live
- Estimated rent
- $1,357 medium interval (Pro) →
- Mortgage (P&I)
- −$760
- Tax from tax record
- −$55 /mo · $656/yr
- Insurance
- −$60
- HOA
- −$0
- Vacancy / Maint / Mgmt
- −$285
- Net cashflow
- $196
Break-even live
UW: 25.0% down · 7.5% · 30yr · 1.5% tax · 5.0% vac · 8.0% maint · 8.0% mgmt
Financing live
Cash to close
- Down payment
- $36,248
- Closing costs
- $4,350
- Reserves months
- —
- Total cash needed
- —
Loan-product check · same deal, 3 products live
Conventional
25% down · 7.5% · 30yr
- Down + closing
- —
- Monthly P&I
- —
- Monthly cashflow
- —
- DSCR
- —
- Eligible?
- —
Personal DTI + credit; lowest rate.
DSCR
20% down · 8.5% · 30yr
- Down + closing
- —
- Monthly P&I
- —
- Monthly cashflow
- —
- DSCR
- —
- Eligible?
- —
No personal income docs; deal must DSCR.
Hard money
10% down · 12.0% · 12mo
- Down + closing
- —
- Monthly P&I
- —
- Monthly cashflow
- —
- DSCR
- —
- Eligible?
- —
Short-term bridge; refi at stabilization.
Rent comps 4 comps
| Address | Beds | Baths | Sqft | Rent | $/sqft | DOM | Units | Dist |
|---|---|---|---|---|---|---|---|---|
| 680 Oak St Unit 111 Franklin, VA | 1.0 | 1.0 | 1252 | $1,150 | $0.92 | 1d | 1 | 0.29mi |
| 116 Holland Cir Franklin, VA | 3.0 | 1.0 | 1056 | $1,800 | $1.70 | 43d | 1 | 0.52mi |
| 2300 South St Unit 1 Franklin, VA | 3.0 | 1.0 | 1350 | $1,600 | $1.19 | 43d | 1 | 1.08mi |
| 313 Council Rd Franklin, VA | 3.0 | 1.0 | 1000 | $975 | $0.97 | 19d | 1 | 1.23mi |
Listing history 13 events
-
2026-06-18days on market $144,990 Active 16 DOM
-
2026-06-17days on market $144,990 Active 15 DOM
-
2026-06-16days on market $144,990 Active 14 DOM
-
2026-06-15days on market $144,990 Active 13 DOM
-
2026-06-15days on market $144,990 Active 12 DOM
-
2026-06-13days on market $144,990 Active 11 DOM
-
2026-06-12days on market $144,990 Active 10 DOM
-
2026-06-09days on market $144,990 Active 7 DOM
-
2026-06-08days on market $144,990 Active 6 DOM
-
2026-06-08days on market $144,990 Active 5 DOM
-
2026-06-05days on market $144,990 Active 3 DOM
-
2026-06-02remarks 118-char remark
-
2026-06-02$144,990 Active 1 DOM
ⓘ Source: listings_history table (triggers on properties + properties_extension) + one-shot
backfill from property_details.listing_events for pre-trigger history.
Tax reassessment forecast VA · Resets to sale price
- Current annual tax
- $656 · $55/mo
- Projected year-2 tax
- $1,189 · $99/mo
- Expected delta
- +$533/yr (+$44/mo · 81.2%)
ⓘ Screening estimate from a state-policy table — verify with the county assessor before closing.
Climate risk First Street
- Flood 1/10 Low FEMA zone X (unshaded) · 0% chance over 30 yrs
- Wildfire 1/10 Low
- Heat 8/10 Severe 7 d/yr ≥107°F today · 16 d/yr by 30 yrs out
- Wind 6/10 Major 71% chance of damaging wind over 30 yrs
- Air quality 2/10 Low 0 unhealthy d/yr today · 1 by 30 yrs out
Nearby sold comps map
Loading sold comps map…
Walkable amenities ~0.75 mi
Loading nearby amenities…
Taxation est. · year 1
- Rental income
- $16,280
- − Mortgage interest
- −$8,122
- − Property taxes
- −$656
- − Insurance
- −$725
- − Repairs & maintenance
- −$1,302
- − Management
- −$1,302
- − Depreciation
- −$4,218
- Taxable loss
- −$46
- Est. tax savings @ 24.0%
- +$11
- After-tax cash flow
- $2,367/yr
For passive investors: Depreciation is non-cash, so a rental often shows a tax loss while cash-flowing — sheltering income. Rental losses are passive: they offset passive income freely, and up to $25,000/yr can offset ordinary (W-2) income if you actively participate and your MAGI is under $100k (phasing out to $0 by $150k); unused losses carry forward. On sale, claimed depreciation is recaptured at up to 25%, and gains may owe capital-gains tax (a 1031 exchange can defer both). Figures are a year-1 estimate at your 24.0% rate — not tax advice; consult a CPA.
Schools (NCES district)
- District
- Franklin City Public School District
- NCES district ID
- 5101410
- Math proficiency
- 23% ▼ -48.00%
- Reading proficiency
- 51% ▼ -18.00%
- Median HH income
- $35,138
- Composite
- 30.47/100
- National rank
- #6227
- State rank
- #127 of 131 in VA
Livability — Franklin
- Score
- 59/100
- State rank
- #461
- US rank
- #19645
Category grades
Schools grade is shown separately in the Schools card above.
Census & demographics
- Census place
- Franklin, VA
- Population (ZIP)
- 13,481
Population outlook (Franklin County) Hauer SSP2
- Today (2025)
- 7,817 people
- By 2030
- 7,480 · -4.3%
- By 2040
- 6,803 · -13.0%
- By 2050
- 6,124 · -21.7%
- By 2075
- 4,484 · -42.6%
- By 2100
- 2,967 · -62.0%
Race, ethnicity, and origin ACS 2023
- Neighborhood character
- Diverse neighborhood (Simpson 0.60)
- Race & ethnicity
- Black 45% White 44% Two or more races 8% Hispanic / Latino 2% Asian 2%
- Common ancestry
- Serbian 2% Slovak 1% Lithuanian 1%
- Foreign-born
- 2% · South Korea, Canada
- Languages at home
- 97% English-only · Spanish 2% Other Indo-European 1%
Political lean MEDSL · Franklin
- 2024 margin
- Strong D (+22.8) · D 60.9% · R 38.1% · Other 1.1%
- 2008→2024 swing
- -5.3pp toward R · 2008: 28.1pp · 2024: 22.8pp
- All cycles
- 2024: D+22.8 2020: D+25.6 2016: D+27.1 2012: D+30.7 2008: D+28.1
Not yet ingested
- Civics
- —
Market trends
- HPI YoY
- ▼ -33.51%
- Current HPI
- 293.564
- Rent YoY
- —
- Metro
- —
- State GDP YoY
- ▲ 2.40%
- F500 in state
- 50
Industry mix (Fortune 500 HQ in VA)
| Industry | F500 HQs | Revenue |
|---|---|---|
| Aerospace / Defense | 4 | $236B |
|
||
| Technology / Defense | 3 | $32B |
|
||
| Financial Services | 2 | $176B |
|
||
| Utilities | 2 | $27B |
|
||
| Insurance | 2 | $25B |
|
||
| Technology | 2 | $15B |
|
||
Price history
+860.2% since first listed3 events — show timeline
- 2026-06-02 Listed $144,990 REINMLS
- 2022-11-07 Sold (Public Records) $80,140 Public Records
- 2014-07-14 Sold (Public Records) $15,100 Public Records
Property tax history
+2.5%/yrLatest (2025): $656 · +0.0% YoY. Source: county tax records.
Cash-flow waterfall
monthlySold comps — $/sqft
last 12 mo · ≤1 miLoading sold comps…