260 1st Ave N · Munford, AL
Flood risk 1/10 · Minimal
- FEMA flood zone
- X (unshaded)
- Chance of flooding over 30 yrs
- 0.0%
- Est. flood insurance / yr
- $507 – $1,088
Fire risk 4/10 · Minor
- Est. fire insurance / yr
- $916 – $1,700
Heat risk 6/10 · Moderate
- Hot days now (above 107°F)
- 7 days/yr
- Hot days in 30 yrs
- 20 days/yr
Wind risk 6/10 · Moderate
- Chance of severe wind over 30 yrs
- 27.0%
Air-quality risk 2/10 · Minimal
- Unhealthy air days now
- 0 days/yr
- Unhealthy air days in 30 yrs
- 1 days/yr
Risk factors via First Street. Map © Google.
Why this score? — see what drove the D+ grade
The composite is a weighted blend of 9 inputs, each scored 0–100. Each bar is that input's sub-score; the figure is the points it added to the 100-point composite (weight × sub-score).
- Cash flow +18.1/30.0
- Appreciation +10.0/10.0
- DSCR +5.7/10.0
- 1% rule +3.5/10.0
- Livability +3.1/5.0
- Rent growth +2.5/5.0
- Schools +2.5/10.0
- Condition / age +2.5/5.0
- ARV discount +0.0/15.0
$189,900
🖨 Deal sheet 📄 Offer letter ✓ Due diligence
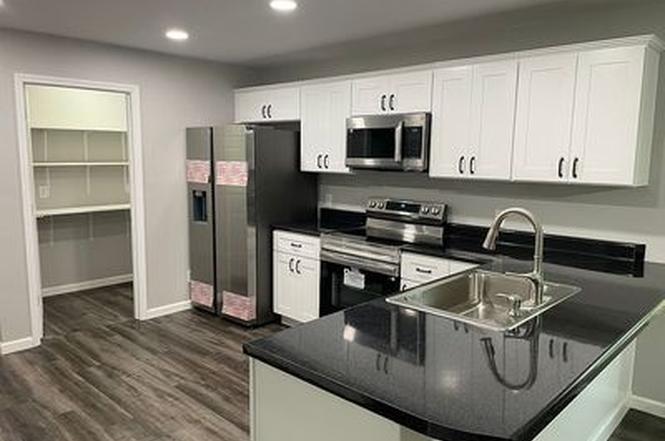
Listing remarks
When I say everything has been replaced (come see) because this house has been gutted and rebuilt brand new! From all new Sheetrock, flooring, exterior siding, central heat/air (10 yr warranting) lighting, electrical, plumbing, bathrooms, paint, trim, insulation, doors & amp; even a new septic tank and field lines! Built in 1948 and completely remodeled from top to bottom in 2025 & acirc; & euro; & ldquo; 2026, this stunning 3-bedroom, 2-bath home blends timeless character with modern design. Featuring an open floor plan, the home offers a spacious living area highlighted by a massive wood-burning fireplace with a beautiful stained oak hearth & acirc; & euro; &
Key facts
- New lighting
- New flooring
- New sheetrock
Tags
Neighborhood map
What this means for you Summary
Snapshot
- This is a 3-bed/2.0-bath single-family listed at $190k.
Deal economics
- At list price, monthly cash flow is $167 ($2k/yr) — positive.
- The deal already cash-flows at list — no discount required.
- To meet the 1% rule (rent ≥ 1% of price), the offer needs to be $161k (15.0% below list).
- Recommended offer: $161k (15.0% below list) — sets the bar for 1% rule.
Location & tenants
- Location reads 62/100 on livability (#212 in AL) — a middle-class / working-renter tenant base. Strengths: cost of living A+, crime A, housing B+; Watch: schools D, amenities F, commute F.
- Talladega County (rural): math 15% / reading 44% proficiency, ranked #75 of 129 in AL (top 58%) — low school quality limits family demand, transient renter base, plan for 1-2y turnover; 64% free/reduced lunch — lower-income household profile, screen leases tightly.
- Market conditions: 27 active listings in the ZIP; 189 units permitted in Talladega County in 2024 (6 in 5+ unit buildings).
Forward outlook
- In year one you build about $20k of equity ($1k loan paydown + $19k appreciation (10.0% local appreciation)).
- Talladega County population projected at -14% by 2050 — secular population decline; favor cash flow + early exit over multi-decade hold.
- At projected returns (10.0% appreciation + 3.0% rent growth), your $53k cash investment doubles in ~3 years — after that, you're playing with house money.
- By year 2, paydown + projected appreciation supports a ~$33k cash-out refi (75% LTV) — recoverable capital for the next deal without selling this one.
Negotiation context
- Only 4 days on market — expect competitive offers; lowballing is unlikely to land.
- Current owner paid $10k; list at $190k implies a 1726% gain — meaningful room to come down on a strong offer.
Risks & watch-outs
- Watch-outs: built in 1948 — expect roof / HVAC / electrical / plumbing capex.
- Climate carrying-cost: major wind risk, 27% chance of damaging wind over 30y; extreme-heat days projected 7→20/yr by 2055 (HVAC capex compounding) — expect insurance premiums to compound above CPI over the hold.
Questions for the listing agent
- Built in 1948 — when were the roof, HVAC, electrical panel, plumbing, and water heater last replaced?
- Is there a deadline driving the sale (1031 exchange, divorce, estate, relocation)? That informs how much negotiation room exists.
- Schools are D-rated, which usually means shorter tenancies and higher turnover. Who's the typical renter profile here, and what's been the actual vacancy rate?
- The area grade is low — what's the realistic commute time and amenity access for the typical tenant pool here? Any planned neighborhood developments (good or bad) we should know about?
- What's the average days-on-market for RENTAL listings here right now (not sales)? A rising rental-DOM trend means longer vacancies and softer asking-rent achievability than the comps imply.
- What's the recent tenant-quality profile in this submarket — average credit score on applications, eviction rate, late-payment / NSF rate, and stable-employment percentage? A property-management company in the area should have these aggregated.
- How much new for-sale + rental construction is in the pipeline within 1–3 miles? Heavy new supply typically softens prices + rents 12–24 months out; constrained supply supports both.
Investment metrics
- 1% rule
- 0.85% ✗
- Cap rate
- 7.35%
- Cash-on-cash
- 3.77%
- DSCR
- 1.17
- GRM
- 9.8
CMA / ARV
- ARV (on-the-fly)
- $143,000
- Comps found
- 1
Show comp detail 1 sale within ~0.75 mi
| Address | Dist | Beds/Ba | Sqft | Sold | Price | $/sf | Match |
|---|---|---|---|---|---|---|---|
| 43433 Highway 21 | 0.12mi | 3/1.0 | 1,131 (-1%) | 23mo | $141,200 | $125 | 69 |
Match score weights: distance 35% · size 25% · config 20% · recency 20%. Top-matched comps best support the ARV.
Projected returns pro-forma
10.0% appreciation · 3.0% rent growth · sell at horizon
- IRR
- 27.0%
- Equity multiple
- 3.14×
- Total profit
- $113,966
- Equity at exit
- $171,077
- IRR
- 23.6%
- Equity multiple
- 7.15×
- Total profit
- $327,039
- Equity at exit
- $368,934
Cash invested: $53,172 (down + closing). Projections, not guarantees.
Landlord ↔ Tenant lean methodology
- Overall (STATE)
- 90 Strongly Landlord-Friendly
- State Alabama
- 90 Strongly Landlord-Friendly · R+15
- County
- — inherits STATE
- City
- — inherits STATE
ZIP-level market 36268
- Home prices YoY
- 5.1%
- Active inventory
- 27
- Price-to-rent
- 9.8×
Monthly cashflow live
- Estimated rent
- $1,614 medium interval (Pro) →
- Mortgage (P&I)
- −$996
- Tax from tax record
- −$33 /mo · $392/yr
- Insurance
- −$79
- HOA
- −$0
- Vacancy / Maint / Mgmt
- −$339
- Net cashflow
- $167
Break-even live
UW: 25.0% down · 7.5% · 30yr · 1.5% tax · 5.0% vac · 8.0% maint · 8.0% mgmt
Financing live
Cash to close
- Down payment
- $47,475
- Closing costs
- $5,697
- Reserves months
- —
- Total cash needed
- —
Loan-product check · same deal, 3 products live
Conventional
25% down · 7.5% · 30yr
- Down + closing
- —
- Monthly P&I
- —
- Monthly cashflow
- —
- DSCR
- —
- Eligible?
- —
Personal DTI + credit; lowest rate.
DSCR
20% down · 8.5% · 30yr
- Down + closing
- —
- Monthly P&I
- —
- Monthly cashflow
- —
- DSCR
- —
- Eligible?
- —
No personal income docs; deal must DSCR.
Hard money
10% down · 12.0% · 12mo
- Down + closing
- —
- Monthly P&I
- —
- Monthly cashflow
- —
- DSCR
- —
- Eligible?
- —
Short-term bridge; refi at stabilization.
Listing history 5 events
-
2026-06-19days on market $189,900 Active 4 DOM
-
2026-06-18days on market $189,900 Active 3 DOM
-
2026-06-17days on market $189,900 Active 2 DOM
-
2026-06-15remarks 671-char remark
-
2026-06-15$189,900 Active 1 DOM
ⓘ Source: listings_history table (triggers on properties + properties_extension) + one-shot
backfill from property_details.listing_events for pre-trigger history.
Tax reassessment forecast AL · Resets to sale price
- Current annual tax
- $392 · $33/mo
- Projected year-2 tax
- $779 · $65/mo
- Expected delta
- +$386/yr (+$32/mo · 98.4%)
ⓘ Screening estimate from a state-policy table — verify with the county assessor before closing.
Climate risk First Street
- Flood 1/10 Low FEMA zone X (unshaded) · 0% chance over 30 yrs
- Wildfire 4/10 Moderate
- Heat 6/10 Major 7 d/yr ≥107°F today · 20 d/yr by 30 yrs out
- Wind 6/10 Major 27% chance of damaging wind over 30 yrs
- Air quality 2/10 Low 0 unhealthy d/yr today · 1 by 30 yrs out
Nearby sold comps map
Loading sold comps map…
Walkable amenities ~0.75 mi
Loading nearby amenities…
Taxation est. · year 1
- Rental income
- $19,364
- − Mortgage interest
- −$10,637
- − Property taxes
- −$392
- − Insurance
- −$950
- − Repairs & maintenance
- −$1,549
- − Management
- −$1,549
- − Depreciation
- −$5,524
- Taxable loss
- −$1,238
- Est. tax savings @ 24.0%
- +$297
- After-tax cash flow
- $2,302/yr
For passive investors: Depreciation is non-cash, so a rental often shows a tax loss while cash-flowing — sheltering income. Rental losses are passive: they offset passive income freely, and up to $25,000/yr can offset ordinary (W-2) income if you actively participate and your MAGI is under $100k (phasing out to $0 by $150k); unused losses carry forward. On sale, claimed depreciation is recaptured at up to 25%, and gains may owe capital-gains tax (a 1031 exchange can defer both). Figures are a year-1 estimate at your 24.0% rate — not tax advice; consult a CPA.
Schools (NCES district)
- District
- Talladega County
- NCES district ID
- 0103180
- Math proficiency
- 15% ▼ -24.00%
- Reading proficiency
- 44% ▲ 3.00%
- Median HH income
- $37,715
- Composite
- 24.5/100
- National rank
- #7650
- State rank
- #75 of 129 in AL
Livability — Munford
- Score
- 62/100
- State rank
- #212
- US rank
- #16235
Category grades
Schools grade is shown separately in the Schools card above.
Census & demographics
- Census place
- Munford, AL
- Population (ZIP)
- 6,022
Population outlook (Talladega County) Hauer SSP2
- Today (2025)
- 78,905 people
- By 2030
- 77,160 · -2.2%
- By 2040
- 72,937 · -7.6%
- By 2050
- 68,279 · -13.5%
- By 2075
- 57,884 · -26.6%
- By 2100
- 47,220 · -40.2%
Race, ethnicity, and origin ACS 2023
- Neighborhood character
- Predominantly White (85%)
- Race & ethnicity
- White 85% Black 11% Two or more races 2%
- Common ancestry
- Italian 2% Lithuanian 2% Serbian 1%
- Foreign-born
- 2%
- Languages at home
- 97% English-only · Spanish 2% Other Asian/Pacific 1%
Political lean MEDSL · Talladega
- 2024 margin
- Solid R (+33.8) · D 32.9% · R 66.6%
- 2008→2024 swing
- -15.3pp toward R · 2008: -18.5pp · 2024: -33.8pp
- All cycles
- 2024: R+33.8 2020: R+25.5 2016: R+25.6 2012: R+16.0 2008: R+18.5
Not yet ingested
- Civics
- —
Market trends
- HPI YoY
- ▲ 11.88%
- Current HPI
- 243.6068
- Rent YoY
- —
- Metro
- —
- State GDP YoY
- ▲ 2.94%
- F500 in state
- 4
Industry mix (Fortune 500 HQ in AL)
| Industry | F500 HQs | Revenue |
|---|---|---|
| Financial Services | 1 | $8B |
|
||
| Healthcare | 1 | $5B |
|
||
Price history
+1726.0% since first listed2 events — show timeline
- 2026-06-15 Listed $189,900 FSBO.com
- 1998-10-16 Sold (Public Records) $10,400 Public Records
Property tax history
+10.0%/yrLatest (2025): $392 · +0.0% YoY. Source: county tax records.
Cash-flow waterfall
monthlySold comps — $/sqft
last 12 mo · ≤1 miLoading sold comps…