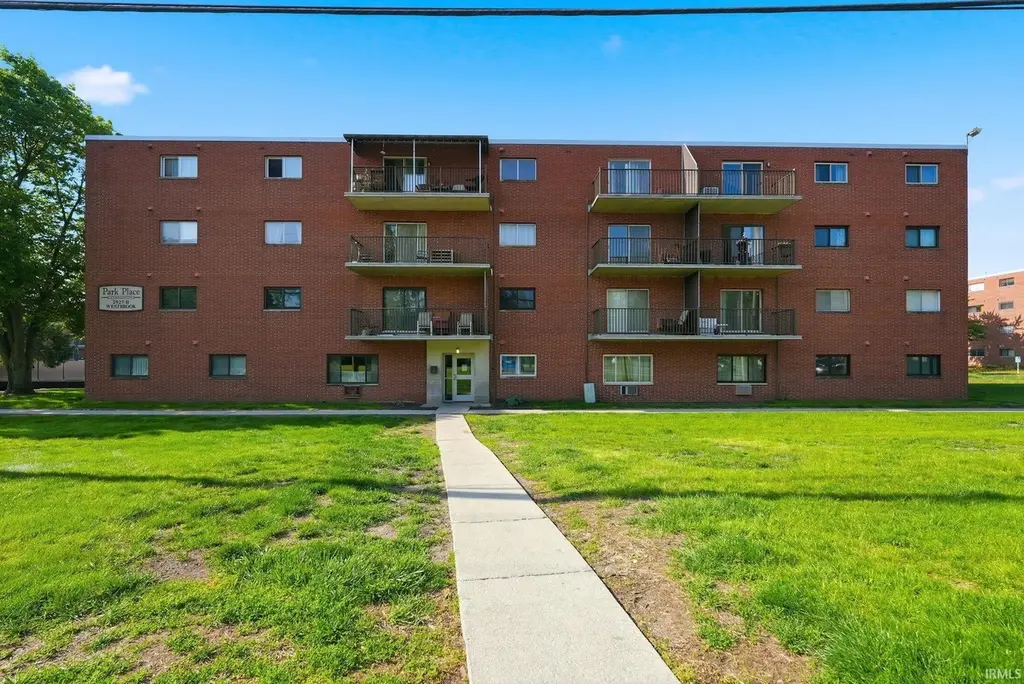
2927 Westbrook Dr Unit B 203 · Fort Wayne, IN
Flood risk 1/10 · Minimal
- FEMA flood zone
- X (unshaded)
- Chance of flooding over 30 yrs
- 0.0%
- Est. flood insurance / yr
- $507 – $1,088
Fire risk 1/10 · Minimal
- Est. fire insurance / yr
- $717 – $1,331
Heat risk 3/10 · Minor
- Hot days now (above 100°F)
- 7 days/yr
- Hot days in 30 yrs
- 17 days/yr
Wind risk 2/10 · Minimal
- Chance of severe wind over 30 yrs
- —
Air-quality risk 3/10 · Minor
- Unhealthy air days now
- 2 days/yr
- Unhealthy air days in 30 yrs
- 3 days/yr
Risk factors via First Street. Map © Google.
Why this score? — see what drove the D+ grade
The composite is a weighted blend of 9 inputs, each scored 0–100. Each bar is that input's sub-score; the figure is the points it added to the 100-point composite (weight × sub-score).
- Cash flow +14.2/30.0
- 1% rule +8.8/10.0
- ARV discount +7.5/15.0
- DSCR +4.3/10.0
- Livability +4.2/5.0
- Rent growth +2.7/5.0
- Condition / age +2.5/5.0
- Schools +2.2/10.0
- Appreciation +0.0/10.0
$69,900
🖨 Deal sheet 📄 Offer letter ✓ Due diligence
Listing remarks
Affordable condo opportunity in a convenient central Fort Wayne location! This upper-level condo in the Park Place community offers a simple, low-maintenance lifestyle with a functional layout. The unit features an open living and dining area, galley kitchen, spacious bedroom, and private balcony. Enjoy community amenities including a pool, workout room, tennis courts, laundry area, assigned parking, and secured entry where guests must buzz in. The HOA covers water, sewer, trash, snow removal, and exterior maintenance, making this a great option for someone who wants easy living without the outside upkeep. Located close to downtown Fort Wayne, shopping, dining, and nearby trail access.
Key facts
- Workout room
- Private balcony
- Community amenities
Tags
Property features AI
Finance
- HOA & community: Association amenities: fitness center, pool
Exterior
- Parking: Off-street parking
- Utilities: Public water; Public sewer
- Home design: Residential condominium; Condo/Villa; 1 story
- Construction: Brick construction; Slab foundation; Built area above grade: 535
- Exterior features: Level lot; Private pool (association); Community pool access
Interior
- Kitchen: Dishwasher; Refrigerator; Electric oven; Electric range
- Bedrooms: Total rooms: 4
- Flooring: Carpet; Laminate; Tile
- Bathrooms: 1 full bathroom (main level)
- Heating & cooling: Electric heating; Window unit cooling
- Interior features: Window treatments; Balcony
- Laundry & utility: Main-level laundry in common area
Neighborhood map
What this means for you Summary
Snapshot
- This is a 1-bed/1.0-bath condo listed at $70k.
Deal economics
- At list price, monthly cash flow is $12 ($145/yr) — positive.
- The deal already cash-flows at list — no discount required.
- Meets the 1% rule at list price ($966 rent vs $70k).
- Cap rate 6.5% vs local median 4.8% in Fort Wayne — top-decile yield for the area; either an underpriced asset or a hidden risk that comps aren't pricing in. Stress-test before assuming the spread holds.
Location & tenants
- Location reads 84/100 on livability (#6 in IN, #676 nationally) — a professional / high-income tenant draw. Strengths: amenities A+, commute A+, cost of living A+; Watch: crime C-, employment D+.
- Fort Wayne Community Schools (urban): math 22% / reading 29% proficiency, ranked #263 of 301 in IN (top 87%) — low school quality limits family demand, transient renter base, plan for 1-2y turnover; 60% free/reduced lunch — lower-income household profile, screen leases tightly.
- Zoned schools: Franke Park Elementary School (math 27% / reading 27%, grade F, #737 of 994 statewide, top 76%, 405 students, 78% FRL); Lakeside Middle School (math 8% / reading 17%, grade F, #310 of 330 statewide, top 94%, 502 students, 78% FRL); North Side High School (math 19% / reading 51%, grade F, #266 of 369 statewide, top 73%, 1,474 students, 66% FRL).
- Market conditions: Rents flat; 108 active listings in the ZIP; 9 comparable units currently listed for rent nearby; rentals at typical pace (median 22d on market — plan ~3-4 weeks tenant-placement turnaround); 1,861 units permitted in Allen County in 2024 (576 in 5+ unit buildings).
Forward outlook
- Local home prices are declining (-3.0%/yr); year-one equity from $483 of loan paydown is wiped out by about $2k of value loss. Plan a longer hold.
- Allen County population projected at +10% by 2050 — modest demand growth; plan on rents tracking national, not racing it.
Negotiation context
- Only 13 days on market — expect competitive offers; lowballing is unlikely to land.
- 3 sale attempts; this cycle's ask has dropped $5k (7%) from the opening price — seller is motivated, your offer sets the floor, not the list.
Risks & watch-outs
- Watch-outs: HOA is 26% of rent.
Questions for the listing agent
- Built in 1965 — when were the roof, HVAC, electrical panel, plumbing, and water heater last replaced?
- What does the HOA fee cover, when was the last increase, and are there any pending special assessments or reserve-fund shortfalls?
- Any open or pending special assessments — roof, HVAC, plumbing, elevator, façade? What's the per-unit balance and payoff schedule, and is the seller paying it off at close or rolling it to the buyer?
- Is there a deadline driving the sale (1031 exchange, divorce, estate, relocation)? That informs how much negotiation room exists.
- Schools are D-rated, which usually means shorter tenancies and higher turnover. Who's the typical renter profile here, and what's been the actual vacancy rate?
- The area grade is low — what's the realistic commute time and amenity access for the typical tenant pool here? Any planned neighborhood developments (good or bad) we should know about?
- What's the average days-on-market for RENTAL listings here right now (not sales)? A rising rental-DOM trend means longer vacancies and softer asking-rent achievability than the comps imply.
- What's the recent tenant-quality profile in this submarket — average credit score on applications, eviction rate, late-payment / NSF rate, and stable-employment percentage? A property-management company in the area should have these aggregated.
- How much new apartment / multifamily construction is in the pipeline within 1–3 miles? Heavy new supply (>2% of stock underway) typically softens rents 12–24 months out; light construction supports rent growth.
Investment metrics
- 1% rule
- 1.38% ✓
- Cap rate
- 6.50%
- Cash-on-cash
- 0.74%
- DSCR
- 1.03
- GRM
- 6.0
CMA / ARV
No comps found within radius.
Projected returns pro-forma
-3.0% appreciation · 0.75% rent growth · sell at horizon
- IRR
- -18.8%
- Equity multiple
- 0.36×
- Total profit
- $-12,518
- Equity at exit
- $10,422
- IRR
- -20.1%
- Equity multiple
- 0.10×
- Total profit
- $-17,573
- Equity at exit
- $6,044
Cash invested: $19,572 (down + closing). Projections, not guarantees.
Landlord ↔ Tenant lean methodology
- Overall (STATE)
- 90 Strongly Landlord-Friendly
- State Indiana
- 90 Strongly Landlord-Friendly · R+11
- County
- — inherits STATE
- City
- — inherits STATE
ZIP-level market 46805
- Rents YoY
- 0.8%
- Active inventory
- 108
- Price-to-rent
- 6.0×
Monthly cashflow live
- Estimated rent
- $966 high interval (Pro) →
- Mortgage (P&I)
- −$367
- Tax from tax record
- −$106 /mo · $1,269/yr
- Insurance
- −$29
- HOA est. from 2 same-building comps
- −$250
- Vacancy / Maint / Mgmt
- −$203
- Net cashflow
- $12
Break-even live
UW: 25.0% down · 7.5% · 30yr · 1.5% tax · 5.0% vac · 8.0% maint · 8.0% mgmt
Financing live
Cash to close
- Down payment
- $17,475
- Closing costs
- $2,097
- Reserves months
- —
- Total cash needed
- —
Loan-product check · same deal, 3 products live
Conventional
25% down · 7.5% · 30yr
- Down + closing
- —
- Monthly P&I
- —
- Monthly cashflow
- —
- DSCR
- —
- Eligible?
- —
Personal DTI + credit; lowest rate.
DSCR
20% down · 8.5% · 30yr
- Down + closing
- —
- Monthly P&I
- —
- Monthly cashflow
- —
- DSCR
- —
- Eligible?
- —
No personal income docs; deal must DSCR.
Hard money
10% down · 12.0% · 12mo
- Down + closing
- —
- Monthly P&I
- —
- Monthly cashflow
- —
- DSCR
- —
- Eligible?
- —
Short-term bridge; refi at stabilization.
Rent comps 9 comps
| Address | Beds | Baths | Sqft | Rent | $/sqft | DOM | Units | Dist |
|---|---|---|---|---|---|---|---|---|
| 424 Nussbaum Ave Fort Wayne, IN | 2.0 | 1.0 | 650 | $1,200 | $1.85 | 21d | 1 | 0.78mi |
| 1905 Hillside Ave Apt 1 Fort Wayne, IN | 1.0 | 1.0 | 680 | $825 | $1.21 | 44d | 1 | 0.95mi |
| 1035 Ridgewood Dr Fort Wayne, IN | 1.0–3.0 | 1.0–1.5 | 906 | $755 | $0.83 | 14d | 33 | 1.14mi |
| 101 Three Rivers N Fort Wayne, IN | 2.0 | 1.0 | 760 | $1,750 | $2.30 | 21d | 11 | 1.35mi |
| 116 W Columbia St Fort Wayne, IN | 1.0 | 1.0 | 689 | $1,305 | $1.89 | 14d | 3 | 1.43mi |
| 1005 Columbia Ave Unit 1005-1 Fort Wayne, IN | 2.0 | 1.0 | 680 | $950 | $1.40 | 14d | 1 | 1.47mi |
| 937 Columbia Ave Unit 937-4 Fort Wayne, IN | 1.0 | 1.0 | 630 | $850 | $1.35 | 14d | 1 | 1.47mi |
| 926 Columbia Ave Unit 3 Fort Wayne, IN | — | 1.0 | 643 | $749 | $1.16 | 44d | 1 | 1.50mi |
| 926 Columbia Ave Unit 3 Fort Wayne, IN | — | 1.0 | 450 | $750 | $1.67 | 21d | 1 | 1.50mi |
HOA detail condo
- Monthly dues
- $0 · $0/yr
- Likely covers
- watersewertrashsnow removalexterior maint.poolparking
- Assessments
- None detected in remarks — confirm with the listing agent.
Listing history 8 events
-
2026-06-02status $69,900 Pending 13 DOM
-
2026-06-01days on market $69,900 Active 13 DOM
-
2026-05-31days on market $69,900 Active 12 DOM
-
2026-05-30days on market $69,900 Active 11 DOM
-
2026-05-19$74,900 Active
-
2026-03-14status Active
-
2026-03-02status Pending
-
2026-01-21$74,900 Active
ⓘ Source: listings_history table (triggers on properties + properties_extension) + one-shot
backfill from property_details.listing_events for pre-trigger history.
Tax reassessment forecast IN · Partial reset (capped growth)
- Current annual tax
- $1,269 · $106/mo
- Projected year-2 tax
- $1,269 · $106/mo
- Expected delta
- $0/yr ($0/mo · 0.0%)
ⓘ Screening estimate from a state-policy table — verify with the county assessor before closing.
Climate risk First Street
- Flood 1/10 Low FEMA zone X (unshaded) · 0% chance over 30 yrs
- Wildfire 1/10 Low
- Heat 3/10 Moderate 7 d/yr ≥100°F today · 17 d/yr by 30 yrs out
- Wind 2/10 Low
- Air quality 3/10 Moderate 2 unhealthy d/yr today · 3 by 30 yrs out
Nearby sold comps map
Loading sold comps map…
Walkable amenities ~0.75 mi
Loading nearby amenities…
Taxation est. · year 1
- Rental income
- $11,598
- − Mortgage interest
- −$3,915
- − Property taxes
- −$1,269
- − Insurance
- −$350
- − Repairs & maintenance
- −$928
- − Management
- −$928
- − HOA
- −$3,000
- − Depreciation
- −$2,033
- Taxable loss
- −$825
- Est. tax savings @ 24.0%
- +$198
- After-tax cash flow
- $343/yr
For passive investors: Depreciation is non-cash, so a rental often shows a tax loss while cash-flowing — sheltering income. Rental losses are passive: they offset passive income freely, and up to $25,000/yr can offset ordinary (W-2) income if you actively participate and your MAGI is under $100k (phasing out to $0 by $150k); unused losses carry forward. On sale, claimed depreciation is recaptured at up to 25%, and gains may owe capital-gains tax (a 1031 exchange can defer both). Figures are a year-1 estimate at your 24.0% rate — not tax advice; consult a CPA.
Schools (NCES district)
- District
- Fort Wayne Community Schools
- NCES district ID
- 1803630
- Math proficiency
- 22% ▼ -11.00%
- Reading proficiency
- 29% ▼ -7.00%
- Median HH income
- $41,951
- Composite
- 21.68/100
- National rank
- #8275
- State rank
- #263 of 301 in IN
Livability — Fort Wayne
- Score
- 84/100
- State rank
- #6
- US rank
- #676
Category grades
Schools grade is shown separately in the Schools card above.
Census & demographics
- Census place
- Fort Wayne, IN
- County
- Allen County · 326,813 people
- City population
- 326,813
- Metro
- Fort Wayne, IN
- Population (ZIP)
- 21,437
- Household income
- $52,154
- Rent vs Own
- Severe rent burden
- 904.0
Population outlook (Allen County) Hauer SSP2
- Today (2025)
- 394,020 people
- By 2030
- 405,128 · +2.8%
- By 2040
- 423,476 · +7.5%
- By 2050
- 435,137 · +10.4%
- By 2075
- 450,293 · +14.3%
- By 2100
- 424,101 · +7.6%
Race, ethnicity, and origin ACS 2023
- Neighborhood character
- Predominantly White (72%)
- Race & ethnicity
- White 72% Black 9% Two or more races 8% Hispanic / Latino 7% Asian 5%
- Hispanic origin (detail)
- Mexican 4%
- Common ancestry
- Lithuanian 3% Slovak 3% Italian 2%
- Foreign-born
- 6% · Philippines, Canada
- Languages at home
- 91% English-only · Other Asian/Pacific 3% Spanish 3%
Political lean MEDSL · Allen
- 2024 margin
- R (+12.5) · D 42.9% · R 55.4% · Other 1.7%
- 2008→2024 swing
- -8.1pp toward R · 2008: -4.3pp · 2024: -12.5pp
- All cycles
- 2024: R+12.5 2020: R+11.2 2016: R+19.6 2012: R+16.8 2008: R+4.3
Not yet ingested
- Civics
- —
Market trends
- HPI YoY
- ▼ -356.64%
- Current HPI
- 286.2643
- Rent YoY
- ▲ 0.75%
- Metro
- Fort Wayne, IN
- State GDP YoY
- ▲ 2.90%
- F500 in state
- 18
Industry mix (Fortune 500 HQ in IN)
| Industry | F500 HQs | Revenue |
|---|---|---|
| Industrial Machinery | 2 | $37B |
|
||
| Healthcare | 1 | $177B |
|
||
| Pharmaceuticals | 1 | $45B |
|
||
| Metals / Steel | 1 | $18B |
|
||
| Agriculture | 1 | $17B |
|
||
| Packaging | 1 | $12B |
|
||
Price history
+0.0% since first listed4 events — show timeline
- 2026-05-19 Listed $74,900 IRMLS
- 2026-03-14 Relisted — IRMLS
- 2026-03-02 Pending — IRMLS
- 2026-01-21 Listed $74,900 IRMLS
Property tax history
+5.9%/yrLatest (2024): $1,269 · +7.6% YoY. Source: county tax records.
Cash-flow waterfall
monthlySold comps — $/sqft
last 12 mo · ≤1 miLoading sold comps…