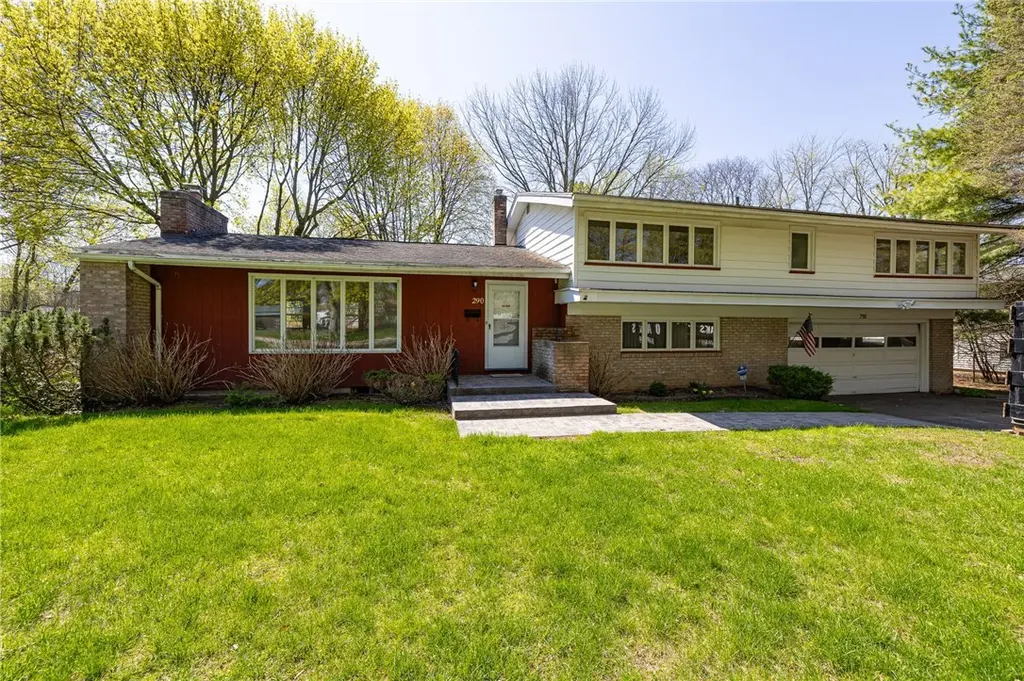
290 Dunrovin Ln · Brighton, NY
Flood risk 1/10 · Minimal
- FEMA flood zone
- X (unshaded)
- Chance of flooding over 30 yrs
- 0.0%
- Est. flood insurance / yr
- $473 – $860
Fire risk 2/10 · Minimal
- Est. fire insurance / yr
- $691 – $1,283
Heat risk 2/10 · Minimal
- Hot days now (above 96°F)
- 7 days/yr
- Hot days in 30 yrs
- 15 days/yr
Wind risk 1/10 · Minimal
- Chance of severe wind over 30 yrs
- —
Air-quality risk 2/10 · Minimal
- Unhealthy air days now
- 1 days/yr
- Unhealthy air days in 30 yrs
- 1 days/yr
Risk factors via First Street. Map © Google.
Why this score? — see what drove the B grade
The composite is a weighted blend of 9 inputs, each scored 0–100. Each bar is that input's sub-score; the figure is the points it added to the 100-point composite (weight × sub-score).
- Cash flow +25.7/30.0
- ARV discount +15.0/15.0
- DSCR +8.6/10.0
- 1% rule +8.1/10.0
- Schools +6.1/10.0
- Livability +4.0/5.0
- Rent growth +2.5/5.0
- Condition / age +2.5/5.0
- Appreciation +0.0/10.0
$324,900
🖨 Deal sheet 📄 Offer letter ✓ Due diligence
Listing remarks
Beloved Brighton home in a fantastic neighborhood for under $325,000? Now's your chance to put your mark on a Brighton home without breaking the bank! This spacious split level home includes four bedrooms, two and a half baths, over 2250 square feet and sits on over . 4 acres! Gleaming hardwoods throughout. Central air. First floor laundry. Huge windows that let the sunshine in. Don't wait. Delayed negotiations will be in effect with offers due Tuesday, April 28th at 8 am.
Key facts
- 0.4 acre lot
- 2 garage spots
- Built 1956
Property features AI
Exterior
- Parking: Attached garage with 2.5 spaces; Garage with electricity, storage, and garage door opener
- Utilities: Public water connected; Sewer connected; Circuit breaker electrical
- Home design: Single-story home; Existing construction; Resale property
- Construction: Aluminum siding and composite siding; Asphalt roof; Blown-in insulation; Copper plumbing; Block foundation; Below-grade finished area present
- Exterior features: Blacktop driveway; Deck; Near public transit; Rectangular residential lot; City street frontage
Interior
- Kitchen: Electric oven; Electric range; Range hood; Dishwasher; Disposal; Refrigerator; Exhaust fan; Eat-in kitchen
- Bedrooms: Total of 8 rooms (includes bedrooms and other living spaces)
- Flooring: Carpet; Hardwood; Tile; Vinyl; Varied flooring types
- Bathrooms: 2 full bathrooms; 1 half bathroom; 1 main-level bathroom
- Heating & cooling: Gas forced-air heating; Central air conditioning
- Interior features: Separate/formal dining room; Entrance foyer; Eat-in kitchen; Window treatments; Drapes; Programmable thermostat; Partially finished basement with sump pump; Basement present; Recreation room; Studio
- Laundry & utility: Washer; Dryer; Main-level laundry
Neighborhood map
What this means for you Summary
Snapshot
- This is a 4-bed/2.5-bath single-family listed at $325k.
Deal economics
- At list price, monthly cash flow is $782 ($9k/yr) — positive.
- The deal already cash-flows at list — no discount required.
- Meets the 1% rule at list price ($4k rent vs $325k).
- Cap rate 9.2% vs local median 3.9% in Brighton — top-decile yield for the area; either an underpriced asset or a hidden risk that comps aren't pricing in. Stress-test before assuming the spread holds.
Location & tenants
- Location reads 81/100 on livability (#89 in NY, #1,379 nationally) — a professional / high-income tenant draw. Strengths: housing A+, health & safety A+, schools B+; Watch: crime D+, amenities D-.
- Brighton Central School District (suburban): math 64% / reading 74% proficiency, ranked #142 of 590 in NY (top 24%) — acceptable for families but not a draw, mixed tenant base, ~2y average lease; only 10% free/reduced lunch — higher-income household profile.
- Market conditions: 115 active listings in the ZIP; 2 comparable units currently listed for rent nearby; high-income renter base; 1,169 units permitted in Monroe County in 2024 (591 in 5+ unit buildings).
- This rent runs 41% of the median local income ($125k/yr) — at the standard rent-burdened threshold; future hikes will face affordability resistance.
Forward outlook
- Local home prices are declining (-3.0%/yr); year-one equity from $2k of loan paydown is wiped out by about $10k of value loss. Plan a longer hold.
- Monroe County population projected to shrink 6% by 2050 — rents likely to lag national; underwrite the cash flow, not the appreciation.
Negotiation context
- Only 7 days on market — expect competitive offers; lowballing is unlikely to land.
Risks & watch-outs
- Watch-outs: property tax is 2.7% of price; built in 1956 — expect roof / HVAC / electrical / plumbing capex.
Questions for the listing agent
- Built in 1956 — when were the roof, HVAC, electrical panel, plumbing, and water heater last replaced?
- Property tax is high relative to price — has the assessment been appealed recently, and will the sale trigger a re-assessment?
- Is there a deadline driving the sale (1031 exchange, divorce, estate, relocation)? That informs how much negotiation room exists.
- Schools are B-rated — typically a magnet for longer-tenancy family renters. What's the average tenant stay here, and is there a school-zone premium baked into asking?
- Crime grade is D in this area — have there been break-ins, vandalism, or insurance claims at this property in the last 3 years? What carrier currently insures it and at what premium?
- What's the average days-on-market for RENTAL listings here right now (not sales)? A rising rental-DOM trend means longer vacancies and softer asking-rent achievability than the comps imply.
- What's the recent tenant-quality profile in this submarket — average credit score on applications, eviction rate, late-payment / NSF rate, and stable-employment percentage? A property-management company in the area should have these aggregated.
- How much new for-sale + rental construction is in the pipeline within 1–3 miles? Heavy new supply typically softens prices + rents 12–24 months out; constrained supply supports both.
Investment metrics
- 1% rule
- 1.31% ✓
- Cap rate
- 9.18%
- Cash-on-cash
- 10.32%
- DSCR
- 1.46
- GRM
- 6.4
CMA / ARV
- ARV (on-the-fly)
- $466,164
- Comps found
- 12
Show comp detail 12 sales within ~0.75 mi
| Address | Dist | Beds/Ba | Sqft | Sold | Price | $/sf | Match |
|---|---|---|---|---|---|---|---|
| 290 Dunrovin Ln | 0.00mi | 4/2.5 | 2,252 (0%) | 1mo | $380,500 | $169 | 100 |
| 110 Dunrovin Ln | 0.09mi | 4/2.5 | 2,236 (-1%) | 1mo | $421,000 | $188 | 94 |
| 25 Coral Way | 0.17mi | 4/2.0 | 2,130 (-5%) | 0mo | $440,000 | $207 | 81 |
| 472 French Rd | 0.27mi | 4/2.5 | 2,144 (-5%) | 10mo | $370,000 | $173 | 72 |
| 20 Coral Way | 0.21mi | 3/2.0 (-1) | 2,392 (+6%) | 7mo | $510,000 | $213 | 67 |
| 434 French Rd | 0.27mi | 4/2.5 | 2,072 (-8%) | 10mo | $510,000 | $246 | 66 |
| 135 Crandon Way | 0.26mi | 4/2.5 | 1,932 (-14%) | 0mo | $393,000 | $203 | 64 |
| 477 French Rd | 0.37mi | 3/2.0 (-1) | 2,180 (-3%) | 8mo | $540,000 | $248 | 64 |
| 90 Willowcrest Dr | 0.61mi | 4/2.0 | 2,074 (-8%) | 6mo | $365,000 | $176 | 51 |
| 145 Shalimar Dr | 0.55mi | 3/2.5 (-1) | 2,080 (-8%) | 7mo | $357,000 | $172 | 50 |
| 275 Viennawood Dr | 0.72mi | 4/2.5 | 2,132 (-5%) | 10mo | $500,000 | $235 | 49 |
| 56 Hunters Ln | 0.72mi | 3/2.5 (-1) | 1,926 (-14%) | 2mo | $506,000 | $263 | 35 |
Match score weights: distance 35% · size 25% · config 20% · recency 20%. Top-matched comps best support the ARV.
Projected returns pro-forma
-3.0% appreciation · 3.0% rent growth · sell at horizon
- IRR
- -0.7%
- Equity multiple
- 0.97×
- Total profit
- $-2,559
- Equity at exit
- $48,444
- IRR
- 9.0%
- Equity multiple
- 1.69×
- Total profit
- $62,995
- Equity at exit
- $28,091
Cash invested: $90,972 (down + closing). Projections, not guarantees.
Landlord ↔ Tenant lean methodology
- Overall (STATE)
- 15 Strongly Tenant-Friendly
- State New York
- 15 Strongly Tenant-Friendly · D+10
- County
- — inherits STATE
- City
- — inherits STATE
ZIP-level market 14618
- Active inventory
- 115
- Price-to-rent
- 6.4×
Monthly cashflow live
- Estimated rent
- $4,240 medium interval (Pro) →
- Mortgage (P&I)
- −$1,704
- Tax from tax record
- −$728 /mo · $8,739/yr
- Insurance
- −$135
- HOA
- −$0
- Vacancy / Maint / Mgmt
- −$890
- Net cashflow
- $782
Break-even live
UW: 25.0% down · 7.5% · 30yr · 1.5% tax · 5.0% vac · 8.0% maint · 8.0% mgmt
Financing live
Cash to close
- Down payment
- $81,225
- Closing costs
- $9,747
- Reserves months
- —
- Total cash needed
- —
Loan-product check · same deal, 3 products live
Conventional
25% down · 7.5% · 30yr
- Down + closing
- —
- Monthly P&I
- —
- Monthly cashflow
- —
- DSCR
- —
- Eligible?
- —
Personal DTI + credit; lowest rate.
DSCR
20% down · 8.5% · 30yr
- Down + closing
- —
- Monthly P&I
- —
- Monthly cashflow
- —
- DSCR
- —
- Eligible?
- —
No personal income docs; deal must DSCR.
Hard money
10% down · 12.0% · 12mo
- Down + closing
- —
- Monthly P&I
- —
- Monthly cashflow
- —
- DSCR
- —
- Eligible?
- —
Short-term bridge; refi at stabilization.
Rent comps 2 comps
| Address | Beds | Baths | Sqft | Rent | $/sqft | DOM | Units | Dist |
|---|---|---|---|---|---|---|---|---|
| 399 French Rd Rochester, NY | 4.0 | 2.5 | 2784 | $4,500 | $1.62 | 21d | 1 | 0.52mi |
| 99 Brittany Ln Pittsford, NY | 2.0–3.0 | 2.0 | 1590 | $2,679 | $1.68 | 2d | 1 | 1.48mi |
Listing history 2 events
-
2026-04-30status Pending
-
2026-04-23$324,900 Active
ⓘ Source: listings_history table (triggers on properties + properties_extension) + one-shot
backfill from property_details.listing_events for pre-trigger history.
Tax reassessment forecast NY · Partial reset (capped growth)
- Current annual tax
- $8,739 · $728/mo
- Projected year-2 tax
- $8,739 · $728/mo
- Expected delta
- $0/yr ($0/mo · 0.0%)
ⓘ Screening estimate from a state-policy table — verify with the county assessor before closing.
Climate risk First Street
- Flood 1/10 Low FEMA zone X (unshaded) · 0% chance over 30 yrs
- Wildfire 2/10 Low
- Heat 2/10 Low 7 d/yr ≥96°F today · 15 d/yr by 30 yrs out
- Wind 1/10 Low
- Air quality 2/10 Low 1 unhealthy d/yr today · 1 by 30 yrs out
Nearby sold comps map
Loading sold comps map…
Walkable amenities ~0.75 mi
Loading nearby amenities…
Taxation est. · year 1
- Rental income
- $50,882
- − Mortgage interest
- −$18,199
- − Property taxes
- −$8,739
- − Insurance
- −$1,624
- − Repairs & maintenance
- −$4,071
- − Management
- −$4,071
- − Depreciation
- −$9,452
- Taxable income
- $4,727
- Est. tax owed @ 24.0%
- −$1,134
- After-tax cash flow
- $8,253/yr
For passive investors: Depreciation is non-cash, so a rental often shows a tax loss while cash-flowing — sheltering income. Rental losses are passive: they offset passive income freely, and up to $25,000/yr can offset ordinary (W-2) income if you actively participate and your MAGI is under $100k (phasing out to $0 by $150k); unused losses carry forward. On sale, claimed depreciation is recaptured at up to 25%, and gains may owe capital-gains tax (a 1031 exchange can defer both). Figures are a year-1 estimate at your 24.0% rate — not tax advice; consult a CPA.
Schools (NCES district)
- District
- Brighton Central School District
- NCES district ID
- 3605460
- Math proficiency
- 64% ▼ -8.00%
- Reading proficiency
- 74% ▲ 6.00%
- Median HH income
- $71,403
- Composite
- 60.55/100
- National rank
- #837
- State rank
- #142 of 590 in NY
Livability — Brighton
- Score
- 81/100
- State rank
- #89
- US rank
- #1379
Category grades
Schools grade is shown separately in the Schools card above.
Census & demographics
- Census place
- Brighton, NY
- County
- Monroe County · 674,131 people
- City population
- 38,703
- Metro
- Rochester, NY
- Population (ZIP)
- 25,476
- Household income
- $125,098
- Rent vs Own
- Severe rent burden
- 548.0
Population outlook (Monroe County) Hauer SSP2
- Today (2025)
- 759,460 people
- By 2030
- 757,154 · -0.3%
- By 2040
- 740,644 · -2.5%
- By 2050
- 714,443 · -5.9%
- By 2075
- 645,883 · -15.0%
- By 2100
- 547,084 · -28.0%
Race, ethnicity, and origin ACS 2023
- Neighborhood character
- Predominantly White (80%)
- Race & ethnicity
- White 80% Asian 8% Two or more races 6% Black 4% Hispanic / Latino 3%
- Common ancestry
- Romanian 5% Scotch-Irish 3% Slovak 3%
- Foreign-born
- 10% · Canada, China, South Korea
- Languages at home
- 88% English-only · Other Asian/Pacific 2% Other Indo-European 2% Spanish 2%
Political lean MEDSL · Monroe
- 2024 margin
- D (+19.1) · D 59.5% · R 40.5%
- 2008→2024 swing
- +1.4pp toward D · 2008: 17.7pp · 2024: 19.1pp
- All cycles
- 2024: D+19.1 2020: D+21.0 2016: D+14.1 2012: D+17.4 2008: D+17.7
Not yet ingested
- Civics
- —
Market trends
- HPI YoY
- ▼ -246.83%
- Current HPI
- 271.6387
- Rent YoY
- —
- Metro
- Rochester, NY
- State GDP YoY
- ▲ 2.60%
- F500 in state
- 92
Industry mix (Fortune 500 HQ in NY)
| Industry | F500 HQs | Revenue |
|---|---|---|
| Financial Services | 10 | $950B |
|
||
| Consumer Goods | 9 | $162B |
|
||
| Insurance | 4 | $225B |
|
||
| Telecommunications | 2 | $144B |
|
||
| Pharmaceuticals | 2 | $112B |
|
||
| Media / Entertainment | 2 | $69B |
|
||
Price history
2 events — show timeline
- 2026-04-30 Pending — UNYREIS
- 2026-04-23 Listed $324,900 UNYREIS
Property tax history
+2.7%/yrLatest (2025): $8,739 · +25.9% YoY. Source: county tax records.
Cash-flow waterfall
monthlySold comps — $/sqft
last 12 mo · ≤1 miLoading sold comps…