1105 John Miller Rd · Rockwell, NC
Flood risk 1/10 · Minimal
- FEMA flood zone
- X (unshaded)
- Chance of flooding over 30 yrs
- 0.0%
- Est. flood insurance / yr
- $507 – $1,088
Fire risk 4/10 · Minor
- Est. fire insurance / yr
- $906 – $1,684
Heat risk 5/10 · Moderate
- Hot days now (above 104°F)
- 7 days/yr
- Hot days in 30 yrs
- 17 days/yr
Wind risk 4/10 · Minor
- Chance of severe wind over 30 yrs
- 15.0%
Air-quality risk 3/10 · Minor
- Unhealthy air days now
- 2 days/yr
- Unhealthy air days in 30 yrs
- 4 days/yr
Risk factors via First Street. Map © Google.
Why this score? — see what drove the B grade
The composite is a weighted blend of 9 inputs, each scored 0–100. Each bar is that input's sub-score; the figure is the points it added to the 100-point composite (weight × sub-score).
- Cash flow +29.6/30.0
- ARV discount +15.0/15.0
- DSCR +10.0/10.0
- 1% rule +7.3/10.0
- Livability +3.8/5.0
- Schools +2.6/10.0
- Rent growth +2.5/5.0
- Condition / age +2.5/5.0
- Appreciation +0.0/10.0
$125,000
🖨 Deal sheet (PDF) 📄 Offer letter ✓ Due diligence
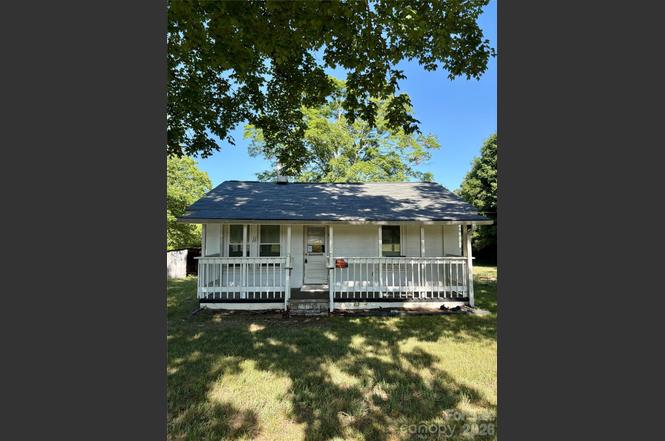
Listing remarks
Investor Special in Rockwell! This 2-bedroom, 1-bath home offers plenty of potential for investors, flippers, or buyers looking for their next renovation project. Situated on a spacious lot with mature shade trees and a covered front porch, the property provides a solid starting point for a value-add investment. Inside, you'll find a functional floor plan with generously sized living spaces and existing flooring in portions of the home, making it easy to envision the finished product. With some updates and improvements, this property could be transformed into a rental, resale opportunity, or affordable primary residence. Conveniently located in Rockwell with easy access to Salisbury, local
Key facts
- 1.25 acre lot
- Built 1959
- Listed 4 days
Property features AI
Finance
- Other: Lot approximately 1.25 acres (dimensions: 445' x 133' x 476' x 125')
- HOA & community: No HOA
Exterior
- Parking: Driveway
- Utilities: Well water; Septic system installed
- Home design: Single-family residence (site built); One story; Zoned RA; Facing direction not specified
- Construction: Vinyl exterior; Crawl space foundation; Built on site
- Exterior features: Dirt and gravel road access; Publicly maintained road
Interior
- Kitchen: No kitchen appliances listed
- Bedrooms: Two bedrooms on the main level
- Bathrooms: One full bathroom on the main level
- Heating & cooling: Baseboard heating; Cooling listed as: other (see remarks)
- Interior features: Six total rooms; No appliances included
- Laundry & utility: Laundry located in the bathroom
Neighborhood map
What this means for you Summary
Snapshot
- This is a 2-bed/1.0-bath single-family listed at $125k.
Deal economics
- At list price, monthly cash flow is $452 ($5k/yr) — positive.
- The deal already cash-flows at list — no discount required.
- Meets the 1% rule at list price ($2k rent vs $125k).
- Cap rate 10.6% vs local median 4.1% in Rockwell — top-decile yield for the area; either an underpriced asset or a hidden risk that comps aren't pricing in. Stress-test before assuming the spread holds.
Location & tenants
- Location reads 76/100 on livability (#37 in NC, #3,505 nationally) — a middle-class / working-renter tenant base. Strengths: cost of living A+, housing A+, health & safety A+; Watch: amenities F, commute F.
- Rowan-Salisbury Schools (rural): math 26% / reading 35% proficiency, ranked #142 of 178 in NC (top 80%) — families likely to look elsewhere, expect single-tenant / working-renter base with shorter leases.
- Zoned schools: Shive Elementary (math 37% / reading 47%, grade F, #633 of 1,410 statewide, top 48%, 480 students, 63% FRL); Erwin Middle (math 22% / reading 32%, grade F, #374 of 475 statewide, top 80%, 759 students, 56% FRL); East Rowan High (math 27% / reading 50%, grade F, #403 of 535 statewide, top 76%, 1,032 students, 51% FRL) — zoned schools at 57% FRL track the district average.
- Market conditions: 38 active listings in the ZIP; 592 units permitted in Rowan County in 2024 (5 in 5+ unit buildings).
Forward outlook
- Local home prices are declining (-3.0%/yr); year-one equity from $864 of loan paydown is wiped out by about $4k of value loss. Plan a longer hold.
- Rowan County population projected to shrink 6% by 2050 — rents likely to lag national; underwrite the cash flow, not the appreciation.
- At projected returns (-3.0% appreciation + 3.0% rent growth), your $35k cash investment doubles in ~8 years — after that, you're playing with house money.
Negotiation context
- Only 5 days on market — expect competitive offers; lowballing is unlikely to land.
- 4 sale attempts since 5y ago; this cycle's ask has dropped $40k (24%) from the opening price — seller is motivated, your offer sets the floor, not the list.
- Current owner paid $45k; list at $125k implies a 178% gain — meaningful room to come down on a strong offer.
Risks & watch-outs
- Watch-outs: built in 1959 — expect roof / HVAC / electrical / plumbing capex.
- Climate carrying-cost: extreme-heat days projected 7→17/yr by 2055 (HVAC capex compounding) — expect insurance premiums to compound above CPI over the hold.
Questions for the listing agent
- Built in 1959 — when were the roof, HVAC, electrical panel, plumbing, and water heater last replaced?
- Is there a deadline driving the sale (1031 exchange, divorce, estate, relocation)? That informs how much negotiation room exists.
- Schools are F-rated, which usually means shorter tenancies and higher turnover. Who's the typical renter profile here, and what's been the actual vacancy rate?
- What's the average days-on-market for RENTAL listings here right now (not sales)? A rising rental-DOM trend means longer vacancies and softer asking-rent achievability than the comps imply.
- What's the recent tenant-quality profile in this submarket — average credit score on applications, eviction rate, late-payment / NSF rate, and stable-employment percentage? A property-management company in the area should have these aggregated.
- How much new for-sale + rental construction is in the pipeline within 1–3 miles? Heavy new supply typically softens prices + rents 12–24 months out; constrained supply supports both.
Investment metrics
- 1% rule
- 1.23% ✓
- Cap rate
- 10.63%
- Cash-on-cash
- 15.50%
- DSCR
- 1.69
- GRM
- 6.8
CMA / ARV
- ARV (on-the-fly)
- $191,780
- Comps found
- 1
Show comp detail 1 sale within ~0.75 mi
| Address | Dist | Beds/Ba | Sqft | Sold | Price | $/sf | Match |
|---|---|---|---|---|---|---|---|
| 1190 Holshouser Rd | 0.56mi | 3/2.0 (+1) | 944 (+6%) | 15mo | $203,000 | $215 | 42 |
Match score weights: distance 35% · size 25% · config 20% · recency 20%. Top-matched comps best support the ARV.
Projected returns pro-forma
-3.0% appreciation · 3.0% rent growth · sell at horizon
- IRR
- 6.2%
- Equity multiple
- 1.24×
- Total profit
- $8,499
- Equity at exit
- $18,638
- IRR
- 15.6%
- Equity multiple
- 2.27×
- Total profit
- $44,313
- Equity at exit
- $10,808
Cash invested: $35,000 (down + closing). Projections, not guarantees.
Landlord ↔ Tenant lean methodology
- Overall (STATE)
- 85 Strongly Landlord-Friendly
- State North Carolina
- 85 Strongly Landlord-Friendly · R+3
- County
- — inherits STATE
- City
- — inherits STATE
ZIP-level market 28138
- Home prices YoY
- -14.7%
- Active inventory
- 38
- Price-to-rent
- 6.8×
Monthly cashflow live
- Estimated rent
- $1,534 medium interval (Pro) →
- Mortgage (P&I)
- −$656
- Tax from tax record
- −$52 /mo · $625/yr
- Insurance
- −$52
- HOA
- −$0
- Vacancy / Maint / Mgmt
- −$322
- Net cashflow
- $452
Break-even live
Sensitivity live
| Price | -10% $523 | -5% $487 | +0% $452 | +5% $417 | +10% $381 |
|---|---|---|---|---|---|
| Rent | -10% $331 | -5% $392 | +0% $452 | +5% $513 | +10% $573 |
| Rate | -1.0pp $515 | -0.5pp $484 | base $452 | +0.5pp $420 | +1.0pp $387 |
UW: 25.0% down · 7.5% · 30yr · 1.5% tax · 5.0% vac · 8.0% maint · 8.0% mgmt
Financing live
Cash to close
- Down payment
- $31,250
- Closing costs
- $3,750
- Reserves months
- —
- Total cash needed
- —
Loan-product check · same deal, 3 products live
Conventional
25% down · 7.5% · 30yr
- Down + closing
- —
- Monthly P&I
- —
- Monthly cashflow
- —
- DSCR
- —
- Eligible?
- —
Personal DTI + credit; lowest rate.
DSCR
20% down · 8.5% · 30yr
- Down + closing
- —
- Monthly P&I
- —
- Monthly cashflow
- —
- DSCR
- —
- Eligible?
- —
No personal income docs; deal must DSCR.
Hard money
10% down · 12.0% · 12mo
- Down + closing
- —
- Monthly P&I
- —
- Monthly cashflow
- —
- DSCR
- —
- Eligible?
- —
Short-term bridge; refi at stabilization.
Listing history 5 events
-
2026-06-21days on market $125,000 Active 5 DOM
-
2026-06-18days on market $125,000 Active 2 DOM
-
2026-06-17status $125,000 Active 1 DOM
-
2026-06-16remarks 699-char remark
-
2026-06-16$125,000 Coming Soon 1 DOM
ⓘ Source: listings_history table (triggers on properties + properties_extension) + one-shot
backfill from property_details.listing_events for pre-trigger history.
Tax reassessment forecast NC · Resets to sale price
- Current annual tax
- $625 · $52/mo
- Projected year-2 tax
- $1,025 · $85/mo
- Expected delta
- +$400/yr (+$33/mo · 64.0%)
ⓘ Screening estimate from a state-policy table — verify with the county assessor before closing.
Climate risk First Street
- Flood 1/10 Low FEMA zone X (unshaded) · 0% chance over 30 yrs
- Wildfire 4/10 Moderate
- Heat 5/10 Major 7 d/yr ≥104°F today · 17 d/yr by 30 yrs out
- Wind 4/10 Moderate 15% chance of damaging wind over 30 yrs
- Air quality 3/10 Moderate 2 unhealthy d/yr today · 4 by 30 yrs out
Nearby sold comps map
Loading sold comps map…
Walkable amenities ~0.75 mi
Loading nearby amenities…
Taxation est. · year 1
- Rental income
- $18,407
- − Mortgage interest
- −$7,002
- − Property taxes
- −$625
- − Insurance
- −$625
- − Repairs & maintenance
- −$1,473
- − Management
- −$1,473
- − Depreciation
- −$3,636
- Taxable income
- $3,574
- Est. tax owed @ 24.0%
- −$858
- After-tax cash flow
- $4,568/yr
For passive investors: Depreciation is non-cash, so a rental often shows a tax loss while cash-flowing — sheltering income. Rental losses are passive: they offset passive income freely, and up to $25,000/yr can offset ordinary (W-2) income if you actively participate and your MAGI is under $100k (phasing out to $0 by $150k); unused losses carry forward. On sale, claimed depreciation is recaptured at up to 25%, and gains may owe capital-gains tax (a 1031 exchange can defer both). Figures are a year-1 estimate at your 24.0% rate — not tax advice; consult a CPA.
Schools (NCES district)
- District
- Rowan-Salisbury Schools
- NCES district ID
- 3704050
- Math proficiency
- 26% ▲ 2.00%
- Reading proficiency
- 35% ▲ 1.00%
- Median HH income
- $43,953
- Composite
- 26.01/100
- National rank
- #7317
- State rank
- #142 of 178 in NC
Livability — Rockwell
- Score
- 76/100
- State rank
- #37
- US rank
- #3505
Category grades
Schools grade is shown separately in the Schools card above.
Census & demographics
- Population (ZIP)
- 9,795
Population outlook (Rowan County) Hauer SSP2
- Today (2025)
- 140,430 people
- By 2030
- 140,193 · -0.2%
- By 2040
- 137,617 · -2.0%
- By 2050
- 131,826 · -6.1%
- By 2075
- 115,123 · -18.0%
- By 2100
- 92,774 · -33.9%
Race, ethnicity, and origin ACS 2023
- Neighborhood character
- Predominantly White (93%)
- Race & ethnicity
- White 93% Two or more races 5% Hispanic / Latino 4%
- Common ancestry
- Serbian 3% Italian 2% Slovak 2%
- Foreign-born
- 1% · Canada
- Languages at home
- 96% English-only · Spanish 3%
Political lean MEDSL · Rowan
- 2024 margin
- Solid R (+35.9) · D 31.6% · R 67.5%
- 2008→2024 swing
- -13.1pp toward R · 2008: -22.8pp · 2024: -35.9pp
- All cycles
- 2024: R+35.9 2020: R+35.7 2016: R+36.8 2012: R+26.0 2008: R+22.8
Not yet ingested
- Civics
- —
Market trends
- HPI YoY
- ▼ -50.83%
- Current HPI
- 293.9512
- Rent YoY
- —
- Metro
- —
- State GDP YoY
- ▲ 3.28%
- F500 in state
- 26
Industry mix (Fortune 500 HQ in NC)
| Industry | F500 HQs | Revenue |
|---|---|---|
| Financial Services | 2 | $213B |
|
||
| Retail | 2 | $95B |
|
||
| Industrial Conglomerate | 1 | $38B |
|
||
| Metals / Steel | 1 | $35B |
|
||
| Utilities | 1 | $30B |
|
||
| Industrial Machinery | 1 | $19B |
|
||
Price history
+177.8% since first listed16 events — show timeline
- 2026-06-16 Coming Soon $125,000 CANOPYMLS as Distributed by MLS Grid
- 2021-10-10 Delisted — CANOPYMLS as Distributed by MLS Grid
- 2021-10-10 Delisted — CANOPYMLS as Distributed by MLS Grid
- 2021-09-09 Price Changed $150,000 CANOPYMLS as Distributed by MLS Grid
- 2021-09-09 Price Changed $150,000 CANOPYMLS as Distributed by MLS Grid
- 2021-08-25 Relisted — CANOPYMLS as Distributed by MLS Grid
- 2021-08-25 Relisted — CANOPYMLS as Distributed by MLS Grid
- 2021-08-25 Price Changed $165,000 CANOPYMLS as Distributed by MLS Grid
- 2021-08-25 Price Changed $165,000 CANOPYMLS as Distributed by MLS Grid
- 2021-07-15 Pending — CANOPYMLS as Distributed by MLS Grid
- 2021-07-15 Pending — CANOPYMLS as Distributed by MLS Grid
- 2021-06-29 Price Changed $159,900 CANOPYMLS as Distributed by MLS Grid
- 2021-06-29 Price Changed $159,900 CANOPYMLS as Distributed by MLS Grid
- 2021-06-24 Listed $165,000 CANOPYMLS as Distributed by MLS Grid
- 2021-06-11 Listed $165,000 CANOPYMLS as Distributed by MLS Grid
- 2014-12-30 Sold (Public Records) $45,000 Public Records
Property tax history
+6.2%/yrLatest (2025): $625 · +4.5% YoY. Source: county tax records.
Cash-flow waterfall
monthlySold comps — $/sqft
last 12 mo · ≤1 miLoading sold comps…