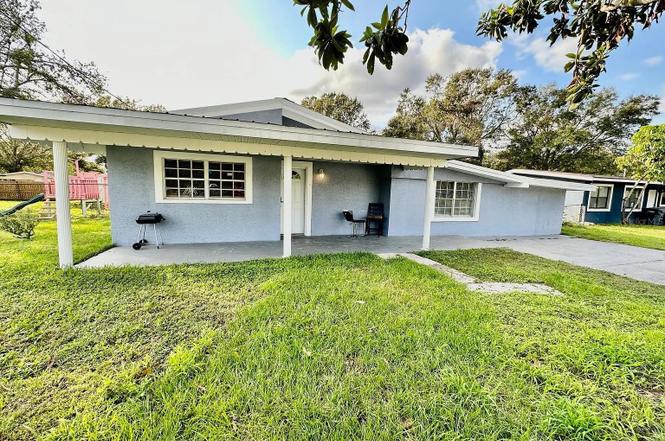
1605 36th St NW · Inwood, FL
Flood risk 1/10 · Minimal
- FEMA flood zone
- X (unshaded)
- Chance of flooding over 30 yrs
- 0.0%
- Est. flood insurance / yr
- $507 – $1,088
Fire risk 3/10 · Minor
- Est. fire insurance / yr
- $947 – $1,759
Heat risk 8/10 · Major
- Hot days now (above 107°F)
- 7 days/yr
- Hot days in 30 yrs
- 23 days/yr
Wind risk 9/10 · Severe
- Chance of severe wind over 30 yrs
- 99.0%
Air-quality risk 2/10 · Minimal
- Unhealthy air days now
- 2 days/yr
- Unhealthy air days in 30 yrs
- 2 days/yr
Risk factors via First Street. Map © Google.
Why this score? — see what drove the D grade
The composite is a weighted blend of 9 inputs, each scored 0–100. Each bar is that input's sub-score; the figure is the points it added to the 100-point composite (weight × sub-score).
- Cash flow +15.9/30.0
- ARV discount +7.5/15.0
- DSCR +4.9/10.0
- 1% rule +4.0/10.0
- Schools +3.5/10.0
- Livability +3.3/5.0
- Rent growth +3.0/5.0
- Condition / age +2.5/5.0
- Appreciation +0.0/10.0
$280,000
🖨 Deal sheet (PDF) 📄 Offer letter ✓ Due diligence
Listing remarks MLS
Terrific opportunity to own a newly renovated 1700 Sq ft home. Beautiful kitchen with stainless steel appliances, cooktop Island and more. New metal roof and vinyl plank flooring thoughout and so much more. .. a must see, call for more info and an appointment! Cash or conventional loan
Key facts
- Spacious
- Open-concept kitchen
- New septic tank
Tags
Property features AI
Finance
- Other: Property type: Residential, single family; Lot size about 0.17 acre (approximately 0 to less than 1/4 acre)
- Financial info: No lease restrictions
- HOA & community: No HOA/association
Exterior
- Parking: No parking details provided
- Utilities: Public water; Septic tank sewer; Cable available
- Home design: Single family residence; One story; Faces south
- Construction: Block construction; Metal roof; Slab foundation; Built on or before 2026
- Exterior features: Private mailbox; Asphalt road frontage
Interior
- Kitchen: Built-in oven; Cooktop; Dishwasher
- Bedrooms: 5 bedrooms
- Flooring: Laminate
- Bathrooms: 2 full bathrooms
- Heating & cooling: Electric heating; Central air conditioning
- Interior features: Ceiling fans; Kitchen/family room combo; Living room/dining room combo
- Laundry & utility: Laundry: Other
Neighborhood map
What this means for you Summary
Snapshot
- This is a 5-bed/2.0-bath single-family listed at $280k.
Deal economics
- At list price, monthly cash flow is $135 ($2k/yr) — positive.
- The deal already cash-flows at list — no discount required.
- To meet the 1% rule (rent ≥ 1% of price), the offer needs to be $251k (10.3% below list).
- Recommended offer: $251k (10.3% below list) — sets the bar for 1% rule.
Location & tenants
- Location reads 66/100 on livability (#594 in FL) — a middle-class / working-renter tenant base. Strengths: cost of living A+, housing A+, health & safety A; Watch: amenities F, commute F, employment F.
- Polk (suburban): math 39% / reading 43% proficiency, ranked #62 of 73 in FL (top 85%) — families likely to look elsewhere, expect single-tenant / working-renter base with shorter leases.
- Zoned schools: Fred G. Garner Elementary School (math 29% / reading 31%, grade F, #1,882 of 2,144 statewide, top 88%, 901 students, 62% FRL); Westwood Middle School (math 19% / reading 26%, grade F, #546 of 571 statewide, top 96%, 878 students, 70% FRL); Auburndale Senior High School (math 25% / reading 31%, grade F, #464 of 667 statewide, top 70%, 1,716 students, 53% FRL) — zoned schools at 62% FRL track the district average.
- Zoned-school proficiency averages 27% at this address vs 41% district-wide (-14 pts) — the specific schools serving this property underperform the Polk average; the district grade overstates school quality for this exact location.
- Market conditions: Rents rising (+2.1%/yr); 495 active listings in the ZIP; 2 comparable units currently listed for rent nearby; 10,384 units permitted in Polk County in 2024 (1,716 in 5+ unit buildings).
- At $2,511/mo this rent would consume 53% of the median local household income ($57k/yr) (locally 1270% of renters already pay >50% of income on rent) — very limited rent-growth headroom before tenants either downsize or default.
Forward outlook
- Local home prices are declining (-3.0%/yr); year-one equity from $2k of loan paydown is wiped out by about $8k of value loss. Plan a longer hold.
- Polk County population projected at +33% by 2050 — long-run rental-demand tailwind backs the buy-and-hold thesis.
Negotiation context
- Only 1 days on market — expect competitive offers; lowballing is unlikely to land.
- 5 sale attempts since 14y ago; this cycle's ask is 900% above the opening price — seller raised mid-cycle; expect resistance to lowballs.
- Current owner paid $200k; 40% above their basis — modest negotiation headroom, anchor on the comps not their cost.
Risks & watch-outs
- Climate carrying-cost: severe wind risk, 99% chance of damaging wind over 30y; extreme-heat days projected 7→23/yr by 2055 (HVAC capex compounding) — expect insurance premiums to compound above CPI over the hold.
Questions for the listing agent
- Built in 1960 — when were the roof, HVAC, electrical panel, plumbing, and water heater last replaced?
- Is there a deadline driving the sale (1031 exchange, divorce, estate, relocation)? That informs how much negotiation room exists.
- Schools are D-rated, which usually means shorter tenancies and higher turnover. Who's the typical renter profile here, and what's been the actual vacancy rate?
- The area grade is low — what's the realistic commute time and amenity access for the typical tenant pool here? Any planned neighborhood developments (good or bad) we should know about?
- What's the average days-on-market for RENTAL listings here right now (not sales)? A rising rental-DOM trend means longer vacancies and softer asking-rent achievability than the comps imply.
- What's the recent tenant-quality profile in this submarket — average credit score on applications, eviction rate, late-payment / NSF rate, and stable-employment percentage? A property-management company in the area should have these aggregated.
- How much new for-sale + rental construction is in the pipeline within 1–3 miles? Heavy new supply typically softens prices + rents 12–24 months out; constrained supply supports both.
Investment metrics
- 1% rule
- 0.90% ✗
- Cap rate
- 6.87%
- Cash-on-cash
- 2.06%
- DSCR
- 1.09
- GRM
- 9.3
CMA / ARV
No comps found within radius.
Projected returns pro-forma
-3.0% appreciation · 2.1% rent growth · sell at horizon
- IRR
- -14.0%
- Equity multiple
- 0.50×
- Total profit
- $-39,059
- Equity at exit
- $41,749
- IRR
- -6.7%
- Equity multiple
- 0.59×
- Total profit
- $-32,105
- Equity at exit
- $24,209
Cash invested: $78,400 (down + closing). Projections, not guarantees.
Landlord ↔ Tenant lean methodology
- Overall (STATE)
- 87 Strongly Landlord-Friendly
- State Florida
- 87 Strongly Landlord-Friendly · R+3
- County
- — inherits STATE
- City
- — inherits STATE
ZIP-level market 33881
- Home prices YoY
- -24.3%
- Rents YoY
- 2.1%
- Active inventory
- 495
- Price-to-rent
- 9.3×
Monthly cashflow live
- Estimated rent
- $2,511 medium interval (Pro) →
- Mortgage (P&I)
- −$1,468
- Tax from tax record
- −$264 /mo · $3,170/yr
- Insurance
- −$117
- HOA
- −$0
- Vacancy / Maint / Mgmt
- −$527
- Net cashflow
- $135
Break-even live
Sensitivity live
| Price | -10% $293 | -5% $214 | +0% $135 | +5% $55 | +10% $-24 |
|---|---|---|---|---|---|
| Rent | -10% $-64 | -5% $36 | +0% $135 | +5% $234 | +10% $333 |
| Rate | -1.0pp $276 | -0.5pp $206 | base $135 | +0.5pp $62 | +1.0pp $-12 |
UW: 25.0% down · 7.5% · 30yr · 1.5% tax · 5.0% vac · 8.0% maint · 8.0% mgmt
Financing live
Cash to close
- Down payment
- $70,000
- Closing costs
- $8,400
- Reserves months
- —
- Total cash needed
- —
Loan-product check · same deal, 3 products live
Conventional
25% down · 7.5% · 30yr
- Down + closing
- —
- Monthly P&I
- —
- Monthly cashflow
- —
- DSCR
- —
- Eligible?
- —
Personal DTI + credit; lowest rate.
DSCR
20% down · 8.5% · 30yr
- Down + closing
- —
- Monthly P&I
- —
- Monthly cashflow
- —
- DSCR
- —
- Eligible?
- —
No personal income docs; deal must DSCR.
Hard money
10% down · 12.0% · 12mo
- Down + closing
- —
- Monthly P&I
- —
- Monthly cashflow
- —
- DSCR
- —
- Eligible?
- —
Short-term bridge; refi at stabilization.
Rent comps 2 comps
| Address | Beds | Baths | Sqft | Rent | $/sqft | DOM | Units | Dist |
|---|---|---|---|---|---|---|---|---|
| 3110 Avenue U NW Winter Haven, FL | 4.0 | 2.0 | 1256 | $2,075 | $1.65 | 25d | 1 | 0.32mi |
| 1407 28th St NW Winter Haven, FL | 4.0 | 2.0 | 1709 | $1,800 | $1.05 | 25d | 1 | 0.53mi |
Listing history 2 events
-
2026-06-22remarks 699-char remark
-
2026-06-22$280,000 Active 1 DOM
ⓘ Source: listings_history table (triggers on properties + properties_extension) + one-shot
backfill from property_details.listing_events for pre-trigger history.
Tax reassessment forecast FL · Resets to sale price
- Current annual tax
- $3,170 · $264/mo
- Projected year-2 tax
- $3,170 · $264/mo
- Expected delta
- $0/yr ($0/mo · 0.0%)
ⓘ Screening estimate from a state-policy table — verify with the county assessor before closing.
Climate risk First Street
- Flood 1/10 Low FEMA zone X (unshaded) · 0% chance over 30 yrs
- Wildfire 3/10 Moderate
- Heat 8/10 Severe 7 d/yr ≥107°F today · 23 d/yr by 30 yrs out
- Wind 9/10 Extreme 99% chance of damaging wind over 30 yrs
- Air quality 2/10 Low 2 unhealthy d/yr today · 2 by 30 yrs out
Nearby sold comps map
Loading sold comps map…
Walkable amenities ~0.75 mi
Loading nearby amenities…
Taxation est. · year 1
- Rental income
- $30,136
- − Mortgage interest
- −$15,684
- − Property taxes
- −$3,170
- − Insurance
- −$1,400
- − Repairs & maintenance
- −$2,411
- − Management
- −$2,411
- − Depreciation
- −$8,145
- Taxable loss
- −$3,086
- Est. tax savings @ 24.0%
- +$741
- After-tax cash flow
- $2,358/yr
For passive investors: Depreciation is non-cash, so a rental often shows a tax loss while cash-flowing — sheltering income. Rental losses are passive: they offset passive income freely, and up to $25,000/yr can offset ordinary (W-2) income if you actively participate and your MAGI is under $100k (phasing out to $0 by $150k); unused losses carry forward. On sale, claimed depreciation is recaptured at up to 25%, and gains may owe capital-gains tax (a 1031 exchange can defer both). Figures are a year-1 estimate at your 24.0% rate — not tax advice; consult a CPA.
Schools (NCES district)
- District
- Polk
- NCES district ID
- 1201590
- Math proficiency
- 39% ▼ -11.00%
- Reading proficiency
- 43% ▼ -4.00%
- Median HH income
- $43,979
- Composite
- 34.74/100
- National rank
- #5132
- State rank
- #62 of 73 in FL
Livability — Inwood
- Score
- 66/100
- State rank
- #594
- US rank
- #11391
Category grades
Schools grade is shown separately in the Schools card above.
Census & demographics
- Census place
- Inwood, FL
- County
- Polk County · 740,051 people
- Metro
- Lakeland-Winter Haven, FL
- Population (ZIP)
- 40,808
- Household income
- $57,024
- Rent vs Own
- Severe rent burden
- 1270.0
Population outlook (Polk County) Hauer SSP2
- Today (2025)
- 752,975 people
- By 2030
- 804,621 · +6.9%
- By 2040
- 906,117 · +20.3%
- By 2050
- 1,000,476 · +32.9%
- By 2075
- 1,197,520 · +59.0%
- By 2100
- 1,271,518 · +68.9%
Race, ethnicity, and origin ACS 2023
- Neighborhood character
- Diverse neighborhood (Simpson 0.68)
- Race & ethnicity
- White 44% Black 27% Hispanic / Latino 25% Two or more races 15%
- Hispanic origin (detail)
- Mexican 4% Puerto Rican 12% Cuban 1%
- Common ancestry
- Hispanic 5% Slovak 1% Italian 1%
- Foreign-born
- 15% · Canada, Jamaica
- Languages at home
- 73% English-only · Spanish 20% French/Haitian/Cajun 6%
Political lean MEDSL · Polk
- 2024 margin
- Strong R (+20.7) · D 39.2% · R 59.9%
- 2008→2024 swing
- -14.6pp toward R · 2008: -6.1pp · 2024: -20.7pp
- All cycles
- 2024: R+20.7 2020: R+14.4 2016: R+14.1 2012: R+6.8 2008: R+6.1
Not yet ingested
- Civics
- —
Market trends
- HPI YoY
- ▼ -88.95%
- Current HPI
- 277.0597
- Rent YoY
- ▲ 2.10%
- Metro
- Lakeland-Winter Haven, FL
- State GDP YoY
- ▲ 3.28%
- F500 in state
- 36
Industry mix (Fortune 500 HQ in FL)
| Industry | F500 HQs | Revenue |
|---|---|---|
| Industrial Technology | 2 | $29B |
|
||
| Insurance | 2 | $17B |
|
||
| Retail | 1 | $60B |
|
||
| Technology Distribution | 1 | $58B |
|
||
| Homebuilding | 1 | $35B |
|
||
| Technology Manufacturing | 1 | $35B |
|
||
Price history
+288.9% since first listed13 events — show timeline
- 2026-06-20 Price Changed $280,000 Stellar MLS as Distributed by MLS Grid
- 2026-06-20 Listed $28,000 Stellar MLS as Distributed by MLS Grid
- 2022-04-06 Sold (MLS) $200,000 Stellar MLS as Distributed by MLS Grid
- 2022-02-21 Sold (Public Records) $200,000 Public Records
- 2021-10-29 Pending — Stellar MLS as Distributed by MLS Grid
- 2021-10-21 Price Changed $209,000 Stellar MLS as Distributed by MLS Grid
- 2021-10-19 Relisted — Stellar MLS as Distributed by MLS Grid
- 2021-10-19 Listed $219,000 Stellar MLS as Distributed by MLS Grid
- 2021-10-19 Listing Removed — Stellar MLS as Distributed by MLS Grid
- 2021-09-09 Sold (Public Records) $70,000 Public Records
- 2015-07-21 Sold (Public Records) $65,000 Public Records
- 2013-01-04 Listed $69,900 Stellar MLS as Distributed by MLS Grid
- 2012-04-09 Listed $72,000 Stellar MLS as Distributed by MLS Grid
Property tax history
+18.8%/yrLatest (2025): $3,170 · +9.8% YoY. Source: county tax records.
Cash-flow waterfall
monthlySold comps — $/sqft
last 12 mo · ≤1 miLoading sold comps…