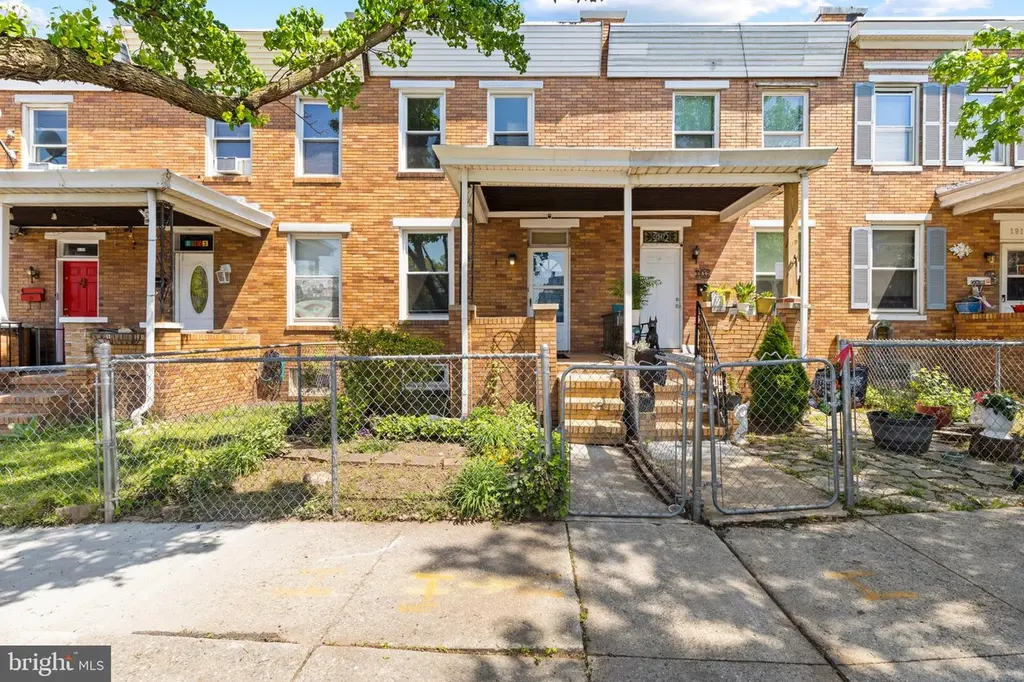
1915 Griffis Ave · Baltimore, MD
Flood risk 1/10 · Minimal
- FEMA flood zone
- X (unshaded)
- Chance of flooding over 30 yrs
- 0.0%
- Est. flood insurance / yr
- $473 – $860
Fire risk 1/10 · Minimal
- Est. fire insurance / yr
- $755 – $1,403
Heat risk 8/10 · Major
- Hot days now (above 103°F)
- 7 days/yr
- Hot days in 30 yrs
- 15 days/yr
Wind risk 6/10 · Moderate
- Chance of severe wind over 30 yrs
- 27.0%
Air-quality risk 3/10 · Minor
- Unhealthy air days now
- 3 days/yr
- Unhealthy air days in 30 yrs
- 4 days/yr
Risk factors via First Street. Map © Google.
Why this score? — see what drove the C grade
The composite is a weighted blend of 9 inputs, each scored 0–100. Each bar is that input's sub-score; the figure is the points it added to the 100-point composite (weight × sub-score).
- Cash flow +29.4/30.0
- DSCR +10.0/10.0
- 1% rule +7.7/10.0
- Livability +3.8/5.0
- Condition / age +2.5/5.0
- Rent growth +2.2/5.0
- Schools +1.0/10.0
- ARV discount +0.0/15.0
- Appreciation +0.0/10.0
$129,900
🖨 Deal sheet (PDF) 📄 Offer letter ✓ Due diligence
Listing remarks
Welcome to 1915 Griffis Ave — a 2-bedroom, 1-bath brick rowhome in Morrell Park with major upgrades already done for you. This home is move-in ready on the main level, featuring brand-new luxury vinyl plank flooring throughout the living room, dining room, and kitchen. A brand-new furnace was just installed — buy with confidence knowing your biggest-ticket mechanical system is covered. All front-facing windows have also been recently replaced, improving energy efficiency and curb appeal. The main level flows from a spacious living room through a charming arched doorway into the dining area, then into a galley kitchen with white cabinetry, laminate counters, a gas range, and rear
Key facts
- Built 1925
- Listed 42 days
Property features AI
Exterior
- Parking: On-street parking
- Utilities: Public water; Public sewer; Electric cooling fuel; Natural gas heating and hot water
- Home design: Interior townhouse / rowhouse; Above-grade and below-grade finished space recorded
- Construction: Brick construction; Brick/mortar foundation
- Exterior features: Located in city limits; Cross street: Washington Blvd.; Directions: From Washington Blvd. turn right onto Grinnalds Ave. then left
Interior
- Bedrooms: Two bedrooms on the upper level
- Bathrooms: One full bathroom
- Heating & cooling: Forced air heating; Ceiling fan cooling (electric); Natural gas hot water
- Interior features: Finished above-grade living area per assessor; Basement present (finished and unfinished areas)
Neighborhood map
What this means for you Summary
Snapshot
- This is a 2-bed/1.0-bath townhouse listed at $130k.
Deal economics
- At list price, monthly cash flow is $461 ($6k/yr) — positive.
- The deal already cash-flows at list — no discount required.
- Meets the 1% rule at list price ($2k rent vs $130k).
- Recommended offer: $126k (3.0% below list) — sets the bar for market timing.
- Cap rate 10.6% vs local median 6.0% in Baltimore — top-decile yield for the area; either an underpriced asset or a hidden risk that comps aren't pricing in. Stress-test before assuming the spread holds.
Location & tenants
- Location reads 76/100 on livability (#90 in MD, #3,396 nationally) — a middle-class / working-renter tenant base. Strengths: amenities A+, commute A+, housing A+; Watch: crime F.
- Baltimore City Public Schools (urban): math 7% / reading 16% proficiency, ranked #24 of 24 in MD (top 100%) — low school quality limits family demand, transient renter base, plan for 1-2y turnover; 79% free/reduced lunch — lower-income household profile, screen leases tightly.
- Zoned schools: Morrell Park Elementary/Middle (math 5% / reading 9%, grade F, #726 of 860 statewide, top 86%, 419 students, 74% FRL); Booker T. Washington Middle (math 2% / reading 8%, grade F, #223 of 225 statewide, top 99%, 157 students, 90% FRL); Baltimore City College (math 50% / reading 79%, grade B-, #55 of 222 statewide, top 26%, 1,497 students, 46% FRL).
- Zoned-school proficiency averages 26% at this address vs 12% district-wide (+14 pts) — the actual schools serving this property are materially stronger than the Baltimore City Public Schools average implies; a family-tenant draw the district grade alone would hide.
- Market conditions: Rents soft (-1.0%/yr); 362 active listings in the ZIP; 40 comparable units currently listed for rent nearby; rentals at typical pace (median 25d on market — plan ~3-4 weeks tenant-placement turnaround); solid renter incomes; 1,273 units permitted in Baltimore city in 2024 (1,104 in 5+ unit buildings).
Forward outlook
- Local home prices are declining (-3.0%/yr); year-one equity from $898 of loan paydown is wiped out by about $4k of value loss. Plan a longer hold.
- Baltimore County population projected to shrink 4% by 2050 — rents likely to lag national; underwrite the cash flow, not the appreciation.
Negotiation context
- It's been on market 42 days — a 3% lower offer ($126k) is reasonable based on typical stale-listing flexibility.
- 2 sale attempts with the ask held roughly flat each time — persistent listings suggest the price (not the market) is what's stuck; bring a comps-based counter.
- Current owner paid $38k; list at $130k implies a 246% gain — meaningful room to come down on a strong offer.
Risks & watch-outs
- Watch-outs: built in 1925 — expect roof / HVAC / electrical / plumbing capex.
- Climate carrying-cost: major wind risk, 27% chance of damaging wind over 30y; extreme-heat days projected 7→15/yr by 2055 (HVAC capex compounding) — expect insurance premiums to compound above CPI over the hold.
Questions for the listing agent
- It's been on market 42 days. Have you received any prior offers? Is the seller open to a 3% concession, seller financing, or rate buy-down credit?
- Built in 1925 — when were the roof, HVAC, electrical panel, plumbing, and water heater last replaced?
- Is there a deadline driving the sale (1031 exchange, divorce, estate, relocation)? That informs how much negotiation room exists.
- Schools are D-rated, which usually means shorter tenancies and higher turnover. Who's the typical renter profile here, and what's been the actual vacancy rate?
- Crime grade is F in this area — have there been break-ins, vandalism, or insurance claims at this property in the last 3 years? What carrier currently insures it and at what premium?
- What's the average days-on-market for RENTAL listings here right now (not sales)? A rising rental-DOM trend means longer vacancies and softer asking-rent achievability than the comps imply.
- What's the recent tenant-quality profile in this submarket — average credit score on applications, eviction rate, late-payment / NSF rate, and stable-employment percentage? A property-management company in the area should have these aggregated.
- How much new for-sale + rental construction is in the pipeline within 1–3 miles? Heavy new supply typically softens prices + rents 12–24 months out; constrained supply supports both.
Investment metrics
- 1% rule
- 1.27% ✓
- Cap rate
- 10.55%
- Cash-on-cash
- 15.21%
- DSCR
- 1.68
- GRM
- 6.6
CMA / ARV
- ARV (median comp)
- $102,041
- List price
- $129,900
- Delta
- 27.30%
- Verdict
- OVERPRICED
- Comps
- 20 within 1.0 mi
Show comp detail 12 sales within ~0.75 mi
| Address | Dist | Beds/Ba | Sqft | Sold | Price | $/sf | Match |
|---|---|---|---|---|---|---|---|
| 1935 Grinnalds Ave | 0.07mi | 3/2.0 (+1) | 1,080 (-4%) | 1mo | $119,000 | $110 | 81 |
| 2149 Harman Ave | 0.25mi | 2/1.0 | 1,050 (-6%) | 2mo | $115,000 | $110 | 76 |
| 2527 Tolley St | 0.26mi | 2/1.0 | 1,050 (-6%) | 6mo | $120,000 | $114 | 72 |
| 2809 Washington Blvd | 0.43mi | 3/1.0 (+1) | 1,110 (-1%) | 3mo | $80,000 | $72 | 70 |
| 2036 Deering Ave | 0.42mi | 3/1.5 (+1) | 1,112 (-1%) | 3mo | $129,900 | $117 | 70 |
| 2014 Grinnalds Ave | 0.11mi | 2/2.0 | 1,015 (-10%) | 6mo | $80,000 | $79 | 69 |
| 1913 Harman Ave | 0.10mi | 2/1.0 | 1,288 (+15%) | 4mo | $105,000 | $82 | 68 |
| 2521 S Paca St | 0.45mi | 3/1.5 (+1) | 1,152 (+3%) | 1mo | $30,000 | $26 | 67 |
| 2138 Whistler Ave | 0.28mi | 2/1.0 | 1,260 (+12%) | 0mo | $145,000 | $115 | 66 |
| 2000 Hollins Ferry Rd | 0.20mi | 3/1.5 (+1) | 1,248 (+11%) | 1mo | $135,000 | $108 | 64 |
| 1710 Wickes Ave | 0.41mi | 3/2.0 (+1) | 1,024 (-9%) | 3mo | $150,000 | $146 | 55 |
| 2625 Waterview Ave | 0.74mi | 3/1.0 (+1) | 1,260 (+12%) | 6mo | $94,200 | $75 | 35 |
Match score weights: distance 35% · size 25% · config 20% · recency 20%. Top-matched comps best support the ARV.
Projected returns pro-forma
-3.0% appreciation · 0.0% rent growth · sell at horizon
- IRR
- 2.6%
- Equity multiple
- 1.10×
- Total profit
- $3,471
- Equity at exit
- $19,369
- IRR
- 9.1%
- Equity multiple
- 1.61×
- Total profit
- $22,130
- Equity at exit
- $11,231
Cash invested: $36,372 (down + closing). Projections, not guarantees.
Landlord ↔ Tenant lean methodology
- Overall (CITY)
- 12 Strongly Tenant-Friendly
- State Maryland
- 27 Tenant-Leaning · D+14
- County
- — inherits STATE
- City Baltimore
- 12 Strongly Tenant-Friendly · D+58
ZIP-level market 21230
- Rents YoY
- -1.0%
- Active inventory
- 362
- Price-to-rent
- 6.6×
Monthly cashflow live
- Estimated rent
- $1,647 high interval (Pro) →
- Mortgage (P&I)
- −$681
- Tax from tax record
- −$105 /mo · $1,258/yr
- Insurance
- −$54
- HOA
- −$0
- Vacancy / Maint / Mgmt
- −$346
- Net cashflow
- $461
Break-even live
Sensitivity live
| Price | -10% $534 | -5% $498 | +0% $461 | +5% $424 | +10% $387 |
|---|---|---|---|---|---|
| Rent | -10% $331 | -5% $396 | +0% $461 | +5% $526 | +10% $591 |
| Rate | -1.0pp $526 | -0.5pp $494 | base $461 | +0.5pp $427 | +1.0pp $393 |
UW: 25.0% down · 7.5% · 30yr · 1.5% tax · 5.0% vac · 8.0% maint · 8.0% mgmt
Financing live
Cash to close
- Down payment
- $32,475
- Closing costs
- $3,897
- Reserves months
- —
- Total cash needed
- —
Loan-product check · same deal, 3 products live
Conventional
25% down · 7.5% · 30yr
- Down + closing
- —
- Monthly P&I
- —
- Monthly cashflow
- —
- DSCR
- —
- Eligible?
- —
Personal DTI + credit; lowest rate.
DSCR
20% down · 8.5% · 30yr
- Down + closing
- —
- Monthly P&I
- —
- Monthly cashflow
- —
- DSCR
- —
- Eligible?
- —
No personal income docs; deal must DSCR.
Hard money
10% down · 12.0% · 12mo
- Down + closing
- —
- Monthly P&I
- —
- Monthly cashflow
- —
- DSCR
- —
- Eligible?
- —
Short-term bridge; refi at stabilization.
Rent comps 40 comps
| Address | Beds | Baths | Sqft | Rent | $/sqft | DOM | Units | Dist |
|---|---|---|---|---|---|---|---|---|
| 1931 Griffis Ave Baltimore, MD | 2.0 | 1.0 | 912 | $1,349 | $1.48 | 5d | 1 | 0.03mi |
| 2429 Washington Blvd Baltimore, MD | 1.0 | 1.0 | 940 | $600 | $0.64 | 24d | 1 | 0.07mi |
| 2056 Griffis Ave Baltimore, MD | 3.0 | 1.5 | 1230 | $1,495 | $1.22 | 22d | 1 | 0.15mi |
| 2737 Wilkens Ave Baltimore, MD | 3.0 | 1.5 | 1232 | $1,650 | $1.34 | 5d | 1 | 0.83mi |
| 2671 Saint Benedict St Baltimore, MD | 2.0 | 1.0 | 1144 | $1,325 | $1.16 | 44d | 1 | 0.86mi |
| 2738 Wilkens Ave Baltimore, MD | 3.0 | 1.0 | 1183 | $1,500 | $1.27 | 44d | 1 | 0.86mi |
| 3004 Elizabeth Ave Unit 1 Baltimore, MD | 3.0 | 1.0 | 1024 | $1,395 | $1.36 | 5d | 1 | 0.87mi |
| 3017 Janice Ave Baltimore, MD | 3.0 | 1.0 | 1024 | $1,995 | $1.95 | 24d | 1 | 0.88mi |
| 514 S Payson St Unit 2 Baltimore, MD | 3.0 | 2.0 | 1264 | $1,750 | $1.38 | 44d | 1 | 0.91mi |
| 2657 Lehman St Unit 1 Baltimore, MD | 2.0 | 1.0 | 1056 | $1,000 | $0.95 | 44d | 1 | 0.95mi |
| 1432 Carroll St Baltimore, MD | 2.0 | 1.5 | 912 | $1,900 | $2.08 | 44d | 1 | 1.01mi |
| 2600 W Patapsco Ave Baltimore, MD | 1.0–2.0 | 1.0 | 856 | $1,309 | $1.53 | 3d | 24 | 1.02mi |
| 2540 Frederick Ave Baltimore, MD | 3.0 | 1.0 | 1075 | $1,400 | $1.30 | 24d | 1 | 1.10mi |
| 307 S Smallwood St Baltimore, MD | 2.0 | 2.5 | 1400 | $1,350 | $0.96 | 44d | 1 | 1.10mi |
| 332 S Franklintown Rd Unit 2 Baltimore, MD | 2.0 | 1.0 | 776 | $795 | $1.02 | 24d | 1 | 1.11mi |
| 2200 W Patapsco Ave Baltimore, MD | 3.0 | 1.0 | 890 | $1,569 | $1.76 | 44d | 1 | 1.14mi |
| 1303 James St Baltimore, MD | 2.0 | 1.5 | 1160 | $1,350 | $1.16 | 24d | 1 | 1.15mi |
| 1127 S Carey St Baltimore, MD | 3.0 | 2.5 | 1340 | $1,900 | $1.42 | 5d | 1 | 1.18mi |
| 1101 S Carey St Baltimore, MD | 2.0 | 2.0 | 1400 | $1,200 | $0.86 | 22d | 1 | 1.19mi |
| 1259 Washington Blvd Baltimore, MD | 3.0 | 3.0 | 1232 | $2,999 | $2.43 | 5d | 1 | 1.20mi |
| 1708 Hall Ave Unit 2 Halethorpe, MD | 2.0 | 1.0 | 845 | $1,625 | $1.92 | 12d | 1 | 1.21mi |
| 1262 Glyndon Ave Baltimore, MD | 2.0 | 3.0 | 1258 | $1,850 | $1.47 | 24d | 1 | 1.21mi |
| 1243 Washington Blvd Baltimore, MD | 3.0 | 2.0 | 1148 | $1,950 | $1.70 | 44d | 1 | 1.22mi |
| 1253 Sargeant St Baltimore, MD | 2.0 | 1.5 | 1200 | $1,695 | $1.41 | 24d | 1 | 1.22mi |
| 110 S Catherine St Unit 1 Baltimore, MD | 2.0 | 1.0 | 1330 | $1,500 | $1.13 | 44d | 1 | 1.23mi |
| 1205 Cleveland St Baltimore, MD | 2.0 | 2.0 | 1232 | $1,900 | $1.54 | 44d | 1 | 1.25mi |
| 1215 James St Baltimore, MD | 2.0 | 1.0 | 960 | $1,500 | $1.56 | 44d | 1 | 1.26mi |
| 305 S Calhoun St Baltimore, MD | 2.0 | 1.0 | 1000 | $1,300 | $1.30 | 22d | 1 | 1.27mi |
| 1163 Washington Blvd Baltimore, MD | 2.0 | 2.5 | 1012 | $1,700 | $1.68 | 13d | 1 | 1.30mi |
| 3130 Stafford St Baltimore, MD | 3.0 | 1.0 | 1200 | $1,500 | $1.25 | 21d | 1 | 1.30mi |
| 1160 Washington Blvd Baltimore, MD | 2.0 | 1.0 | 960 | $1,575 | $1.64 | 24d | 1 | 1.31mi |
| 1142 Sargeant St Baltimore, MD | 3.0 | 2.0 | 1080 | $1,601 | $1.48 | 2d | 1 | 1.34mi |
| 1127 Sargeant St Baltimore, MD | 2.0 | 1.5 | 1080 | $1,275 | $1.18 | 24d | 1 | 1.34mi |
| 2537 Hollins St Baltimore, MD | 3.0 | 2.0 | 1200 | $1,450 | $1.21 | 24d | 1 | 1.34mi |
| 1132 Nanticoke St Baltimore, MD | 2.0 | 2.5 | 1500 | $1,875 | $1.25 | 24d | 1 | 1.35mi |
| 2516 Hollins St Baltimore, MD | 3.0 | 2.0 | 1100 | $1,700 | $1.55 | 44d | 1 | 1.36mi |
| 3392 Saint Benedict St Baltimore, MD | 2.0 | 1.0 | 864 | $1,450 | $1.68 | 24d | 1 | 1.37mi |
| 1125 Wicomico St Baltimore, MD | 3.0 | 3.0 | 1068 | $1,955 | $1.83 | 24d | 1 | 1.37mi |
| 2225 W Baltimore St Baltimore, MD | 3.0 | 2.5 | 1200 | $1,600 | $1.33 | 24d | 1 | 1.37mi |
| 2232 W Baltimore St Baltimore, MD | 3.0 | 1.0 | 1250 | $1,875 | $1.50 | 24d | 1 | 1.39mi |
Listing history 20 events
-
2026-06-18days on market $129,900 Active 42 DOM
-
2026-06-17days on market $129,900 Active 41 DOM
-
2026-06-16days on market $129,900 Active 40 DOM
-
2026-06-15days on market $129,900 Active 39 DOM
-
2026-06-13days on market $129,900 Active 37 DOM
-
2026-06-09days on market $129,900 Active 33 DOM
-
2026-06-08days on market $129,900 Active 32 DOM
-
2026-06-07days on market $129,900 Active 31 DOM
-
2026-06-04days on market $129,900 Active 28 DOM
-
2026-06-03days on market $129,900 Active 27 DOM
-
2026-06-02days on market $129,900 Active 26 DOM
-
2026-06-01days on market $129,900 Active 25 DOM
-
2026-05-31days on market $129,900 Active 24 DOM
-
2026-05-07$134,900 Active 1495-char remark
-
2026-02-02status Pending
-
2026-02-02historical
-
2025-12-05price $135,000
-
2025-10-21price $142,000
-
2025-08-12$149,900 Active
-
1986-10-06soldstatus $37,500
ⓘ Source: listings_history table (triggers on properties + properties_extension) + one-shot
backfill from property_details.listing_events for pre-trigger history.
Tax reassessment forecast MD · Partial reset (capped growth)
- Current annual tax
- $1,258 · $105/mo
- Projected year-2 tax
- $1,337 · $111/mo
- Expected delta
- +$79/yr (+$7/mo · 6.3%)
ⓘ Screening estimate from a state-policy table — verify with the county assessor before closing.
Climate risk First Street
- Flood 1/10 Low FEMA zone X (unshaded) · 0% chance over 30 yrs
- Wildfire 1/10 Low
- Heat 8/10 Severe 7 d/yr ≥103°F today · 15 d/yr by 30 yrs out
- Wind 6/10 Major 27% chance of damaging wind over 30 yrs
- Air quality 3/10 Moderate 3 unhealthy d/yr today · 4 by 30 yrs out
Nearby sold comps map
Loading sold comps map…
Walkable amenities ~0.75 mi
Loading nearby amenities…
Taxation est. · year 1
- Rental income
- $19,764
- − Mortgage interest
- −$7,276
- − Property taxes
- −$1,258
- − Insurance
- −$650
- − Repairs & maintenance
- −$1,581
- − Management
- −$1,581
- − Depreciation
- −$3,779
- Taxable income
- $3,639
- Est. tax owed @ 24.0%
- −$873
- After-tax cash flow
- $4,658/yr
For passive investors: Depreciation is non-cash, so a rental often shows a tax loss while cash-flowing — sheltering income. Rental losses are passive: they offset passive income freely, and up to $25,000/yr can offset ordinary (W-2) income if you actively participate and your MAGI is under $100k (phasing out to $0 by $150k); unused losses carry forward. On sale, claimed depreciation is recaptured at up to 25%, and gains may owe capital-gains tax (a 1031 exchange can defer both). Figures are a year-1 estimate at your 24.0% rate — not tax advice; consult a CPA.
Schools (NCES district)
- District
- Baltimore City Public Schools
- NCES district ID
- 2400090
- Math proficiency
- 7% ▼ -9.00%
- Reading proficiency
- 16% ▼ -5.00%
- Median HH income
- $42,108
- Composite
- 10.08/100
- National rank
- #9805
- State rank
- #24 of 24 in MD
Livability — Baltimore
- Score
- 76/100
- State rank
- #90
- US rank
- #3396
Category grades
Schools grade is shown separately in the Schools card above.
Census & demographics
- Census place
- Baltimore, MD
- County
- Baltimore City · 558,601 people
- City population
- 588,727
- Metro
- Baltimore-Columbia-Towson, MD
- Population (ZIP)
- 32,977
- Household income
- $91,842
- Rent vs Own
- Severe rent burden
- 1463.0
Population outlook (Baltimore County) Hauer SSP2
- Today (2025)
- 624,249 people
- By 2030
- 621,541 · -0.4%
- By 2040
- 609,756 · -2.3%
- By 2050
- 597,249 · -4.3%
- By 2075
- 552,236 · -11.5%
- By 2100
- 513,934 · -17.7%
Race, ethnicity, and origin ACS 2023
- Neighborhood character
- Diverse neighborhood (Simpson 0.63)
- Race & ethnicity
- White 55% Black 23% Hispanic / Latino 13% Two or more races 6% Asian 4%
- Hispanic origin (detail)
- Mexican 1% Puerto Rican 1%
- Common ancestry
- Romanian 5% Lithuanian 2% Italian 2%
- Foreign-born
- 10% · Canada, China
- Languages at home
- 85% English-only · Spanish 9% Other Indo-European 1% Other Asian/Pacific 1%
Political lean MEDSL · Baltimore
- 2024 margin
- Solid D (+73.0) · D 85.2% · R 12.2% · Other 2.6%
- 2008→2024 swing
- -2.5pp toward R · 2008: 75.5pp · 2024: 73.0pp
- All cycles
- 2024: D+73.0 2020: D+76.6 2016: D+74.6 2012: D+76.4 2008: D+75.5
Not yet ingested
- Civics
- —
Market trends
- HPI YoY
- ▼ -311.43%
- Current HPI
- 284.338
- Rent YoY
- ▼ -1.00%
- Metro
- Baltimore-Columbia-Towson, MD
- State GDP YoY
- ▲ 2.97%
- F500 in state
- 12
Industry mix (Fortune 500 HQ in MD)
| Industry | F500 HQs | Revenue |
|---|---|---|
| Aerospace / Defense | 1 | $71B |
|
||
| Utilities | 1 | $25B |
|
||
| Hotels | 1 | $24B |
|
||
| Consumer Goods | 1 | $7B |
|
||
| Real Estate | 1 | $6B |
|
||
| Chemicals | 1 | $2B |
|
||
Price history
+246.4% since first listed8 events — show timeline
- 2026-05-22 Price Changed $129,900 BRIGHT MLS
- 2026-05-07 Listed $134,900 BRIGHT MLS
- 2026-02-02 Pending — BRIGHT MLS
- 2026-02-02 Listing Removed — BRIGHT MLS
- 2025-12-05 Price Changed $135,000 BRIGHT MLS
- 2025-10-21 Price Changed $142,000 BRIGHT MLS
- 2025-08-12 Listed $149,900 BRIGHT MLS
- 1986-10-06 Sold (Public Records) $37,500 Public Records
Property tax history
-3.0%/yrLatest (2025): $1,258 · +5.3% YoY. Source: county tax records.
Cash-flow waterfall
monthlySold comps — $/sqft
last 12 mo · ≤1 miLoading sold comps…