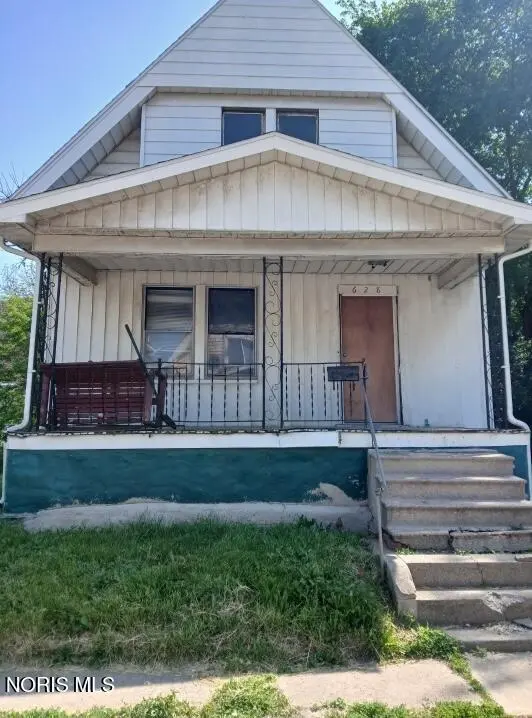
628 Blair Ct · Toledo, OH
Flood risk 1/10 · Minimal
- FEMA flood zone
- X (unshaded)
- Chance of flooding over 30 yrs
- 0.0%
- Est. flood insurance / yr
- $473 – $860
Fire risk 1/10 · Minimal
- Est. fire insurance / yr
- $713 – $1,323
Heat risk 3/10 · Minor
- Hot days now (above 100°F)
- 7 days/yr
- Hot days in 30 yrs
- 16 days/yr
Wind risk 2/10 · Minimal
- Chance of severe wind over 30 yrs
- —
Air-quality risk 2/10 · Minimal
- Unhealthy air days now
- 1 days/yr
- Unhealthy air days in 30 yrs
- 3 days/yr
Risk factors via First Street. Map © Google.
Why this score? — see what drove the B+ grade
The composite is a weighted blend of 9 inputs, each scored 0–100. Each bar is that input's sub-score; the figure is the points it added to the 100-point composite (weight × sub-score).
- Cash flow +30.0/30.0
- 1% rule +10.0/10.0
- DSCR +10.0/10.0
- ARV discount +9.3/15.0
- Appreciation +6.2/10.0
- Livability +3.3/5.0
- Rent growth +2.5/5.0
- Condition / age +2.5/5.0
- Schools +1.6/10.0
$39,000
🖨 Deal sheet (PDF) 📄 Offer letter ✓ Due diligence
Listing remarks MLS
GREAT FIRST HOME! STREET HAS LITTLE TRAFFIC!! THREE BEDROOMS, FULL BASEMENT, NICE FRONT PORCH. EASY TO SEE. CALL NOW!! PROPERTY BEING SOLD "AS IS"
Key facts
- 1,600 sq ft lot
- Built 1917
- Listed 17 days
Property features AI
Exterior
- Parking: Other parking
- Utilities: Electricity connected; Public water; Sanitary sewer
- Home design: Single-family residence; Residential property; Two levels (2 stories); No attached units; No common walls
- Construction: Other construction materials; Block foundation; Built as existing single-family home
- Exterior features: Shingle roof
Interior
- Kitchen: Kitchen on main level (10 x 11)
- Bedrooms: Bedroom 2 on upper level (8 x 10); Bedroom 3 on upper level (9 x 11)
- Flooring: Other flooring
- Bathrooms: 1 full bathroom
- Heating & cooling: Has heating (other type); Has cooling (other type)
- Interior features: 6 total rooms; Basement; Other interior features
- Laundry & utility: Laundry (other features)
Neighborhood map
What this means for you Summary
Snapshot
- This is a 3-bed/1.0-bath single-family listed at $39k.
Deal economics
- At list price, monthly cash flow is $757 ($9k/yr) — positive.
- The deal already cash-flows at list — no discount required.
- Meets the 1% rule at list price ($1k rent vs $39k).
- Recommended offer: $38k (1.5% below list) — sets the bar for market timing.
- Cap rate 29.6% vs local median 7.7% in Toledo — top-decile yield for the area; either an underpriced asset or a hidden risk that comps aren't pricing in. Stress-test before assuming the spread holds.
Location & tenants
- Location reads 66/100 on livability (#645 in OH) — a middle-class / working-renter tenant base. Strengths: cost of living A+, housing A+, health & safety A+; Watch: amenities C-, crime F, commute F.
- Toledo City (urban): math 15% / reading 24% proficiency, ranked #634 of 656 in OH (top 97%) — low school quality limits family demand, transient renter base, plan for 1-2y turnover; 72% free/reduced lunch — lower-income household profile, screen leases tightly.
- Zoned schools: Riverside Elementary School (math 8% / reading 12%, grade F, #1,471 of 1,584 statewide, top 95%, 361 students, 0% FRL); Woodward High School (math 2% / reading 22%, grade F, #726 of 781 statewide, top 94%, 672 students, 0% FRL) — zoned schools average 0% FRL vs 72% district-wide (72 pts lower); this property's tenant base skews higher-income than the district average.
- Market conditions: 16 active listings in the ZIP; 39 comparable units currently listed for rent nearby; rentals at typical pace (median 26d on market — plan ~3-4 weeks tenant-placement turnaround); 41% of comp listings sitting > 30 days — soft ceiling on asking rent; lower-income renter base — watch delinquency; 415 units permitted in Lucas County in 2024 (122 in 5+ unit buildings).
- At $1,297/mo this rent would consume 75% of the median local household income ($21k/yr) (locally 693% of renters already pay >50% of income on rent) — very limited rent-growth headroom before tenants either downsize or default.
Forward outlook
- In year one you build about $1k of equity ($270 loan paydown + $917 appreciation (2.4% local appreciation)).
- Lucas County population projected at -16% by 2050 — secular population decline; favor cash flow + early exit over multi-decade hold.
- At projected returns (2.4% appreciation + 3.0% rent growth), your $11k cash investment doubles in ~2 years — after that, you're playing with house money.
Negotiation context
- It's been on market 17 days — a 2% lower offer ($38k) is reasonable based on typical stale-listing flexibility.
- 5 sale attempts since 22y ago with the ask held roughly flat each time — persistent listings suggest the price (not the market) is what's stuck; bring a comps-based counter.
- Current owner paid $10k; list at $39k implies a 290% gain — meaningful room to come down on a strong offer.
Risks & watch-outs
- Watch-outs: built in 1917 — expect roof / HVAC / electrical / plumbing capex.
Questions for the listing agent
- Built in 1917 — when were the roof, HVAC, electrical panel, plumbing, and water heater last replaced?
- Is there a deadline driving the sale (1031 exchange, divorce, estate, relocation)? That informs how much negotiation room exists.
- Schools are D-rated, which usually means shorter tenancies and higher turnover. Who's the typical renter profile here, and what's been the actual vacancy rate?
- Crime grade is F in this area — have there been break-ins, vandalism, or insurance claims at this property in the last 3 years? What carrier currently insures it and at what premium?
- What's the average days-on-market for RENTAL listings here right now (not sales)? A rising rental-DOM trend means longer vacancies and softer asking-rent achievability than the comps imply.
- What's the recent tenant-quality profile in this submarket — average credit score on applications, eviction rate, late-payment / NSF rate, and stable-employment percentage? A property-management company in the area should have these aggregated.
- How much new for-sale + rental construction is in the pipeline within 1–3 miles? Heavy new supply typically softens prices + rents 12–24 months out; constrained supply supports both.
Investment metrics
- 1% rule
- 3.33% ✓
- Cap rate
- 29.58%
- Cash-on-cash
- 83.15%
- DSCR
- 4.70
- GRM
- 2.5
CMA / ARV
- ARV (on-the-fly)
- $40,638
- Comps found
- 7
Show comp detail 7 sales within ~0.75 mi
| Address | Dist | Beds/Ba | Sqft | Sold | Price | $/sf | Match |
|---|---|---|---|---|---|---|---|
| 718 Buffalo St | 0.07mi | 3/1.0 | 1,104 (+6%) | 12mo | $45,000 | $41 | 77 |
| 1411 N Erie St | 0.39mi | 3/1.0 | 1,010 (-3%) | 10mo | $25,000 | $25 | 69 |
| 1919 N Ontario St | 0.31mi | 3/1.0 | 890 (-15%) | 8mo | $27,000 | $30 | 54 |
| 832 Stickney Ave | 0.22mi | 2/1.0 (-1) | 900 (-14%) | 10mo | $35,000 | $39 | 54 |
| 813 Galena St | 0.46mi | 2/1.0 (-1) | 990 (-5%) | 15mo | $14,000 | $14 | 53 |
| 417 Cincinnati St | 0.71mi | 3/1.0 | 1,130 (+8%) | 11mo | $61,330 | $54 | 44 |
| 1313 N Erie St | 0.47mi | 2/1.0 (-1) | 886 (-15%) | 10mo | $39,000 | $44 | 40 |
Match score weights: distance 35% · size 25% · config 20% · recency 20%. Top-matched comps best support the ARV.
Projected returns pro-forma
2.35% appreciation · 3.0% rent growth · sell at horizon
- IRR
- 87.1%
- Equity multiple
- 5.72×
- Total profit
- $51,588
- Equity at exit
- $16,129
- IRR
- 87.0%
- Equity multiple
- 11.79×
- Total profit
- $117,827
- Equity at exit
- $23,814
Cash invested: $10,920 (down + closing). Projections, not guarantees.
Landlord ↔ Tenant lean methodology
- Overall (STATE)
- 73 Landlord-Friendly
- State Ohio
- 73 Landlord-Friendly · R+6
- County
- — inherits STATE
- City
- — inherits STATE
ZIP-level market 43604
- Home prices YoY
- 2.1%
- Active inventory
- 16
- Price-to-rent
- 2.5×
Monthly cashflow live
- Estimated rent
- $1,297 high interval (Pro) →
- Mortgage (P&I)
- −$205
- Tax from tax record
- −$47 /mo · $569/yr
- Insurance
- −$16
- HOA
- −$0
- Vacancy / Maint / Mgmt
- −$272
- Net cashflow
- $757
Break-even live
Sensitivity live
| Price | -10% $779 | -5% $768 | +0% $757 | +5% $746 | +10% $735 |
|---|---|---|---|---|---|
| Rent | -10% $654 | -5% $705 | +0% $757 | +5% $808 | +10% $859 |
| Rate | -1.0pp $776 | -0.5pp $767 | base $757 | +0.5pp $747 | +1.0pp $736 |
UW: 25.0% down · 7.5% · 30yr · 1.5% tax · 5.0% vac · 8.0% maint · 8.0% mgmt
Financing live
Cash to close
- Down payment
- $9,750
- Closing costs
- $1,170
- Reserves months
- —
- Total cash needed
- —
Loan-product check · same deal, 3 products live
Conventional
25% down · 7.5% · 30yr
- Down + closing
- —
- Monthly P&I
- —
- Monthly cashflow
- —
- DSCR
- —
- Eligible?
- —
Personal DTI + credit; lowest rate.
DSCR
20% down · 8.5% · 30yr
- Down + closing
- —
- Monthly P&I
- —
- Monthly cashflow
- —
- DSCR
- —
- Eligible?
- —
No personal income docs; deal must DSCR.
Hard money
10% down · 12.0% · 12mo
- Down + closing
- —
- Monthly P&I
- —
- Monthly cashflow
- —
- DSCR
- —
- Eligible?
- —
Short-term bridge; refi at stabilization.
Rent comps 39 comps
| Address | Beds | Baths | Sqft | Rent | $/sqft | DOM | Units | Dist |
|---|---|---|---|---|---|---|---|---|
| 1449 N Huron St Toledo, OH | 4.0 | 2.0 | 1430 | $1,045 | $0.73 | 16d | 1 | 0.34mi |
| 1951 N Summit St Unit 2 Toledo, OH | 2.0 | 1.0 | 835 | $800 | $0.96 | 46d | 1 | 0.35mi |
| 630 Mulberry St Toledo, OH | 2.0 | 1.0 | 1000 | $950 | $0.95 | 25d | 1 | 0.51mi |
| 1119 N Summit St Toledo, OH | 1.0–2.0 | 1.0–2.0 | 1023 | $1,750 | $1.71 | 16d | 2 | 0.70mi |
| 1119 N Summit St Toledo, OH | 2.0 | 2.0 | 1226 | $1,750 | $1.43 | 25d | 1 | 0.71mi |
| 1119 N Summit St Toledo, OH | 2.0 | 2.0 | 1500 | $1,890 | $1.26 | 46d | 1 | 0.71mi |
| 1031 N Michigan St Toledo, OH | 3.0 | 2.0 | 1488 | $1,195 | $0.80 | 25d | 1 | 0.75mi |
| 1964 Burr St Toledo, OH | 3.0 | 1.0 | 1159 | $1,250 | $1.08 | 46d | 1 | 0.82mi |
| 128 Carbon St Toledo, OH | 3.0 | 1.0 | 1113 | $1,200 | $1.08 | 25d | 1 | 0.84mi |
| 1337 Moore St Toledo, OH | 3.0 | 1.5 | 1194 | $995 | $0.83 | 23d | 1 | 0.87mi |
| 1848 Genesee St Toledo, OH | 3.0 | 1.0 | 1069 | $1,200 | $1.12 | 46d | 1 | 0.88mi |
| 1848 Genesee St Toledo, OH | 3.0 | 1.0 | 1069 | $1,300 | $1.22 | 25d | 1 | 0.88mi |
| 413 Sandusky St Toledo, OH | 2.0 | 1.0 | 900 | $775 | $0.86 | 25d | 1 | 0.96mi |
| 626 Walnut St Toledo, OH | 3.0 | 1.0 | 1088 | $995 | $0.91 | 46d | 1 | 0.97mi |
| 221 Licking St Unit 2 Toledo, OH | 3.0 | 1.0 | 1048 | $1,099 | $1.05 | 25d | 1 | 0.99mi |
| 1305 Mott Ave Toledo, OH | 3.0 | 1.0 | 1080 | $1,000 | $0.93 | 46d | 1 | 1.00mi |
| 1306 Mott Ave Toledo, OH | 3.0 | 1.5 | 1282 | $1,149 | $0.90 | 46d | 1 | 1.01mi |
| 625 Riverside Dr Toledo, OH | 1.0–2.0 | 1.0–2.0 | 860 | $1,767 | $2.05 | 16d | 37 | 1.13mi |
| 2621 Chestnut St Toledo, OH | 3.0 | 1.0 | 1444 | $1,250 | $0.87 | 46d | 1 | 1.15mi |
| 420 Everett St Toledo, OH | 2.0 | 1.0 | 1000 | $975 | $0.97 | 25d | 1 | 1.26mi |
| 2932 N Ontario St Toledo, OH | 2.0 | 1.0 | 750 | $750 | $1.00 | 25d | 1 | 1.30mi |
| 2453 Caledonia St Toledo, OH | 2.0 | 1.0 | 1179 | $810 | $0.69 | 16d | 1 | 1.30mi |
| 329 Mettler St Toledo, OH | 2.0 | 1.0 | 908 | $975 | $1.07 | 16d | 1 | 1.30mi |
| 426 Beacon St Toledo, OH | 1.0–2.0 | 1.0–1.5 | 809 | $882 | $1.09 | 16d | 10 | 1.32mi |
| 223 Valleywood Dr Toledo, OH | 2.0 | 1.0 | 1098 | $1,099 | $1.00 | 25d | 1 | 1.32mi |
| 225 Palmer St Toledo, OH | 2.0 | 1.0 | 924 | $895 | $0.97 | 46d | 1 | 1.33mi |
| 3405 Beaumont Dr Toledo, OH | 2.0 | 1.0 | 855 | $745 | $0.87 | 16d | 1 | 1.35mi |
| 513 Adams St Toledo, OH | 1.0–2.0 | 1.0 | 1175 | $1,424 | $1.21 | 16d | 11 | 1.39mi |
| 414 Platt St Unit ST-3 Toledo, OH | 3.0 | 1.0 | 1500 | $1,150 | $0.77 | 25d | 1 | 1.39mi |
| 319 Dexter St Toledo, OH | 2.0 | 1.0 | 990 | $1,005 | $1.02 | 46d | 1 | 1.39mi |
| 830 Homer Ave Toledo, OH | 3.0 | 1.0 | 1208 | $895 | $0.74 | 46d | 1 | 1.40mi |
| 227 Everett St Toledo, OH | 2.0 | 1.0 | 914 | $850 | $0.93 | 46d | 1 | 1.40mi |
| 420 Platt St Toledo, OH | 2.0 | 1.0 | 1499 | $685 | $0.46 | 23d | 1 | 1.40mi |
| 470 2nd St Unit 1 Toledo, OH | 2.0 | 1.0 | 950 | $799 | $0.84 | 46d | 1 | 1.41mi |
| 3439 Jeannette Ave Toledo, OH | 3.0 | 1.0 | 1098 | $1,095 | $1.00 | 46d | 1 | 1.42mi |
| 152 Austin St Toledo, OH | 4.0 | 1.5 | 1370 | $1,150 | $0.84 | 25d | 1 | 1.44mi |
| 653 Oswald St Toledo, OH | 2.0 | 1.0 | 920 | $800 | $0.87 | 46d | 1 | 1.47mi |
| 3474 Maher St Toledo, OH | 2.0 | 1.0 | 736 | $1,125 | $1.53 | 46d | 1 | 1.48mi |
| 710 E Lake St Toledo, OH | 3.0 | 1.0 | 1242 | $1,000 | $0.81 | 16d | 1 | 1.49mi |
Listing history 12 events
-
2026-06-21days on market $39,000 Active 17 DOM
-
2026-06-18days on market $39,000 Active 14 DOM
-
2026-06-17days on market $39,000 Active 13 DOM
-
2026-06-16days on market $39,000 Active 12 DOM
-
2026-06-15days on market $39,000 Active 11 DOM
-
2026-06-14days on market $39,000 Active 9 DOM
-
2026-06-10days on market $39,000 Active 6 DOM
-
2026-06-09days on market $39,000 Active 5 DOM
-
2026-06-08days on market $39,000 Active 4 DOM
-
2026-06-07days on market $39,000 Active 3 DOM
-
2026-06-05remarks 405-char remark
-
2026-06-05$39,000 Active 1 DOM
ⓘ Source: listings_history table (triggers on properties + properties_extension) + one-shot
backfill from property_details.listing_events for pre-trigger history.
Tax reassessment forecast OH · Partial reset (capped growth)
- Current annual tax
- $569 · $47/mo
- Projected year-2 tax
- $588 · $49/mo
- Expected delta
- +$20/yr (+$2/mo · 3.5%)
ⓘ Screening estimate from a state-policy table — verify with the county assessor before closing.
Climate risk First Street
- Flood 1/10 Low FEMA zone X (unshaded) · 0% chance over 30 yrs
- Wildfire 1/10 Low
- Heat 3/10 Moderate 7 d/yr ≥100°F today · 16 d/yr by 30 yrs out
- Wind 2/10 Low
- Air quality 2/10 Low 1 unhealthy d/yr today · 3 by 30 yrs out
Nearby sold comps map
Loading sold comps map…
Walkable amenities ~0.75 mi
Loading nearby amenities…
Taxation est. · year 1
- Rental income
- $15,567
- − Mortgage interest
- −$2,185
- − Property taxes
- −$569
- − Insurance
- −$195
- − Repairs & maintenance
- −$1,245
- − Management
- −$1,245
- − Depreciation
- −$1,135
- Taxable income
- $8,994
- Est. tax owed @ 24.0%
- −$2,158
- After-tax cash flow
- $6,922/yr
For passive investors: Depreciation is non-cash, so a rental often shows a tax loss while cash-flowing — sheltering income. Rental losses are passive: they offset passive income freely, and up to $25,000/yr can offset ordinary (W-2) income if you actively participate and your MAGI is under $100k (phasing out to $0 by $150k); unused losses carry forward. On sale, claimed depreciation is recaptured at up to 25%, and gains may owe capital-gains tax (a 1031 exchange can defer both). Figures are a year-1 estimate at your 24.0% rate — not tax advice; consult a CPA.
Schools (NCES district)
- District
- Toledo City
- NCES district ID
- 3904490
- Math proficiency
- 15% ▼ -16.00%
- Reading proficiency
- 24% ▼ -13.00%
- Median HH income
- $32,137
- Composite
- 15.76/100
- National rank
- #9276
- State rank
- #634 of 656 in OH
Livability — Toledo
- Score
- 66/100
- State rank
- #645
- US rank
- #11442
Category grades
Schools grade is shown separately in the Schools card above.
Census & demographics
- Census place
- Toledo, OH
- County
- Lucas County · 380,724 people
- City population
- 280,811
- Metro
- Toledo, OH
- Population (ZIP)
- 9,594
- Household income
- $20,734
- Rent vs Own
- Severe rent burden
- 693.0
Population outlook (Lucas County) Hauer SSP2
- Today (2025)
- 420,751 people
- By 2030
- 410,187 · -2.5%
- By 2040
- 384,019 · -8.7%
- By 2050
- 355,125 · -15.6%
- By 2075
- 291,683 · -30.7%
- By 2100
- 233,670 · -44.5%
Race, ethnicity, and origin ACS 2023
- Neighborhood character
- Diverse neighborhood (Simpson 0.61)
- Race & ethnicity
- Black 51% White 34% Two or more races 9% Hispanic / Latino 9%
- Hispanic origin (detail)
- Mexican 8%
- Common ancestry
- Romanian 2% Slovak 1% Lithuanian 1%
- Foreign-born
- 4% · Canada, South Korea, China
- Languages at home
- 95% English-only · Spanish 3% Arabic 1%
Political lean MEDSL · Lucas
- 2024 margin
- D (+12.6) · D 55.8% · R 43.2%
- 2008→2024 swing
- -18.9pp toward R · 2008: 31.4pp · 2024: 12.6pp
- All cycles
- 2024: D+12.6 2020: D+16.8 2016: D+17.4 2012: D+30.4 2008: D+31.4
Not yet ingested
- Civics
- —
Market trends
- HPI YoY
- ▲ 2.35%
- Current HPI
- 111.6154
- Rent YoY
- —
- Metro
- Toledo, OH
- State GDP YoY
- ▲ 1.98%
- F500 in state
- 48
Industry mix (Fortune 500 HQ in OH)
| Industry | F500 HQs | Revenue |
|---|---|---|
| Insurance | 3 | $145B |
|
||
| Industrial Machinery | 3 | $49B |
|
||
| Financial Services | 3 | $24B |
|
||
| Consumer Goods | 2 | $93B |
|
||
| Aerospace / Defense | 2 | $47B |
|
||
| Utilities | 2 | $33B |
|
||
Price history
+129.4% since first listed14 events — show timeline
- 2026-05-29 Listed $39,000 NORIS
- 2025-10-14 Price Changed $8,000 NORIS
- 2025-10-09 Price Changed $10,000 NORIS
- 2006-08-14 Sold (MLS) $10,000 NORIS
- 2006-07-26 Price Changed $21,000 NORIS
- 2006-07-26 Listed $21,000 NORIS
- 2006-05-30 Listing Removed — NORIS
- 2005-12-08 Listed $21,000 NORIS
- 2005-07-29 Sold (MLS) $8,000 NORIS
- 2004-12-17 Listed $11,700 NORIS
- 2004-12-15 Listing Removed — NORIS
- 2004-06-15 Listed $16,650 NORIS
- 1998-09-17 Sold (Public Records) $25,000 Public Records
- 1989-05-19 Sold (Public Records) $17,000 Public Records
Property tax history
+3.4%/yrLatest (2025): $569 · +3.0% YoY. Source: county tax records.
Cash-flow waterfall
monthlySold comps — $/sqft
last 12 mo · ≤1 miLoading sold comps…